Agriculture Analytics Market Analysis, Size, and Forecast 2026-2030: North America (US, Canada, and Mexico), Europe (Germany, UK, and France), APAC (China, Japan, and India), South America (Brazil, Argentina, and Colombia), Middle East and Africa (Saudi Arabia, UAE, and South Africa), and Rest of World (ROW)

Agriculture Analytics Market Analysis, Size, and Forecast 2026-2030:
North America (US, Canada, and Mexico), Europe (Germany, UK, and France), APAC (China, Japan, and India), South America (Brazil, Argentina, and Colombia), Middle East and Africa (Saudi Arabia, UAE, and South Africa), and Rest of World (ROW)

Published: Dec 2025 308 Pages SKU: IRTNTR80113

Market Overview at a Glance

$1.65 B
Market Opportunity
13.6%
CAGR 2025 - 2030
43.4%
North America Growth
$971.1 Mn
Solutions segment 2024

Agriculture Analytics Market Size 2026-2030

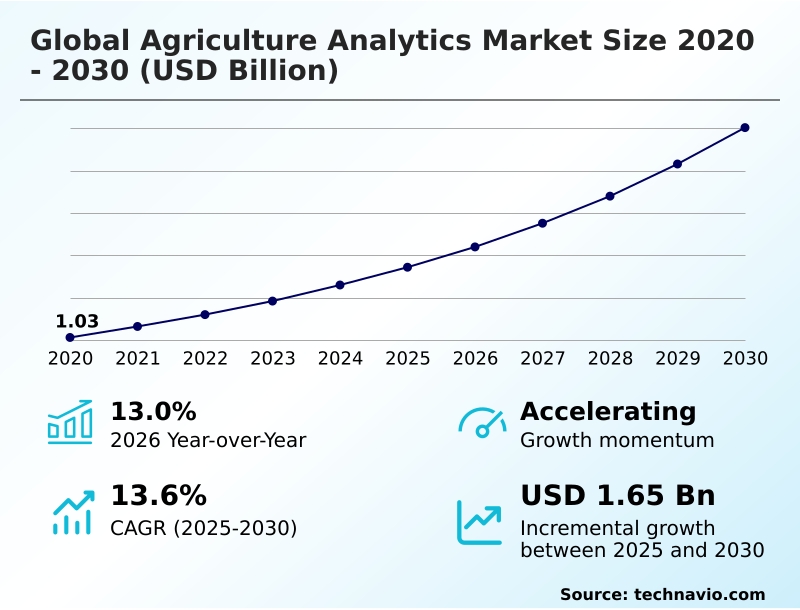
The agriculture analytics market size is valued to increase by USD 1.65 billion, at a CAGR of 13.6% from 2025 to 2030. Convergence of advanced technologies and enhanced data integration will drive the agriculture analytics market.

Major Market Trends & Insights

  • North America dominated the market and accounted for a 43.4% growth during the forecast period.
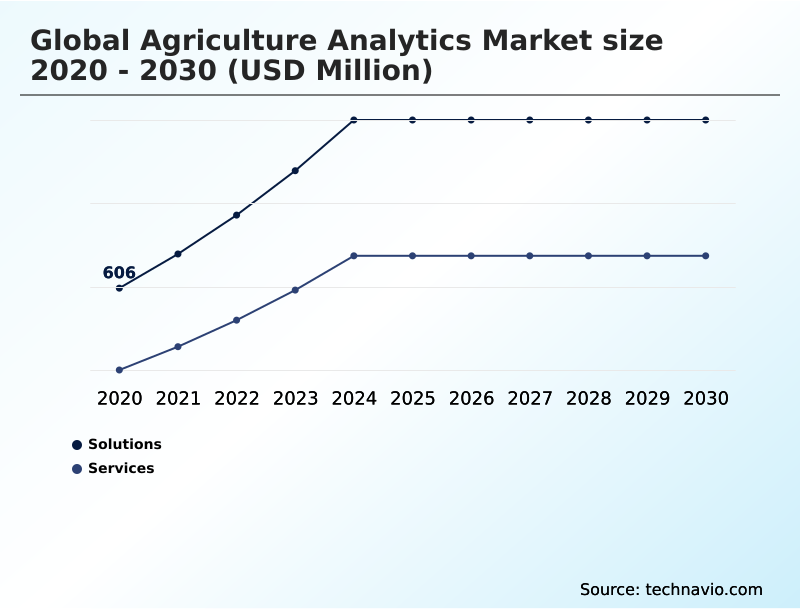
  • By Type - Solutions segment was valued at USD 971.1 million in 2024
  • By Application - Precision farming segment accounted for the largest market revenue share in 2024

Market Size & Forecast

  • Market Opportunities: USD 2.48 billion
  • Market Future Opportunities: USD 1.65 billion
  • CAGR from 2025 to 2030 : 13.6%

Market Summary

  • The agriculture analytics market is undergoing a fundamental transformation, shifting from traditional practices to a data-centric, precision-driven model. This evolution is propelled by the need to enhance food production efficiency and sustainability for a growing global population.
  • Key technologies such as precision agriculture software, IoT in farming, and AI for crop management enable the collection and analysis of vast datasets related to soil conditions, weather patterns, and crop health. By leveraging data-driven agriculture principles, agribusinesses can make more informed decisions.
  • For instance, an operator can use an integrated agriculture analytics platform to synthesize real-time drone data and satellite imagery to create precise variable rate application maps for fertilizers, optimizing input costs while complying with environmental regulations. The rise of sustainable farming technology and the demand for food traceability solutions further drive adoption.
  • However, challenges related to data fragmentation and the need for new data interoperability standards can hinder the seamless flow of information across different systems, impacting the full potential of agribusiness intelligence and smart farming solutions.

What will be the Size of the Agriculture Analytics Market during the forecast period?

Get Key Insights on Market Forecast (PDF) Request Free Sample

How is the Agriculture Analytics Market Segmented?

The agriculture analytics industry research report provides comprehensive data (region-wise segment analysis), with forecasts and estimates in "USD million" for the period 2026-2030, as well as historical data from 2020-2024 for the following segments.

  • Type
    • Solutions
    • Services
  • Application
    • Precision farming
    • Livestock farming
    • Aquaculture farming
    • Vertical farming
    • Others
  • Deployment
    • Cloud based
    • On premises
  • Geography
    • North America
      • US
      • Canada
      • Mexico
    • Europe
      • Germany
      • UK
      • France
    • APAC
      • China
      • Japan
      • India
    • South America
      • Brazil
      • Argentina
      • Colombia
    • Middle East and Africa
      • Saudi Arabia
      • UAE
      • South Africa
    • Rest of World (ROW)

By Type Insights

The solutions segment is estimated to witness significant growth during the forecast period.

The solutions segment is defined by a shift toward integrated systems that provide actionable intelligence. Modern offerings encompass comprehensive agriculture analytics platforms and holistic smart farming solutions that leverage agritech data integration to create a unified operational view.

These systems utilize AI algorithms and machine learning for data-driven agriculture, moving beyond simple data collection. Core functionalities include real-time livestock monitoring and precision farming capabilities powered by a network of IoT sensors.

The adoption of AI for crop management has demonstrated tangible results, with some applications achieving up to a 4% reduction in critical inputs like feed.

This evolution from standalone tools to cohesive, intelligent platforms is central to improving on-farm efficiency and decision-making accuracy.

Request Free Sample

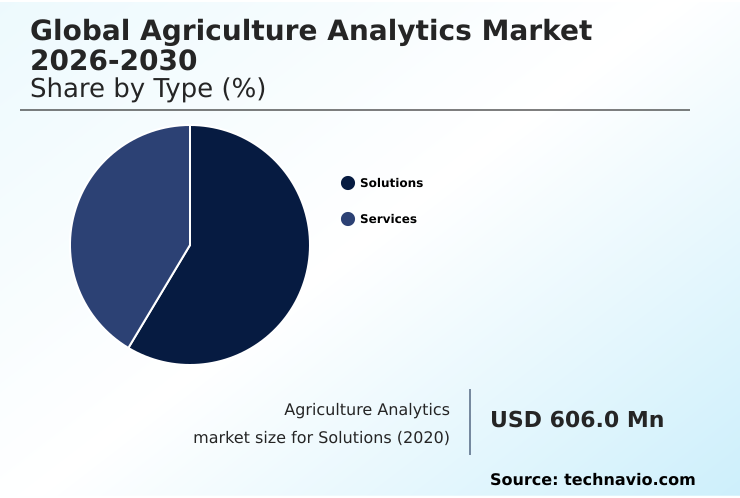
The Solutions segment was valued at USD 971.1 million in 2024 and showed a gradual increase during the forecast period.

Request Free Sample

Regional Analysis

North America is estimated to contribute 43.4% to the growth of the global market during the forecast period.Technavio’s analysts have elaborately explained the regional trends and drivers that shape the market during the forecast period.

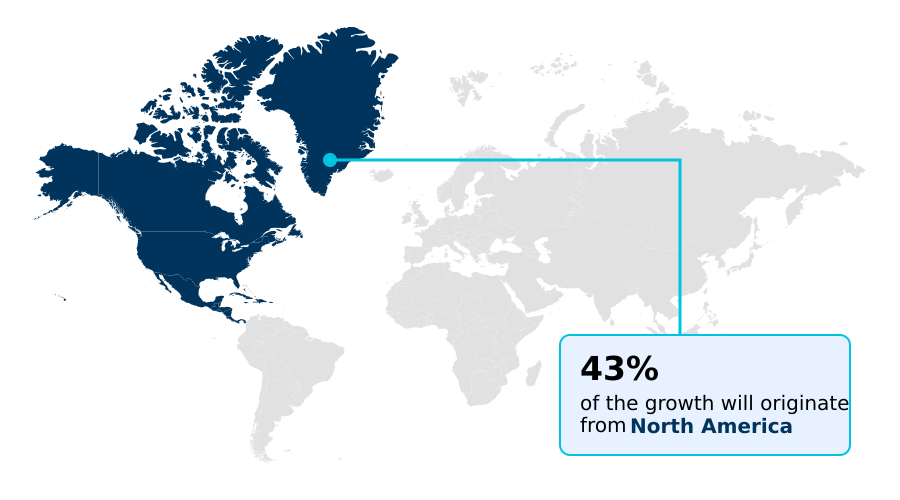
See How Agriculture Analytics Market Demand is Rising in North America Request Free Sample

The geographic landscape is led by North America, which accounts for over 43% of the market's incremental growth, driven by large-scale adoption of integrated farm management systems (FMS) and digital twin models for operational planning.

In Europe, policy mandates are accelerating the use of platforms for ESG tracking and supply chain traceability, often leveraging blockchain in agriculture.

The APAC region shows the fastest expansion, with a focus on deploying farm robotics analytics to address labor shortages. Demand for agricultural supply chain visibility is global, compelling producers to adopt carbon credit verification tech and regenerative agriculture data platforms.

The maturity of on-farm data processing varies, but the overall trend is toward greater data integration to enhance productivity and meet international standards.

Market Dynamics

Our researchers analyzed the data with 2025 as the base year, along with the key drivers, trends, and challenges. A holistic analysis of drivers will help companies refine their marketing strategies to gain a competitive advantage.

  • The practical implementation of advanced technology is reshaping modern agriculture, with a focus on achieving tangible outcomes. The practice of using ai for pest outbreak prediction is becoming a cornerstone of proactive crop management, moving beyond reactive treatments.
  • Similarly, leveraging iot sensor data for precise irrigation and satellite imagery for crop health monitoring are key tactics for resource optimization and reducing water usage with analytics tools. The primary goal remains improving farm yield with precision farming, a task increasingly supported by real-time crop monitoring solutions and alerts.
  • In animal agriculture, livestock health monitoring using wearables and software for analyzing livestock behavior with software offer unprecedented insights. The entire value chain is being transformed by blockchain for food supply chain traceability. Despite these advances, calculating roi of agriculture analytics software remains a critical concern for producers.
  • A significant technical hurdle is solving data interoperability in agritech platforms, which currently limits the effectiveness of using cloud platforms for farm data analysis. Farms with integrated, ai-powered farm management systems show resource efficiency gains that are often double those of operations still struggling with siloed data.
  • The industry is also seeing specialized tools, such as those for drone analytics for high-value crop management and creating digital twins for farm simulation, becoming more common.
  • Ultimately, success hinges on machine learning for accurate yield forecasting, optimizing fertilizer with variable rate application, integrating weather forecast data in farming, and ensuring ESG reporting automation in agriculture is seamless, which all contribute to implementing data-driven sustainable farming practices.

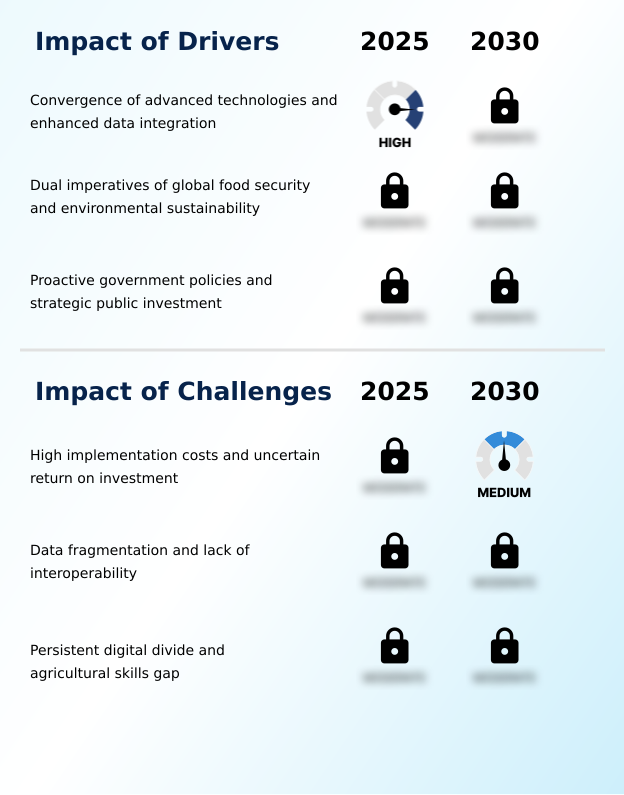
What are the key market drivers leading to the rise in the adoption of Agriculture Analytics Industry?

  • The convergence of advanced technologies, including AI, IoT, and cloud computing, coupled with enhanced data integration, serves as the primary driver accelerating market expansion.

  • A primary market driver is the synergistic convergence of advanced technologies. The expansion is fueled by the integration of cloud computing for scalable data processing, high-resolution satellite imagery, and granular drone data into user-friendly platforms.
  • This fusion of hardware and software enables precise yield forecasting and early pest detection, transforming farm management. The proliferation of IoT in farming provides the continuous data stream necessary for these advanced analytics.
  • Specialized precision agriculture software and livestock analytics tools are becoming essential.
  • Moreover, the growth in controlled environments is supported by sophisticated aquaculture monitoring systems and vertical farming analytics, with some farms reporting a 20% increase in productivity through optimized resource management, underscoring the shift toward data-centric operations.

What are the market trends shaping the Agriculture Analytics Industry?

  • A defining trend is the market's evolution from descriptive analytics toward advanced predictive and prescriptive capabilities, equipping stakeholders with forward-looking insights and actionable recommendations for proactive decision-making.

  • A defining trend is the evolution toward proactive management through predictive pest modeling and remote sensing technology. The market is shifting from reactive measures to climate-resilient agriculture strategies guided by advanced analytics. This transition is powered by autonomous machinery and agricultural robotics, which depend on real-time analysis of hyperspectral imaging and genomic data analysis.
  • The implementation of a digital agriculture mission in several nations aims to standardize data, promoting the adoption of food traceability solutions and smart greenhouse controls. However, achieving true data interoperability standards remains a critical goal, with current fragmentation limiting the full potential of integrated systems and causing inefficiencies that can reduce operational cost savings by up to 15%.

What challenges does the Agriculture Analytics Industry face during its growth?

  • High implementation costs and the difficulty in forecasting a clear return on investment present a significant challenge to widespread market adoption and industry growth.

  • Key challenges temper the market’s growth trajectory, primarily centered on implementation hurdles and skill gaps. While the benefits of sustainable farming technology and robust farm data management are recognized, the high upfront cost of equipment for variable rate application and systems that manage telematics data is a major barrier; nearly 50% of farmers cite cost as a primary deterrent.
  • A significant skills deficit also exists, with 52% of the workforce lacking advanced technical knowledge. Effective water management and crop scouting require data literacy, yet only 40% feel confident using these tools. This gap hinders the potential of agribusiness intelligence and advanced crop yield prediction models powered by technologies like automated irrigation systems and detailed soil health analysis.

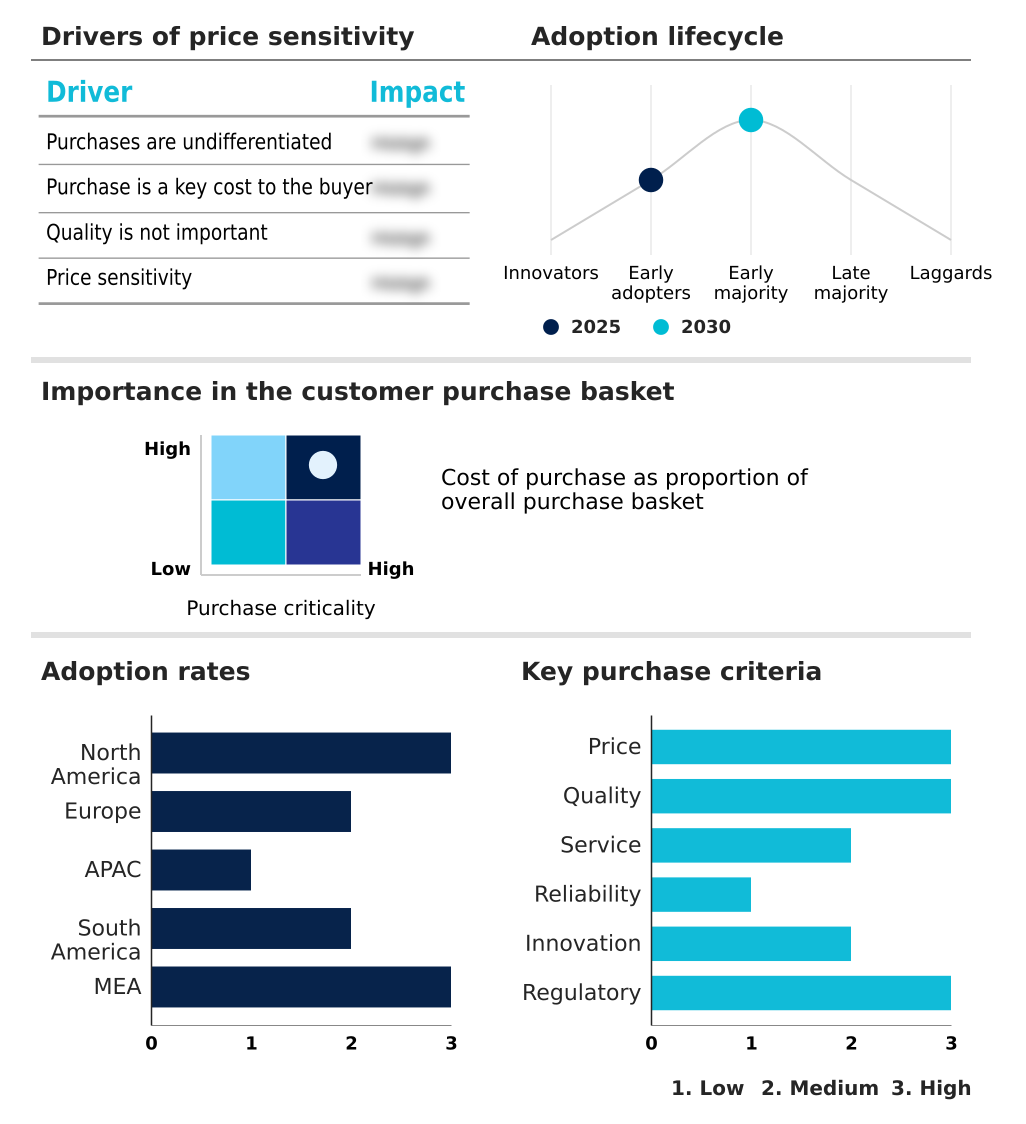
Exclusive Technavio Analysis on Customer Landscape

The agriculture analytics market forecasting report includes the adoption lifecycle of the market, covering from the innovator’s stage to the laggard’s stage. It focuses on adoption rates in different regions based on penetration. Furthermore, the agriculture analytics market report also includes key purchase criteria and drivers of price sensitivity to help companies evaluate and develop their market growth analysis strategies.

Customer Landscape of Agriculture Analytics Industry

Competitive Landscape

Companies are implementing various strategies, such as strategic alliances, agriculture analytics market forecast, partnerships, mergers and acquisitions, geographical expansion, and product/service launches, to enhance their presence in the industry.

A.A.A Taranis Visual Ltd. - Offerings focus on integrated platforms for precision farming, delivering AI-driven insights for yield forecasting, resource optimization, and automated operational control.

The industry research and growth report includes detailed analyses of the competitive landscape of the market and information about key companies, including:

  • A.A.A Taranis Visual Ltd.
  • Accenture PLC
  • AGCO Corp.
  • Agribotix
  • Bayer AG
  • Conservis Corp.
  • Corteva Inc.
  • Cropin Technology
  • Deere and Co.
  • Farmers Edge Inc.
  • IBM Corp.
  • Iteris Inc.
  • Microsoft Corp.
  • Oracle Corp.
  • PrecisionHawk Inc.
  • SAP SE
  • Trimble Inc.
  • Vistex Inc.
  • Wipro Ltd.
  • Xylem Inc.

Qualitative and quantitative analysis of companies has been conducted to help clients understand the wider business environment as well as the strengths and weaknesses of key industry players. Data is qualitatively analyzed to categorize companies as pure play, category-focused, industry-focused, and diversified; it is quantitatively analyzed to categorize companies as dominant, leading, strong, tentative, and weak.

Recent Development and News in Agriculture analytics market

  • In March 2025, a major European grocery retail conglomerate mandated that its fresh produce suppliers implement certified analytics platforms to track and report on key sustainability metrics, including water usage and on-farm carbon emissions.
  • In April 2025, a leading autonomous agricultural machinery manufacturer announced a strategic partnership with a global cloud computing provider to launch an integrated farm management platform utilizing AI for predictive modeling of pest outbreaks.
  • In January 2025, Lindsay Corp. formed a strategic partnership with Pessl Instruments to integrate field-level weather and soil data directly into its advanced irrigation management platform, enhancing decision-making capabilities for farmers.
  • In May 2025, an international consortium of impact investors launched a multi-billion dollar fund dedicated to scaling technologies for regenerative agriculture, with a core funding requirement for companies to use advanced analytics to quantify environmental impacts.

Dive into Technavio’s robust research methodology, blending expert interviews, extensive data synthesis, and validated models for unparalleled Agriculture Analytics Market insights. See full methodology.

Market Scope
Page number 308
Base year 2025
Historic period 2020-2024
Forecast period 2026-2030
Growth momentum & CAGR Accelerate at a CAGR of 13.6%
Market growth 2026-2030 USD 1651.7 million
Market structure Fragmented
YoY growth 2025-2026(%) 13.0%
Key countries US, Canada, Mexico, Germany, UK, France, Italy, The Netherlands, Spain, China, Japan, India, South Korea, Australia, Indonesia, Brazil, Argentina, Colombia, Saudi Arabia, UAE, South Africa, Israel and Turkey
Competitive landscape Leading Companies, Market Positioning of Companies, Competitive Strategies, and Industry Risks

Request Free Sample

Research Analyst Overview

  • The agriculture analytics market is characterized by the continuous integration of advanced digital tools into core farming operations. The adoption of precision farming is foundational, supported by a network of IoT sensors, satellite imagery, and drone data that feed sophisticated AI algorithms. These systems utilize machine learning and cloud computing to enable precise yield forecasting and early pest detection.
  • In animal agriculture, livestock monitoring is becoming increasingly sophisticated. For boardroom-level strategy, the implementation of blockchain in agriculture for supply chain traceability is critical for meeting ESG tracking mandates. On the operational side, farm management systems (FMS) are evolving to incorporate digital twin models for simulation and telematics data from autonomous machinery for efficiency gains.
  • These integrated platforms have demonstrated significant impact, with some users reporting a 4% reduction in key input costs. The use of hyperspectral imaging and remote sensing technology is advancing crop scouting and soil health analysis, while agricultural robotics and predictive pest modeling are automating complex tasks, including variable rate application based on genomic data analysis.

What are the Key Data Covered in this Agriculture Analytics Market Research and Growth Report?

  • What is the expected growth of the Agriculture Analytics Market between 2026 and 2030?

    • USD 1.65 billion, at a CAGR of 13.6%

  • What segmentation does the market report cover?

    • The report is segmented by Type (Solutions, and Services), Application (Precision farming, Livestock monitoring, Aquaculture farming, Vertical farming, and Others), Deployment (Cloud based, and On premises) and Geography (North America, Europe, APAC, South America, Middle East and Africa)

  • Which regions are analyzed in the report?

    • North America, Europe, APAC, South America and Middle East and Africa

  • What are the key growth drivers and market challenges?

    • Convergence of advanced technologies and enhanced data integration, High implementation costs and uncertain return on investment

  • Who are the major players in the Agriculture Analytics Market?

    • A.A.A Taranis Visual Ltd., Accenture PLC, AGCO Corp., Agribotix, Bayer AG, Conservis Corp., Corteva Inc., Cropin Technology, Deere and Co., Farmers Edge Inc., IBM Corp., Iteris Inc., Microsoft Corp., Oracle Corp., PrecisionHawk Inc., SAP SE, Trimble Inc., Vistex Inc., Wipro Ltd. and Xylem Inc.

Market Research Insights

  • The dynamics of the agriculture analytics market are shaped by the drive for operational efficiency and sustainability. The adoption of smart farming solutions and agritech data integration is critical, yet significant hurdles remain.
  • A notable skills gap persists, with 52% of the agricultural workforce lacking advanced technical knowledge, which hinders the effective use of sophisticated AI for crop management and data-driven agriculture techniques. Furthermore, high implementation costs are a primary barrier for nearly half of all producers, creating uncertainty around the ROI for precision agriculture software and livestock analytics tools.
  • Despite these challenges, platforms that improve resource use, such as those achieving a 4% reduction in feed consumption through monitoring, demonstrate a clear value proposition, encouraging further investment in sustainable farming technology.

We can help! Our analysts can customize this agriculture analytics market research report to meet your requirements.

Get in touch

1. Executive Summary

1.1 Market overview

Executive Summary - Chart on Market Overview
Executive Summary - Data Table on Market Overview
Executive Summary - Chart on Global Market Characteristics
Executive Summary - Chart on Market by Geography
Executive Summary - Chart on Market Segmentation by Type
Executive Summary - Chart on Market Segmentation by Application
Executive Summary - Chart on Market Segmentation by Deployment
Executive Summary - Chart on Incremental Growth
Executive Summary - Data Table on Incremental Growth
Executive Summary - Chart on Company Market Positioning

2. Technavio Analysis

2.1 Analysis of price sensitivity, lifecycle, customer purchase basket, adoption rates, and purchase criteria

2.2 Criticality of inputs and Factors of differentiation

Chart on Overview on criticality of inputs and factors of differentiation

2.3 Factors of disruption

Chart on Overview on factors of disruption

2.4 Impact of drivers and challenges

Chart on Impact of drivers and challenges in 2025 and 2030

3. Market Landscape

3.1 Market ecosystem

Chart on Parent Market
Data Table on - Parent Market

3.2 Market characteristics

Chart on Market characteristics analysis

3.3 Value chain analysis

Chart on Value chain analysis

4. Market Sizing

4.1 Market definition

Data Table on Offerings of companies included in the market definition

4.2 Market segment analysis

Market segments

4.3 Market size 2025

4.4 Market outlook: Forecast for 2025-2030

Chart on Global - Market size and forecast 2025-2030 ($ million)
Data Table on Global - Market size and forecast 2025-2030 ($ million)
Chart on Global Market: Year-over-year growth 2025-2030 (%)
Data Table on Global Market: Year-over-year growth 2025-2030 (%)

5. Historic Market Size

5.1 Global Agriculture Analytics Market 2020 - 2024

Historic Market Size - Data Table on Global Agriculture Analytics Market 2020 - 2024 ($ million)

5.2 Type segment analysis 2020 - 2024

Historic Market Size - Type Segment 2020 - 2024 ($ million)

5.3 Application segment analysis 2020 - 2024

Historic Market Size - Application Segment 2020 - 2024 ($ million)

5.4 Deployment segment analysis 2020 - 2024

Historic Market Size - Deployment Segment 2020 - 2024 ($ million)

5.5 Geography segment analysis 2020 - 2024

Historic Market Size - Geography Segment 2020 - 2024 ($ million)

5.6 Country segment analysis 2020 - 2024

Historic Market Size - Country Segment 2020 - 2024 ($ million)

6. Qualitative Analysis

6.1 The AI impact on global agriculture analytics market

7. Five Forces Analysis

7.1 Five forces summary

Five forces analysis - Comparison between 2025 and 2030

7.2 Bargaining power of buyers

Bargaining power of buyers - Impact of key factors 2025 and 2030

7.3 Bargaining power of suppliers

Bargaining power of suppliers - Impact of key factors in 2025 and 2030

7.4 Threat of new entrants

Threat of new entrants - Impact of key factors in 2025 and 2030

7.5 Threat of substitutes

Threat of substitutes - Impact of key factors in 2025 and 2030

7.6 Threat of rivalry

Threat of rivalry - Impact of key factors in 2025 and 2030

7.7 Market condition

Chart on Market condition - Five forces 2025 and 2030

8. Market Segmentation by Type

8.1 Market segments

Chart on Type - Market share 2025-2030 (%)
Data Table on Type - Market share 2025-2030 (%)

8.2 Comparison by Type

Chart on Comparison by Type
Data Table on Comparison by Type

8.3 Solutions - Market size and forecast 2025-2030

Chart on Solutions - Market size and forecast 2025-2030 ($ million)
Data Table on Solutions - Market size and forecast 2025-2030 ($ million)
Chart on Solutions - Year-over-year growth 2025-2030 (%)
Data Table on Solutions - Year-over-year growth 2025-2030 (%)

8.4 Services - Market size and forecast 2025-2030

Chart on Services - Market size and forecast 2025-2030 ($ million)
Data Table on Services - Market size and forecast 2025-2030 ($ million)
Chart on Services - Year-over-year growth 2025-2030 (%)
Data Table on Services - Year-over-year growth 2025-2030 (%)

8.5 Market opportunity by Type

Market opportunity by Type ($ million)
Data Table on Market opportunity by Type ($ million)

9. Market Segmentation by Application

9.1 Market segments

Chart on Application - Market share 2025-2030 (%)
Data Table on Application - Market share 2025-2030 (%)

9.2 Comparison by Application

Chart on Comparison by Application
Data Table on Comparison by Application

9.3 Precision farming - Market size and forecast 2025-2030

Chart on Precision farming - Market size and forecast 2025-2030 ($ million)
Data Table on Precision farming - Market size and forecast 2025-2030 ($ million)
Chart on Precision farming - Year-over-year growth 2025-2030 (%)
Data Table on Precision farming - Year-over-year growth 2025-2030 (%)

9.4 Livestock farming - Market size and forecast 2025-2030

Chart on Livestock farming - Market size and forecast 2025-2030 ($ million)
Data Table on Livestock farming - Market size and forecast 2025-2030 ($ million)
Chart on Livestock farming - Year-over-year growth 2025-2030 (%)
Data Table on Livestock farming - Year-over-year growth 2025-2030 (%)

9.5 Aquaculture farming - Market size and forecast 2025-2030

Chart on Aquaculture farming - Market size and forecast 2025-2030 ($ million)
Data Table on Aquaculture farming - Market size and forecast 2025-2030 ($ million)
Chart on Aquaculture farming - Year-over-year growth 2025-2030 (%)
Data Table on Aquaculture farming - Year-over-year growth 2025-2030 (%)

9.6 Vertical farming - Market size and forecast 2025-2030

Chart on Vertical farming - Market size and forecast 2025-2030 ($ million)
Data Table on Vertical farming - Market size and forecast 2025-2030 ($ million)
Chart on Vertical farming - Year-over-year growth 2025-2030 (%)
Data Table on Vertical farming - Year-over-year growth 2025-2030 (%)

9.7 Others - Market size and forecast 2025-2030

Chart on Others - Market size and forecast 2025-2030 ($ million)
Data Table on Others - Market size and forecast 2025-2030 ($ million)
Chart on Others - Year-over-year growth 2025-2030 (%)
Data Table on Others - Year-over-year growth 2025-2030 (%)

9.8 Market opportunity by Application

Market opportunity by Application ($ million)
Data Table on Market opportunity by Application ($ million)

10. Market Segmentation by Deployment

10.1 Market segments

Chart on Deployment - Market share 2025-2030 (%)
Data Table on Deployment - Market share 2025-2030 (%)

10.2 Comparison by Deployment

Chart on Comparison by Deployment
Data Table on Comparison by Deployment

10.3 Cloud based - Market size and forecast 2025-2030

Chart on Cloud based - Market size and forecast 2025-2030 ($ million)
Data Table on Cloud based - Market size and forecast 2025-2030 ($ million)
Chart on Cloud based - Year-over-year growth 2025-2030 (%)
Data Table on Cloud based - Year-over-year growth 2025-2030 (%)

10.4 On premises - Market size and forecast 2025-2030

Chart on On premises - Market size and forecast 2025-2030 ($ million)
Data Table on On premises - Market size and forecast 2025-2030 ($ million)
Chart on On premises - Year-over-year growth 2025-2030 (%)
Data Table on On premises - Year-over-year growth 2025-2030 (%)

10.5 Market opportunity by Deployment

Market opportunity by Deployment ($ million)
Data Table on Market opportunity by Deployment ($ million)

11. Customer Landscape

11.1 Customer landscape overview

Analysis of price sensitivity, lifecycle, customer purchase basket, adoption rates, and purchase criteria

12. Geographic Landscape

12.1 Geographic segmentation

Chart on Market share by geography 2025-2030 (%)
Data Table on Market share by geography 2025-2030 (%)

12.2 Geographic comparison

Chart on Geographic comparison
Data Table on Geographic comparison

12.3 North America - Market size and forecast 2025-2030

Chart on North America - Market size and forecast 2025-2030 ($ million)
Data Table on North America - Market size and forecast 2025-2030 ($ million)
Chart on North America - Year-over-year growth 2025-2030 (%)
Data Table on North America - Year-over-year growth 2025-2030 (%)
Chart on Regional Comparison - North America
Data Table on Regional Comparison - North America

12.3.1 US - Market size and forecast 2025-2030

Chart on US - Market size and forecast 2025-2030 ($ million)
Data Table on US - Market size and forecast 2025-2030 ($ million)
Chart on US - Year-over-year growth 2025-2030 (%)
Data Table on US - Year-over-year growth 2025-2030 (%)

12.3.2 Canada - Market size and forecast 2025-2030

Chart on Canada - Market size and forecast 2025-2030 ($ million)
Data Table on Canada - Market size and forecast 2025-2030 ($ million)
Chart on Canada - Year-over-year growth 2025-2030 (%)
Data Table on Canada - Year-over-year growth 2025-2030 (%)

12.3.3 Mexico - Market size and forecast 2025-2030

Chart on Mexico - Market size and forecast 2025-2030 ($ million)
Data Table on Mexico - Market size and forecast 2025-2030 ($ million)
Chart on Mexico - Year-over-year growth 2025-2030 (%)
Data Table on Mexico - Year-over-year growth 2025-2030 (%)

12.4 Europe - Market size and forecast 2025-2030

Chart on Europe - Market size and forecast 2025-2030 ($ million)
Data Table on Europe - Market size and forecast 2025-2030 ($ million)
Chart on Europe - Year-over-year growth 2025-2030 (%)
Data Table on Europe - Year-over-year growth 2025-2030 (%)
Chart on Regional Comparison - Europe
Data Table on Regional Comparison - Europe

12.4.1 Germany - Market size and forecast 2025-2030

Chart on Germany - Market size and forecast 2025-2030 ($ million)
Data Table on Germany - Market size and forecast 2025-2030 ($ million)
Chart on Germany - Year-over-year growth 2025-2030 (%)
Data Table on Germany - Year-over-year growth 2025-2030 (%)

12.4.2 UK - Market size and forecast 2025-2030

Chart on UK - Market size and forecast 2025-2030 ($ million)
Data Table on UK - Market size and forecast 2025-2030 ($ million)
Chart on UK - Year-over-year growth 2025-2030 (%)
Data Table on UK - Year-over-year growth 2025-2030 (%)

12.4.3 France - Market size and forecast 2025-2030

Chart on France - Market size and forecast 2025-2030 ($ million)
Data Table on France - Market size and forecast 2025-2030 ($ million)
Chart on France - Year-over-year growth 2025-2030 (%)
Data Table on France - Year-over-year growth 2025-2030 (%)

12.4.4 Italy - Market size and forecast 2025-2030

Chart on Italy - Market size and forecast 2025-2030 ($ million)
Data Table on Italy - Market size and forecast 2025-2030 ($ million)
Chart on Italy - Year-over-year growth 2025-2030 (%)
Data Table on Italy - Year-over-year growth 2025-2030 (%)

12.4.5 The Netherlands - Market size and forecast 2025-2030

Chart on The Netherlands - Market size and forecast 2025-2030 ($ million)
Data Table on The Netherlands - Market size and forecast 2025-2030 ($ million)
Chart on The Netherlands - Year-over-year growth 2025-2030 (%)
Data Table on The Netherlands - Year-over-year growth 2025-2030 (%)

12.4.6 Spain - Market size and forecast 2025-2030

Chart on Spain - Market size and forecast 2025-2030 ($ million)
Data Table on Spain - Market size and forecast 2025-2030 ($ million)
Chart on Spain - Year-over-year growth 2025-2030 (%)
Data Table on Spain - Year-over-year growth 2025-2030 (%)

12.5 APAC - Market size and forecast 2025-2030

Chart on APAC - Market size and forecast 2025-2030 ($ million)
Data Table on APAC - Market size and forecast 2025-2030 ($ million)
Chart on APAC - Year-over-year growth 2025-2030 (%)
Data Table on APAC - Year-over-year growth 2025-2030 (%)
Chart on Regional Comparison - APAC
Data Table on Regional Comparison - APAC

12.5.1 China - Market size and forecast 2025-2030

Chart on China - Market size and forecast 2025-2030 ($ million)
Data Table on China - Market size and forecast 2025-2030 ($ million)
Chart on China - Year-over-year growth 2025-2030 (%)
Data Table on China - Year-over-year growth 2025-2030 (%)

12.5.2 Japan - Market size and forecast 2025-2030

Chart on Japan - Market size and forecast 2025-2030 ($ million)
Data Table on Japan - Market size and forecast 2025-2030 ($ million)
Chart on Japan - Year-over-year growth 2025-2030 (%)
Data Table on Japan - Year-over-year growth 2025-2030 (%)

12.5.3 India - Market size and forecast 2025-2030

Chart on India - Market size and forecast 2025-2030 ($ million)
Data Table on India - Market size and forecast 2025-2030 ($ million)
Chart on India - Year-over-year growth 2025-2030 (%)
Data Table on India - Year-over-year growth 2025-2030 (%)

12.5.4 South Korea - Market size and forecast 2025-2030

Chart on South Korea - Market size and forecast 2025-2030 ($ million)
Data Table on South Korea - Market size and forecast 2025-2030 ($ million)
Chart on South Korea - Year-over-year growth 2025-2030 (%)
Data Table on South Korea - Year-over-year growth 2025-2030 (%)

12.5.5 Australia - Market size and forecast 2025-2030

Chart on Australia - Market size and forecast 2025-2030 ($ million)
Data Table on Australia - Market size and forecast 2025-2030 ($ million)
Chart on Australia - Year-over-year growth 2025-2030 (%)
Data Table on Australia - Year-over-year growth 2025-2030 (%)

12.5.6 Indonesia - Market size and forecast 2025-2030

Chart on Indonesia - Market size and forecast 2025-2030 ($ million)
Data Table on Indonesia - Market size and forecast 2025-2030 ($ million)
Chart on Indonesia - Year-over-year growth 2025-2030 (%)
Data Table on Indonesia - Year-over-year growth 2025-2030 (%)

12.6 South America - Market size and forecast 2025-2030

Chart on South America - Market size and forecast 2025-2030 ($ million)
Data Table on South America - Market size and forecast 2025-2030 ($ million)
Chart on South America - Year-over-year growth 2025-2030 (%)
Data Table on South America - Year-over-year growth 2025-2030 (%)
Chart on Regional Comparison - South America
Data Table on Regional Comparison - South America

12.6.1 Brazil - Market size and forecast 2025-2030

Chart on Brazil - Market size and forecast 2025-2030 ($ million)
Data Table on Brazil - Market size and forecast 2025-2030 ($ million)
Chart on Brazil - Year-over-year growth 2025-2030 (%)
Data Table on Brazil - Year-over-year growth 2025-2030 (%)

12.6.2 Argentina - Market size and forecast 2025-2030

Chart on Argentina - Market size and forecast 2025-2030 ($ million)
Data Table on Argentina - Market size and forecast 2025-2030 ($ million)
Chart on Argentina - Year-over-year growth 2025-2030 (%)
Data Table on Argentina - Year-over-year growth 2025-2030 (%)

12.6.3 Colombia - Market size and forecast 2025-2030

Chart on Colombia - Market size and forecast 2025-2030 ($ million)
Data Table on Colombia - Market size and forecast 2025-2030 ($ million)
Chart on Colombia - Year-over-year growth 2025-2030 (%)
Data Table on Colombia - Year-over-year growth 2025-2030 (%)

12.7 Middle East and Africa - Market size and forecast 2025-2030

Chart on Middle East and Africa - Market size and forecast 2025-2030 ($ million)
Data Table on Middle East and Africa - Market size and forecast 2025-2030 ($ million)
Chart on Middle East and Africa - Year-over-year growth 2025-2030 (%)
Data Table on Middle East and Africa - Year-over-year growth 2025-2030 (%)
Chart on Regional Comparison - Middle East and Africa
Data Table on Regional Comparison - Middle East and Africa

12.7.1 Saudi Arabia - Market size and forecast 2025-2030

Chart on Saudi Arabia - Market size and forecast 2025-2030 ($ million)
Data Table on Saudi Arabia - Market size and forecast 2025-2030 ($ million)
Chart on Saudi Arabia - Year-over-year growth 2025-2030 (%)
Data Table on Saudi Arabia - Year-over-year growth 2025-2030 (%)

12.7.2 UAE - Market size and forecast 2025-2030

Chart on UAE - Market size and forecast 2025-2030 ($ million)
Data Table on UAE - Market size and forecast 2025-2030 ($ million)
Chart on UAE - Year-over-year growth 2025-2030 (%)
Data Table on UAE - Year-over-year growth 2025-2030 (%)

12.7.3 South Africa - Market size and forecast 2025-2030

Chart on South Africa - Market size and forecast 2025-2030 ($ million)
Data Table on South Africa - Market size and forecast 2025-2030 ($ million)
Chart on South Africa - Year-over-year growth 2025-2030 (%)
Data Table on South Africa - Year-over-year growth 2025-2030 (%)

12.7.4 Israel - Market size and forecast 2025-2030

Chart on Israel - Market size and forecast 2025-2030 ($ million)
Data Table on Israel - Market size and forecast 2025-2030 ($ million)
Chart on Israel - Year-over-year growth 2025-2030 (%)
Data Table on Israel - Year-over-year growth 2025-2030 (%)

12.7.5 Turkey - Market size and forecast 2025-2030

Chart on Turkey - Market size and forecast 2025-2030 ($ million)
Data Table on Turkey - Market size and forecast 2025-2030 ($ million)
Chart on Turkey - Year-over-year growth 2025-2030 (%)
Data Table on Turkey - Year-over-year growth 2025-2030 (%)

12.8 Market opportunity by geography

Market opportunity by geography ($ million)
Data Tables on Market opportunity by geography ($ million)

13. Drivers, Challenges, and Opportunity

13.1 Market drivers

Convergence of advanced technologies and enhanced data integration
Dual imperatives of global food security and environmental sustainability
Proactive government policies and strategic public investment

13.2 Market challenges

High implementation costs and uncertain return on investment
Data fragmentation and lack of interoperability
Persistent digital divide and agricultural skills gap

13.3 Impact of drivers and challenges

Impact of drivers and challenges in 2025 and 2030

13.4 Market opportunities

Evolution from descriptive to predictive and prescriptive analytics
Mainstreaming of data driven sustainability and supply chain traceability
Platform consolidation and drive for interoperability

14. Competitive Landscape

14.1 Overview

14.2

Overview on criticality of inputs and factors of differentiation

14.3 Landscape disruption

Overview on factors of disruption

14.4 Industry risks

Impact of key risks on business

15. Competitive Analysis

15.1 Companies profiled

Companies covered

15.2 Company ranking index

15.3 Market positioning of companies

Matrix on companies position and classification

15.4 A.A.A Taranis Visual Ltd.

A.A.A Taranis Visual Ltd. - Overview
A.A.A Taranis Visual Ltd. - Product / Service
A.A.A Taranis Visual Ltd. - Key offerings
SWOT

15.5 Accenture PLC

Accenture PLC - Overview
Accenture PLC - Business segments
Accenture PLC - Key news
Accenture PLC - Key offerings
Accenture PLC - Segment focus
SWOT

15.6 AGCO Corp.

AGCO Corp. - Overview
AGCO Corp. - Business segments
AGCO Corp. - Key news
AGCO Corp. - Key offerings
AGCO Corp. - Segment focus
SWOT

15.7 Bayer AG

Bayer AG - Overview
Bayer AG - Business segments
Bayer AG - Key news
Bayer AG - Key offerings
Bayer AG - Segment focus
SWOT

15.8 Corteva Inc.

Corteva Inc. - Overview
Corteva Inc. - Business segments
Corteva Inc. - Key news
Corteva Inc. - Key offerings
Corteva Inc. - Segment focus
SWOT

15.9 Deere and Co.

Deere and Co. - Overview
Deere and Co. - Business segments
Deere and Co. - Key news
Deere and Co. - Key offerings
Deere and Co. - Segment focus
SWOT

15.10 Farmers Edge Inc.

Farmers Edge Inc. - Overview
Farmers Edge Inc. - Product / Service
Farmers Edge Inc. - Key offerings
SWOT

15.11 IBM Corp.

IBM Corp. - Overview
IBM Corp. - Business segments
IBM Corp. - Key news
IBM Corp. - Key offerings
IBM Corp. - Segment focus
SWOT

15.12 Microsoft Corp.

Microsoft Corp. - Overview
Microsoft Corp. - Business segments
Microsoft Corp. - Key news
Microsoft Corp. - Key offerings
Microsoft Corp. - Segment focus
SWOT

15.13 Oracle Corp.

Oracle Corp. - Overview
Oracle Corp. - Business segments
Oracle Corp. - Key news
Oracle Corp. - Key offerings
Oracle Corp. - Segment focus
SWOT

15.14 SAP SE

SAP SE - Overview
SAP SE - Business segments
SAP SE - Key news
SAP SE - Key offerings
SAP SE - Segment focus
SWOT

15.15 Trimble Inc.

Trimble Inc. - Overview
Trimble Inc. - Business segments
Trimble Inc. - Key news
Trimble Inc. - Key offerings
Trimble Inc. - Segment focus
SWOT

15.16 Vistex Inc.

Vistex Inc. - Overview
Vistex Inc. - Product / Service
Vistex Inc. - Key offerings
SWOT

15.17 Wipro Ltd.

Wipro Ltd. - Overview
Wipro Ltd. - Business segments
Wipro Ltd. - Key news
Wipro Ltd. - Key offerings
Wipro Ltd. - Segment focus
SWOT

15.18 Xylem Inc.

Xylem Inc. - Overview
Xylem Inc. - Business segments
Xylem Inc. - Key news
Xylem Inc. - Key offerings
Xylem Inc. - Segment focus
SWOT

16. Appendix

16.1 Scope of the report

Market definition
Objectives
Notes and caveats

16.2 Inclusions and exclusions checklist

Inclusions checklist
Exclusions checklist

16.3 Currency conversion rates for US$

16.4 Research methodology

16.5 Data procurement

Information sources

16.6 Data validation

16.7 Validation techniques employed for market sizing

16.8 Data synthesis

16.9 360 degree market analysis

16.10 List of abbreviations

Research Methodology

Technavio presents a detailed picture of the market by way of study, synthesis, and summation of data from multiple sources. The analysts have presented the various facets of the market with a particular focus on identifying the key industry influencers. The data thus presented is comprehensive, reliable, and the result of extensive research, both primary and secondary.

INFORMATION SOURCES

Primary sources

  • Manufacturers and suppliers
  • Channel partners
  • Industry experts
  • Strategic decision makers

Secondary sources

  • Industry journals and periodicals
  • Government data
  • Financial reports of key industry players
  • Historical data
  • Press releases

DATA ANALYSIS

Data Synthesis

  • Collation of data
  • Estimation of key figures
  • Analysis of derived insights

Data Validation

  • Triangulation with data models
  • Reference against proprietary databases
  • Corroboration with industry experts

REPORT WRITING

Qualitative

  • Market drivers
  • Market challenges
  • Market trends
  • Five forces analysis

Quantitative

  • Market size and forecast
  • Market segmentation
  • Geographical insights
  • Competitive landscape

Interested in this report?

Get your sample now to see our research methodology and insights!

Download Now

Frequently Asked Questions

Agriculture Analytics market growth will increase by USD 1651.7 million during 2026-2030.

The Agriculture Analytics market is expected to grow at a CAGR of 13.6% during 2026-2030.

Agriculture Analytics market is segmented by Type (Solutions, Services) Application (Precision farming, Livestock farming, Aquaculture farming, Vertical farming, Others) Deployment (Cloud based, On premises)

A.A.A Taranis Visual Ltd., Accenture PLC, AGCO Corp., Agribotix, Bayer AG, Conservis Corp., Corteva Inc., Cropin Technology, Deere and Co., Farmers Edge Inc., IBM Corp., Iteris Inc., Microsoft Corp., Oracle Corp., PrecisionHawk Inc., SAP SE, Trimble Inc., Vistex Inc., Wipro Ltd., Xylem Inc. are a few of the key vendors in the Agriculture Analytics market.

North America will register the highest growth rate of 43.4% among the other regions. Therefore, the Agriculture Analytics market in North America is expected to garner significant business opportunities for the vendors during the forecast period.

US, Canada, Mexico, Germany, UK, France, Italy, The Netherlands, Spain, China, Japan, India, South Korea, Australia, Indonesia, Brazil, Argentina, Colombia, Saudi Arabia, UAE, South Africa, Israel, Turkey

  • Convergence of advanced technologies and enhanced data integration is the driving factor this market.

The Agriculture Analytics market vendors should focus on grabbing business opportunities from the Type segment as it accounted for the largest market share in the base year.