Agriculture Sensing And Monitoring Devices Market Analysis, Size, and Forecast 2026-2030: North America (US, Canada, and Mexico), Europe (Germany, UK, and France), APAC (China, Japan, and India), South America (Brazil, Argentina, and Colombia), Middle East and Africa (Saudi Arabia, UAE, and South Africa), and Rest of World (ROW)

Agriculture Sensing And Monitoring Devices Market Analysis, Size, and Forecast 2026-2030:
North America (US, Canada, and Mexico), Europe (Germany, UK, and France), APAC (China, Japan, and India), South America (Brazil, Argentina, and Colombia), Middle East and Africa (Saudi Arabia, UAE, and South Africa), and Rest of World (ROW)

Published: Dec 2025 305 Pages SKU: IRTNTR80114

Market Overview at a Glance

$748 Mn
Market Opportunity
8.6%
CAGR 2025 - 2030
36%
North America Growth
$713.6 Mn
Crop sensing and monitoring segment 2024

Agriculture Sensing And Monitoring Devices Market Size 2026-2030

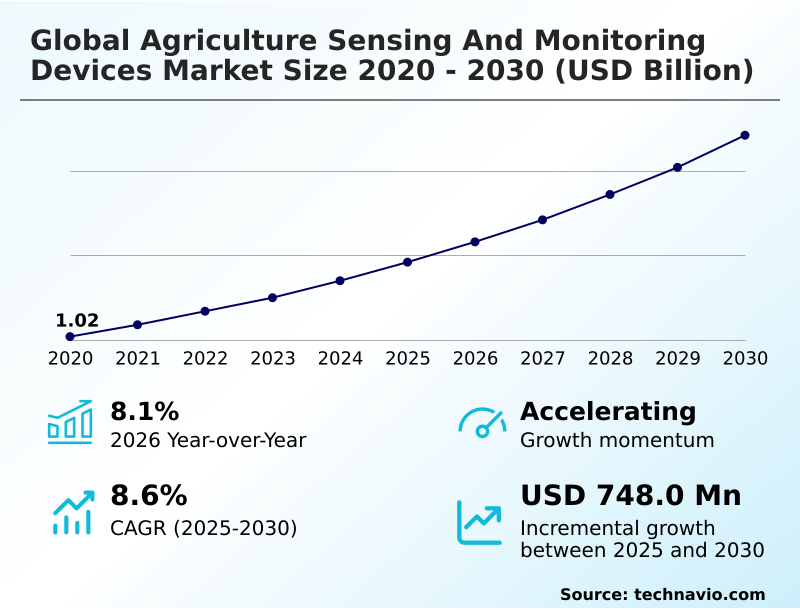
The agriculture sensing and monitoring devices market size is valued to increase by USD 748 million, at a CAGR of 8.6% from 2025 to 2030. Imperative for enhanced food security and agricultural productivity will drive the agriculture sensing and monitoring devices market.

Major Market Trends & Insights

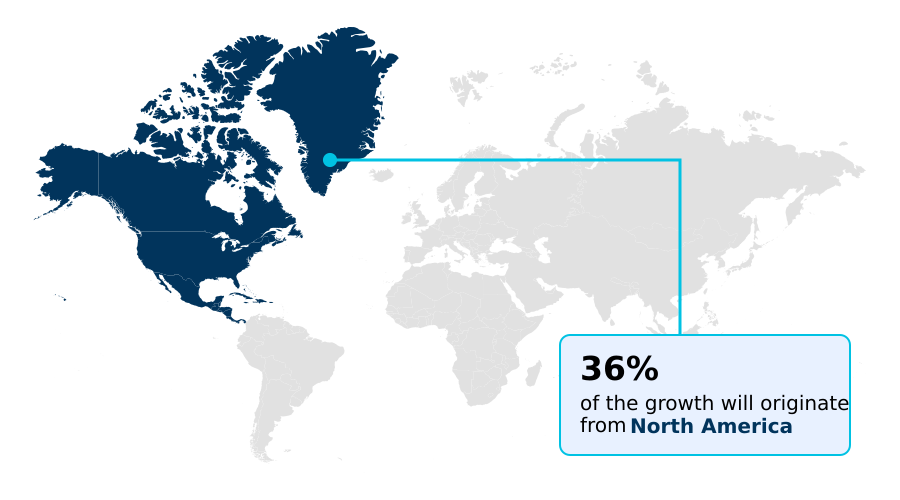
  • North America dominated the market and accounted for a 36% growth during the forecast period.
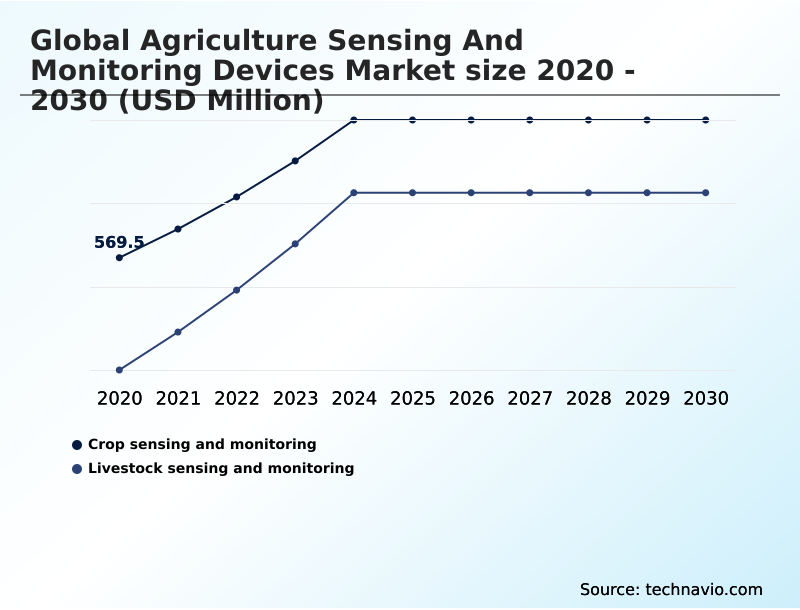
  • By Application - Crop sensing and monitoring segment was valued at USD 713.6 million in 2024
  • By End-user - Farmers segment accounted for the largest market revenue share in 2024

Market Size & Forecast

  • Market Opportunities: USD 1.19 billion
  • Market Future Opportunities: USD 748 million
  • CAGR from 2025 to 2030 : 8.6%

Market Summary

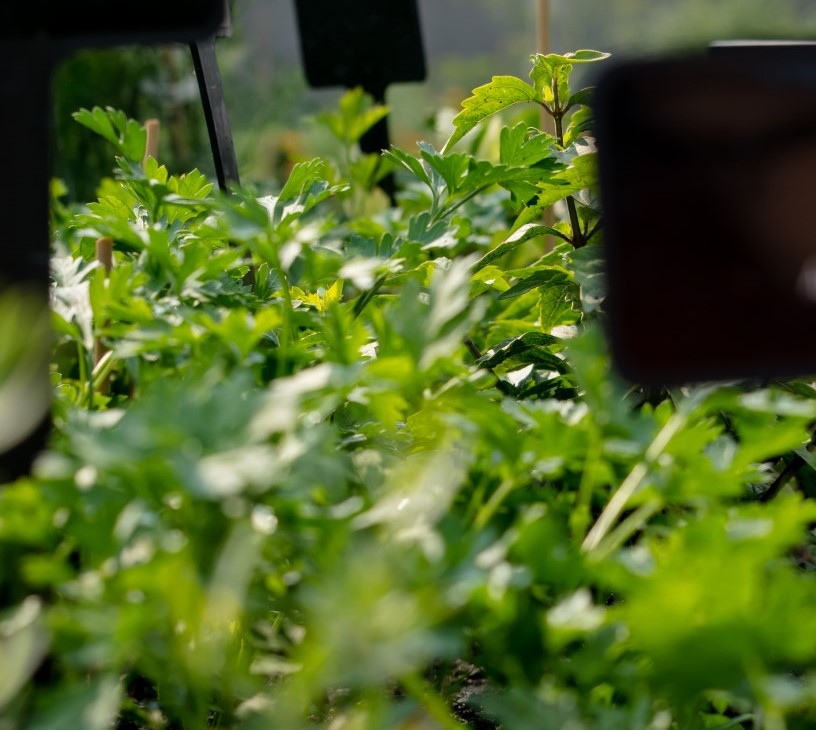
  • The agriculture sensing and monitoring devices market is undergoing a significant transformation, moving from traditional farming to data-driven precision agriculture. This shift is driven by the urgent need for more efficient, sustainable, and resilient food production systems to meet the demands of a growing global population amid finite natural resources.
  • The core of this market lies in providing farmers with precise, actionable insights through a range of instruments, including soil sensors for nutrient levels, weather stations for climate data, and advanced imaging systems on drones or satellites. By leveraging the Internet of Things (IoT), these tools form an interconnected ecosystem that enables real-time decision-making.
  • For instance, a large-scale commercial farm can use an integrated platform to analyze soil moisture data from across thousands of acres, automatically adjusting irrigation schedules to conserve water while ensuring optimal crop hydration. This not only reduces operational costs and minimizes environmental impact but also enhances crop yield and quality.
  • While challenges such as high initial investment and rural connectivity gaps exist, the compelling return on investment from optimized resource management continues to fuel market expansion and innovation, making these devices essential for modern agriculture.

What will be the Size of the Agriculture Sensing And Monitoring Devices Market during the forecast period?

Get Key Insights on Market Forecast (PDF) Request Free Sample

How is the Agriculture Sensing And Monitoring Devices Market Segmented?

The agriculture sensing and monitoring devices industry research report provides comprehensive data (region-wise segment analysis), with forecasts and estimates in "USD million" for the period 2026-2030, as well as historical data from 2020-2024 for the following segments.

  • Application
    • Crop sensing and monitoring
    • Livestock sensing and monitoring
  • End-user
    • Farmers
    • Agricultural companies
    • Government and research
  • Product
    • Soil sensors
    • Water sensors
    • Climate sensors
    • Others
  • Geography
    • North America
      • US
      • Canada
      • Mexico
    • Europe
      • Germany
      • UK
      • France
    • APAC
      • China
      • Japan
      • India
    • South America
      • Brazil
      • Argentina
      • Colombia
    • Middle East and Africa
      • Saudi Arabia
      • UAE
      • South Africa
    • Rest of World (ROW)

By Application Insights

The crop sensing and monitoring segment is estimated to witness significant growth during the forecast period.

The crop sensing and monitoring segment is central to the agriculture sensing and monitoring devices market, driven by the need for advanced yield optimization tools. This area focuses on technologies that capture granular field data for farm efficiency improvement.

Key technologies include remote sensing drones equipped with hyperspectral imaging for advanced crop stress detection and analysis of metrics like the Normalized Difference Vegetation Index.

In-field sensor networks complement this by providing continuous data, while plant phenotyping sensors advance research capabilities.

The integration of computer vision for agriculture into precision spraying equipment is a significant development, allowing for a 20% reduction in chemical use by targeting specific areas.

These crop monitoring systems enable real-time crop analytics, supporting sustainable farming practices through precise, data-driven interventions.

Request Free Sample

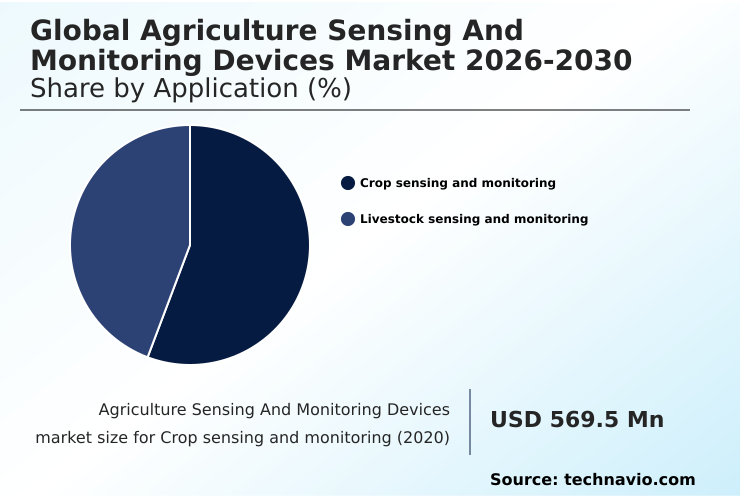
The Crop sensing and monitoring segment was valued at USD 713.6 million in 2024 and showed a gradual increase during the forecast period.

Request Free Sample

Regional Analysis

North America is estimated to contribute 36% to the growth of the global market during the forecast period.Technavio’s analysts have elaborately explained the regional trends and drivers that shape the market during the forecast period.

See How Agriculture Sensing And Monitoring Devices Market Demand is Rising in North America Request Free Sample

The market landscape shows distinct regional adoption patterns. North America, accounting for 36% of the incremental growth opportunity, leads in large-scale automated farm operations using advanced yield optimization tools.

Europe, driven by stringent regulations, focuses on precision viticulture and technologies for soil nutrient sensing. In Australia and South America, precision livestock farming is expanding, with livestock tracking technology and livestock activity monitoring being critical for managing vast rangelands.

The use of ingestible bolus sensors improves animal welfare technology by enabling early disease detection.

APAC, the fastest-growing region with a 9.6% CAGR, is rapidly adopting affordable soil moisture sensor technology and in-field sensor networks to enhance food security, which is reflected in its 26.8% contribution to market growth.

Market Dynamics

Our researchers analyzed the data with 2025 as the base year, along with the key drivers, trends, and challenges. A holistic analysis of drivers will help companies refine their marketing strategies to gain a competitive advantage.

  • Understanding the global agriculture sensing and monitoring devices market requires examining specific use cases and financial considerations. A key question for producers is the cost of soil moisture sensors for farms and the subsequent ROI of precision agriculture technology.
  • While government subsidies for precision agriculture equipment can offset initial expenses, the challenges of rural internet connectivity for agtech remain a significant hurdle.
  • The decision to invest in the best drone for crop scouting and analysis depends on its ability to provide actionable data, just as livestock monitoring systems for dairy cows are evaluated on their capacity for real-time disease detection in livestock.
  • The impact of 5G on smart farming promises to enhance capabilities, but producers must first learn how to integrate different farm data platforms and grapple with data privacy concerns in digital farming.
  • The benefits of variable rate fertilizer application are clear, yet their realization depends on accurate data from technologies like NIR sensors for crop quality analysis and improving sub-inch accuracy in GPS guidance. Comparing in-field sensors vs drone imagery reveals different strengths, while the role of telemetry in remote farm monitoring is crucial for both.
  • Ultimately, successful adoption hinges on implementing integrated farm management systems and leveraging AI-powered prescriptive analytics in agriculture to translate data into profit. Knowing how LiDAR technology works in agriculture and using satellite imagery to predict crop yield are becoming essential skills, with successful implementation showing more than a twofold increase in operational awareness compared to traditional methods.
  • Finally, automated irrigation systems for water conservation offer a clear path to resource efficiency.

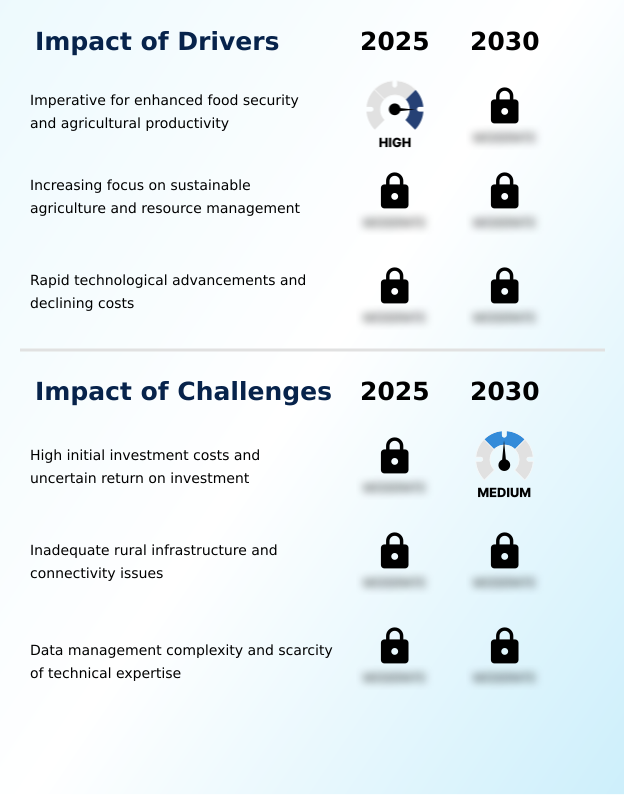
What are the key market drivers leading to the rise in the adoption of Agriculture Sensing And Monitoring Devices Industry?

  • The imperative to enhance agricultural productivity for global food security is a primary driver for the agriculture sensing and monitoring devices market.

  • The imperative for resource efficiency drives adoption of precision agriculture solutions, particularly in water management in agriculture.
  • Technologies like automated irrigation control, integrated with climate sensor integration through IoT in agriculture, have demonstrated water savings of over 30% in arid regions.
  • The use of GPS guidance systems to achieve sub-inch steering accuracy facilitates precision fertilization, reducing input waste. Simultaneously, yield monitoring systems provide crucial data for effective farm data management.
  • This agribusiness technology integration enables smart irrigation systems and variable rate technology, which together can boost input efficiency by 18%, making a compelling economic case for adoption.

What are the market trends shaping the Agriculture Sensing And Monitoring Devices Industry?

  • The integration of artificial intelligence and machine learning is a defining market trend. This evolution moves beyond basic data collection toward predictive and prescriptive analytics for enhanced decision-making.

  • A defining market trend is the integration of machine learning algorithms into smart farm platforms, enabling advanced AI in agricultural analytics. This shift toward data-driven agronomy transforms raw sensor data into actionable insights for predictive disease modeling, improving forecast accuracy by up to 25%.
  • Enhanced ag-tech interoperability is fostering a connected farm ecosystem, where digital agriculture platforms can create a digital twin for agriculture. The convergence of LiDAR scanning with robotic farming systems is accelerating the development of fully autonomous farming systems, which can increase operational uptime by 15%.
  • This wave of smart farming technology moves the industry from reactive monitoring to proactive, automated management.

What challenges does the Agriculture Sensing And Monitoring Devices Industry face during its growth?

  • High initial investment costs and uncertain return on investment represent a key challenge affecting industry growth and widespread adoption.

  • Significant challenges restrain market growth, particularly inadequate rural infrastructure for agricultural IoT devices. The lack of reliable LPWAN connectivity hinders the functionality of telemetry systems for remote farm monitoring, creating data transmission delays that can negate the benefits of real-time analytics. Integrating disparate data into cohesive farm management information systems also presents a major hurdle, complicating agronomic data analytics.
  • High initial costs for equipment like GNSS receivers with real-time kinematic capabilities affect agritech investment trends, with payback periods sometimes exceeding three years. Furthermore, a scarcity of skilled labor capable of managing complex environmental monitoring systems limits the effective deployment of regenerative agriculture technology.

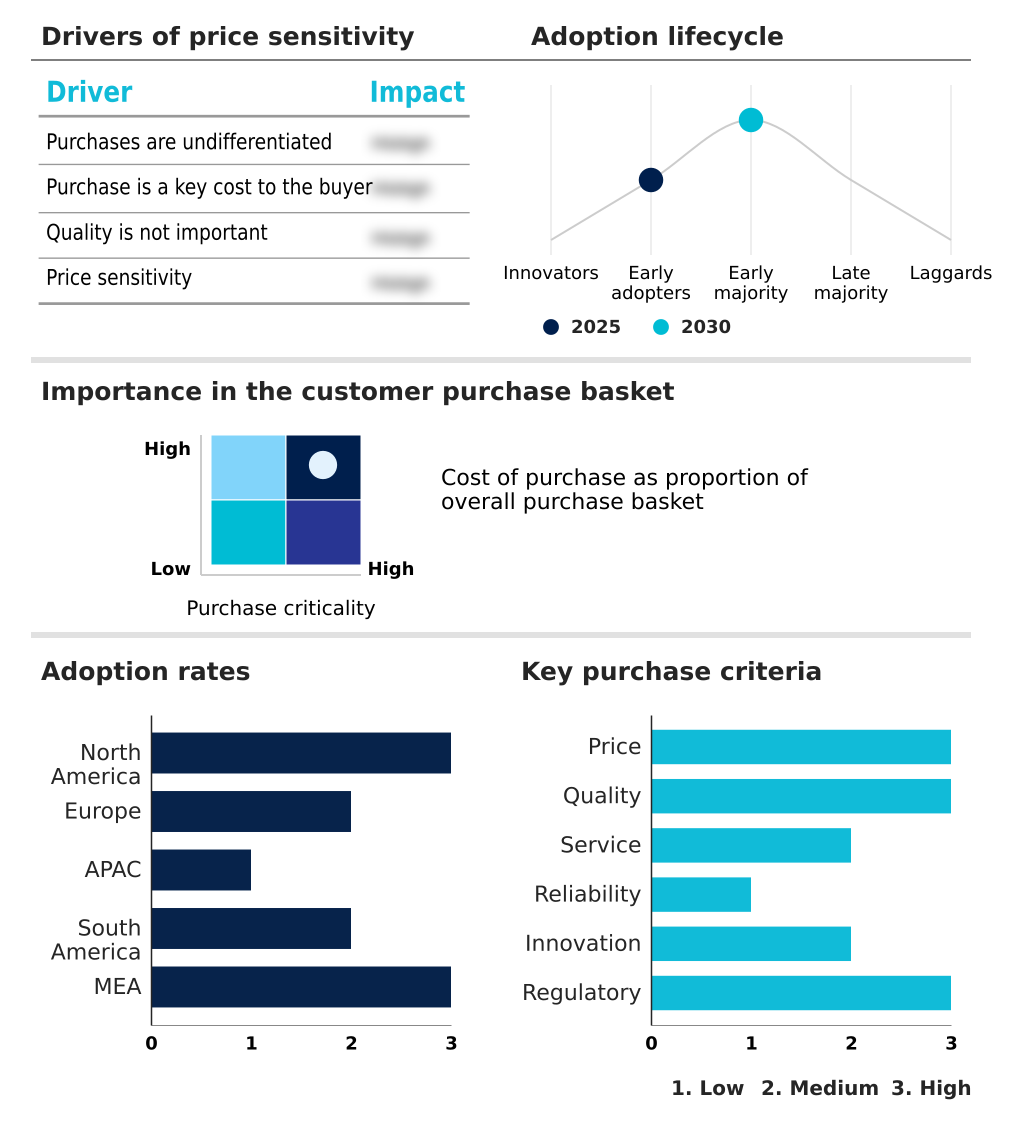
Exclusive Technavio Analysis on Customer Landscape

The agriculture sensing and monitoring devices market forecasting report includes the adoption lifecycle of the market, covering from the innovator’s stage to the laggard’s stage. It focuses on adoption rates in different regions based on penetration. Furthermore, the agriculture sensing and monitoring devices market report also includes key purchase criteria and drivers of price sensitivity to help companies evaluate and develop their market growth analysis strategies.

Customer Landscape of Agriculture Sensing And Monitoring Devices Industry

Competitive Landscape

Companies are implementing various strategies, such as strategic alliances, agriculture sensing and monitoring devices market forecast, partnerships, mergers and acquisitions, geographical expansion, and product/service launches, to enhance their presence in the industry.

AGCO Corp. - Provides an all-in-one IoT device combining weather, soil, and plant sensing with integrated imaging and machine learning-driven intelligence to deliver comprehensive crop insights.

The industry research and growth report includes detailed analyses of the competitive landscape of the market and information about key companies, including:

  • AGCO Corp.
  • Arable Labs Inc.
  • Auroras Srl
  • Bayer AG
  • CropX Technologies Ltd.
  • Deere and Co.
  • DICKEY john
  • DTN LLC
  • GroGuru Inc.
  • Hexagon AB
  • Murata Manufacturing Co. Ltd.
  • Parker Hannifin Corp.
  • Raven Industries Inc.
  • Sentera Inc.
  • Syngenta Crop Protection AG
  • Teralytic Inc.
  • Trimble Inc.

Qualitative and quantitative analysis of companies has been conducted to help clients understand the wider business environment as well as the strengths and weaknesses of key industry players. Data is qualitatively analyzed to categorize companies as pure play, category-focused, industry-focused, and diversified; it is quantitatively analyzed to categorize companies as dominant, leading, strong, tentative, and weak.

Recent Development and News in Agriculture sensing and monitoring devices market

  • In September 2024, Deere & Co. announced the acquisition of a leading AI-driven agronomy platform, integrating predictive analytics for pest outbreaks directly into its Operations Center in a deal valued at approximately $500 million.
  • In November 2024, CropX Technologies Ltd. launched its next-generation spiral soil sensor with enhanced capabilities to detect soil organic carbon levels in real-time, providing critical data for regenerative agriculture practices.
  • In February 2025, Raven Industries Inc. entered a strategic partnership with a major satellite imagery provider to fuse high-resolution satellite data with its autonomous steering systems, enabling sub-inch accuracy for in-season nitrogen application.
  • In April 2025, AGCO Corp. announced the establishment of a new smart farming R&D center in Brazil, backed by government incentives, to develop localized precision agriculture technologies for soybean and sugarcane cultivation.

Dive into Technavio’s robust research methodology, blending expert interviews, extensive data synthesis, and validated models for unparalleled Agriculture Sensing And Monitoring Devices Market insights. See full methodology.

Market Scope
Page number 305
Base year 2025
Historic period 2020-2024
Forecast period 2026-2030
Growth momentum & CAGR Accelerate at a CAGR of 8.6%
Market growth 2026-2030 USD 748.0 million
Market structure Fragmented
YoY growth 2025-2026(%) 8.1%
Key countries US, Canada, Mexico, Germany, UK, France, Italy, Spain, The Netherlands, China, Japan, India, South Korea, Australia, Indonesia, Brazil, Argentina, Colombia, Saudi Arabia, UAE, South Africa, Israel and Turkey
Competitive landscape Leading Companies, Market Positioning of Companies, Competitive Strategies, and Industry Risks

Request Free Sample

Research Analyst Overview

  • The agriculture sensing and monitoring devices market is fundamentally reshaping farm management through a sophisticated suite of technologies. At the core are in-field sensor networks, featuring devices like the soil moisture sensor, which provide foundational data for data-driven agronomy.
  • This is enhanced by remote sensing drones utilizing hyperspectral imaging and LiDAR scanning for advanced crop stress detection and analysis of metrics such as the Normalized Difference Vegetation Index and chlorophyll fluorescence. For animal agriculture, precision livestock farming leverages ingestible bolus sensors and livestock activity monitoring for health insights.
  • These hardware components, including advanced GNSS receivers that enable real-time kinematic positioning for sub-inch steering accuracy, feed into telemetry systems. The data is aggregated on smart farm platforms or farm management information systems, where machine learning algorithms perform agronomic data analytics. This integration is vital for predictive disease modeling and enabling variable rate technology via precision spraying equipment.
  • Critical technologies like NIR spectroscopy and computer vision for agriculture are being integrated into autonomous farming systems and yield monitoring systems, with a focus on improving ag-tech interoperability. The entire ecosystem, supported by LPWAN connectivity and climate sensor integration, is driving a shift toward automated irrigation control and other efficiencies, with some integrated systems reducing input waste by over 25%.

What are the Key Data Covered in this Agriculture Sensing And Monitoring Devices Market Research and Growth Report?

  • What is the expected growth of the Agriculture Sensing And Monitoring Devices Market between 2026 and 2030?

    • USD 748 million, at a CAGR of 8.6%

  • What segmentation does the market report cover?

    • The report is segmented by Application (Crop sensing and monitoring, and Livestock sensing and monitoring), End-user (Farmers, Agricultural companies, and Government and research), Product (Soil sensors, Water sensors, Climate sensors, and Others) and Geography (North America, Europe, APAC, South America, Middle East and Africa)

  • Which regions are analyzed in the report?

    • North America, Europe, APAC, South America and Middle East and Africa

  • What are the key growth drivers and market challenges?

    • Imperative for enhanced food security and agricultural productivity, High initial investment costs and uncertain return on investment

  • Who are the major players in the Agriculture Sensing And Monitoring Devices Market?

    • AGCO Corp., Arable Labs Inc., Auroras Srl, Bayer AG, CropX Technologies Ltd., Deere and Co., DICKEY john, DTN LLC, GroGuru Inc., Hexagon AB, Murata Manufacturing Co. Ltd., Parker Hannifin Corp., Raven Industries Inc., Sentera Inc., Syngenta Crop Protection AG, Teralytic Inc. and Trimble Inc.

Market Research Insights

  • The agriculture sensing and monitoring devices market is shaped by the push for farm efficiency improvement through smart farming technology and precision agriculture solutions.
  • The adoption of agricultural IoT devices for remote farm monitoring and automated farm operations is increasing, with deployments showing a reduction in water usage by up to 30% while improving yield consistency by 15% in certain crops. These technologies are central to sustainable farming practices and better water management in agriculture.
  • As agribusiness technology integration deepens, platforms for farm data management are becoming crucial for real-time crop analytics. The focus on yield optimization tools and smart irrigation systems highlights a market where the return on investment, which can be 2-3 times the initial outlay over five years, is a key adoption driver.

We can help! Our analysts can customize this agriculture sensing and monitoring devices market research report to meet your requirements.

Get in touch

1. Executive Summary

1.1 Market overview

Executive Summary - Chart on Market Overview
Executive Summary - Data Table on Market Overview
Executive Summary - Chart on Global Market Characteristics
Executive Summary - Chart on Market by Geography
Executive Summary - Chart on Market Segmentation by Application
Executive Summary - Chart on Market Segmentation by End-user
Executive Summary - Chart on Market Segmentation by Product
Executive Summary - Chart on Incremental Growth
Executive Summary - Data Table on Incremental Growth
Executive Summary - Chart on Company Market Positioning

2. Technavio Analysis

2.1 Analysis of price sensitivity, lifecycle, customer purchase basket, adoption rates, and purchase criteria

2.2 Criticality of inputs and Factors of differentiation

Chart on Overview on criticality of inputs and factors of differentiation

2.3 Factors of disruption

Chart on Overview on factors of disruption

2.4 Impact of drivers and challenges

Chart on Impact of drivers and challenges in 2025 and 2030

3. Market Landscape

3.1 Market ecosystem

Chart on Parent Market
Data Table on - Parent Market

3.2 Market characteristics

Chart on Market characteristics analysis

3.3 Value chain analysis

Chart on Value chain analysis

4. Market Sizing

4.1 Market definition

Data Table on Offerings of companies included in the market definition

4.2 Market segment analysis

Market segments

4.3 Market size 2025

4.4 Market outlook: Forecast for 2025-2030

Chart on Global - Market size and forecast 2025-2030 ($ million)
Data Table on Global - Market size and forecast 2025-2030 ($ million)
Chart on Global Market: Year-over-year growth 2025-2030 (%)
Data Table on Global Market: Year-over-year growth 2025-2030 (%)

5. Historic Market Size

5.1 Global Agriculture Sensing And Monitoring Devices Market 2020 - 2024

Historic Market Size - Data Table on Global Agriculture Sensing And Monitoring Devices Market 2020 - 2024 ($ million)

5.2 Application segment analysis 2020 - 2024

Historic Market Size - Application Segment 2020 - 2024 ($ million)

5.3 End-user segment analysis 2020 - 2024

Historic Market Size - End-user Segment 2020 - 2024 ($ million)

5.4 Product segment analysis 2020 - 2024

Historic Market Size - Product Segment 2020 - 2024 ($ million)

5.5 Geography segment analysis 2020 - 2024

Historic Market Size - Geography Segment 2020 - 2024 ($ million)

5.6 Country segment analysis 2020 - 2024

Historic Market Size - Country Segment 2020 - 2024 ($ million)

6. Qualitative Analysis

6.1 The AI impact on global agriculture sensing and monitoring devices market

7. Five Forces Analysis

7.1 Five forces summary

Five forces analysis - Comparison between 2025 and 2030

7.2 Bargaining power of buyers

Bargaining power of buyers - Impact of key factors 2025 and 2030

7.3 Bargaining power of suppliers

Bargaining power of suppliers - Impact of key factors in 2025 and 2030

7.4 Threat of new entrants

Threat of new entrants - Impact of key factors in 2025 and 2030

7.5 Threat of substitutes

Threat of substitutes - Impact of key factors in 2025 and 2030

7.6 Threat of rivalry

Threat of rivalry - Impact of key factors in 2025 and 2030

7.7 Market condition

Chart on Market condition - Five forces 2025 and 2030

8. Market Segmentation by Application

8.1 Market segments

Chart on Application - Market share 2025-2030 (%)
Data Table on Application - Market share 2025-2030 (%)

8.2 Comparison by Application

Chart on Comparison by Application
Data Table on Comparison by Application

8.3 Crop sensing and monitoring - Market size and forecast 2025-2030

Chart on Crop sensing and monitoring - Market size and forecast 2025-2030 ($ million)
Data Table on Crop sensing and monitoring - Market size and forecast 2025-2030 ($ million)
Chart on Crop sensing and monitoring - Year-over-year growth 2025-2030 (%)
Data Table on Crop sensing and monitoring - Year-over-year growth 2025-2030 (%)

8.4 Livestock sensing and monitoring - Market size and forecast 2025-2030

Chart on Livestock sensing and monitoring - Market size and forecast 2025-2030 ($ million)
Data Table on Livestock sensing and monitoring - Market size and forecast 2025-2030 ($ million)
Chart on Livestock sensing and monitoring - Year-over-year growth 2025-2030 (%)
Data Table on Livestock sensing and monitoring - Year-over-year growth 2025-2030 (%)

8.5 Market opportunity by Application

Market opportunity by Application ($ million)
Data Table on Market opportunity by Application ($ million)

9. Market Segmentation by End-user

9.1 Market segments

Chart on End-user - Market share 2025-2030 (%)
Data Table on End-user - Market share 2025-2030 (%)

9.2 Comparison by End-user

Chart on Comparison by End-user
Data Table on Comparison by End-user

9.3 Farmers - Market size and forecast 2025-2030

Chart on Farmers - Market size and forecast 2025-2030 ($ million)
Data Table on Farmers - Market size and forecast 2025-2030 ($ million)
Chart on Farmers - Year-over-year growth 2025-2030 (%)
Data Table on Farmers - Year-over-year growth 2025-2030 (%)

9.4 Agricultural companies - Market size and forecast 2025-2030

Chart on Agricultural companies - Market size and forecast 2025-2030 ($ million)
Data Table on Agricultural companies - Market size and forecast 2025-2030 ($ million)
Chart on Agricultural companies - Year-over-year growth 2025-2030 (%)
Data Table on Agricultural companies - Year-over-year growth 2025-2030 (%)

9.5 Government and research - Market size and forecast 2025-2030

Chart on Government and research - Market size and forecast 2025-2030 ($ million)
Data Table on Government and research - Market size and forecast 2025-2030 ($ million)
Chart on Government and research - Year-over-year growth 2025-2030 (%)
Data Table on Government and research - Year-over-year growth 2025-2030 (%)

9.6 Market opportunity by End-user

Market opportunity by End-user ($ million)
Data Table on Market opportunity by End-user ($ million)

10. Market Segmentation by Product

10.1 Market segments

Chart on Product - Market share 2025-2030 (%)
Data Table on Product - Market share 2025-2030 (%)

10.2 Comparison by Product

Chart on Comparison by Product
Data Table on Comparison by Product

10.3 Soil sensors - Market size and forecast 2025-2030

Chart on Soil sensors - Market size and forecast 2025-2030 ($ million)
Data Table on Soil sensors - Market size and forecast 2025-2030 ($ million)
Chart on Soil sensors - Year-over-year growth 2025-2030 (%)
Data Table on Soil sensors - Year-over-year growth 2025-2030 (%)

10.4 Water sensors - Market size and forecast 2025-2030

Chart on Water sensors - Market size and forecast 2025-2030 ($ million)
Data Table on Water sensors - Market size and forecast 2025-2030 ($ million)
Chart on Water sensors - Year-over-year growth 2025-2030 (%)
Data Table on Water sensors - Year-over-year growth 2025-2030 (%)

10.5 Climate sensors - Market size and forecast 2025-2030

Chart on Climate sensors - Market size and forecast 2025-2030 ($ million)
Data Table on Climate sensors - Market size and forecast 2025-2030 ($ million)
Chart on Climate sensors - Year-over-year growth 2025-2030 (%)
Data Table on Climate sensors - Year-over-year growth 2025-2030 (%)

10.6 Others - Market size and forecast 2025-2030

Chart on Others - Market size and forecast 2025-2030 ($ million)
Data Table on Others - Market size and forecast 2025-2030 ($ million)
Chart on Others - Year-over-year growth 2025-2030 (%)
Data Table on Others - Year-over-year growth 2025-2030 (%)

10.7 Market opportunity by Product

Market opportunity by Product ($ million)
Data Table on Market opportunity by Product ($ million)

11. Customer Landscape

11.1 Customer landscape overview

Analysis of price sensitivity, lifecycle, customer purchase basket, adoption rates, and purchase criteria

12. Geographic Landscape

12.1 Geographic segmentation

Chart on Market share by geography 2025-2030 (%)
Data Table on Market share by geography 2025-2030 (%)

12.2 Geographic comparison

Chart on Geographic comparison
Data Table on Geographic comparison

12.3 North America - Market size and forecast 2025-2030

Chart on North America - Market size and forecast 2025-2030 ($ million)
Data Table on North America - Market size and forecast 2025-2030 ($ million)
Chart on North America - Year-over-year growth 2025-2030 (%)
Data Table on North America - Year-over-year growth 2025-2030 (%)
Chart on Regional Comparison - North America
Data Table on Regional Comparison - North America

12.3.1 US - Market size and forecast 2025-2030

Chart on US - Market size and forecast 2025-2030 ($ million)
Data Table on US - Market size and forecast 2025-2030 ($ million)
Chart on US - Year-over-year growth 2025-2030 (%)
Data Table on US - Year-over-year growth 2025-2030 (%)

12.3.2 Canada - Market size and forecast 2025-2030

Chart on Canada - Market size and forecast 2025-2030 ($ million)
Data Table on Canada - Market size and forecast 2025-2030 ($ million)
Chart on Canada - Year-over-year growth 2025-2030 (%)
Data Table on Canada - Year-over-year growth 2025-2030 (%)

12.3.3 Mexico - Market size and forecast 2025-2030

Chart on Mexico - Market size and forecast 2025-2030 ($ million)
Data Table on Mexico - Market size and forecast 2025-2030 ($ million)
Chart on Mexico - Year-over-year growth 2025-2030 (%)
Data Table on Mexico - Year-over-year growth 2025-2030 (%)

12.4 Europe - Market size and forecast 2025-2030

Chart on Europe - Market size and forecast 2025-2030 ($ million)
Data Table on Europe - Market size and forecast 2025-2030 ($ million)
Chart on Europe - Year-over-year growth 2025-2030 (%)
Data Table on Europe - Year-over-year growth 2025-2030 (%)
Chart on Regional Comparison - Europe
Data Table on Regional Comparison - Europe

12.4.1 Germany - Market size and forecast 2025-2030

Chart on Germany - Market size and forecast 2025-2030 ($ million)
Data Table on Germany - Market size and forecast 2025-2030 ($ million)
Chart on Germany - Year-over-year growth 2025-2030 (%)
Data Table on Germany - Year-over-year growth 2025-2030 (%)

12.4.2 UK - Market size and forecast 2025-2030

Chart on UK - Market size and forecast 2025-2030 ($ million)
Data Table on UK - Market size and forecast 2025-2030 ($ million)
Chart on UK - Year-over-year growth 2025-2030 (%)
Data Table on UK - Year-over-year growth 2025-2030 (%)

12.4.3 France - Market size and forecast 2025-2030

Chart on France - Market size and forecast 2025-2030 ($ million)
Data Table on France - Market size and forecast 2025-2030 ($ million)
Chart on France - Year-over-year growth 2025-2030 (%)
Data Table on France - Year-over-year growth 2025-2030 (%)

12.4.4 Italy - Market size and forecast 2025-2030

Chart on Italy - Market size and forecast 2025-2030 ($ million)
Data Table on Italy - Market size and forecast 2025-2030 ($ million)
Chart on Italy - Year-over-year growth 2025-2030 (%)
Data Table on Italy - Year-over-year growth 2025-2030 (%)

12.4.5 Spain - Market size and forecast 2025-2030

Chart on Spain - Market size and forecast 2025-2030 ($ million)
Data Table on Spain - Market size and forecast 2025-2030 ($ million)
Chart on Spain - Year-over-year growth 2025-2030 (%)
Data Table on Spain - Year-over-year growth 2025-2030 (%)

12.4.6 The Netherlands - Market size and forecast 2025-2030

Chart on The Netherlands - Market size and forecast 2025-2030 ($ million)
Data Table on The Netherlands - Market size and forecast 2025-2030 ($ million)
Chart on The Netherlands - Year-over-year growth 2025-2030 (%)
Data Table on The Netherlands - Year-over-year growth 2025-2030 (%)

12.5 APAC - Market size and forecast 2025-2030

Chart on APAC - Market size and forecast 2025-2030 ($ million)
Data Table on APAC - Market size and forecast 2025-2030 ($ million)
Chart on APAC - Year-over-year growth 2025-2030 (%)
Data Table on APAC - Year-over-year growth 2025-2030 (%)
Chart on Regional Comparison - APAC
Data Table on Regional Comparison - APAC

12.5.1 China - Market size and forecast 2025-2030

Chart on China - Market size and forecast 2025-2030 ($ million)
Data Table on China - Market size and forecast 2025-2030 ($ million)
Chart on China - Year-over-year growth 2025-2030 (%)
Data Table on China - Year-over-year growth 2025-2030 (%)

12.5.2 Japan - Market size and forecast 2025-2030

Chart on Japan - Market size and forecast 2025-2030 ($ million)
Data Table on Japan - Market size and forecast 2025-2030 ($ million)
Chart on Japan - Year-over-year growth 2025-2030 (%)
Data Table on Japan - Year-over-year growth 2025-2030 (%)

12.5.3 India - Market size and forecast 2025-2030

Chart on India - Market size and forecast 2025-2030 ($ million)
Data Table on India - Market size and forecast 2025-2030 ($ million)
Chart on India - Year-over-year growth 2025-2030 (%)
Data Table on India - Year-over-year growth 2025-2030 (%)

12.5.4 South Korea - Market size and forecast 2025-2030

Chart on South Korea - Market size and forecast 2025-2030 ($ million)
Data Table on South Korea - Market size and forecast 2025-2030 ($ million)
Chart on South Korea - Year-over-year growth 2025-2030 (%)
Data Table on South Korea - Year-over-year growth 2025-2030 (%)

12.5.5 Australia - Market size and forecast 2025-2030

Chart on Australia - Market size and forecast 2025-2030 ($ million)
Data Table on Australia - Market size and forecast 2025-2030 ($ million)
Chart on Australia - Year-over-year growth 2025-2030 (%)
Data Table on Australia - Year-over-year growth 2025-2030 (%)

12.5.6 Indonesia - Market size and forecast 2025-2030

Chart on Indonesia - Market size and forecast 2025-2030 ($ million)
Data Table on Indonesia - Market size and forecast 2025-2030 ($ million)
Chart on Indonesia - Year-over-year growth 2025-2030 (%)
Data Table on Indonesia - Year-over-year growth 2025-2030 (%)

12.6 South America - Market size and forecast 2025-2030

Chart on South America - Market size and forecast 2025-2030 ($ million)
Data Table on South America - Market size and forecast 2025-2030 ($ million)
Chart on South America - Year-over-year growth 2025-2030 (%)
Data Table on South America - Year-over-year growth 2025-2030 (%)
Chart on Regional Comparison - South America
Data Table on Regional Comparison - South America

12.6.1 Brazil - Market size and forecast 2025-2030

Chart on Brazil - Market size and forecast 2025-2030 ($ million)
Data Table on Brazil - Market size and forecast 2025-2030 ($ million)
Chart on Brazil - Year-over-year growth 2025-2030 (%)
Data Table on Brazil - Year-over-year growth 2025-2030 (%)

12.6.2 Argentina - Market size and forecast 2025-2030

Chart on Argentina - Market size and forecast 2025-2030 ($ million)
Data Table on Argentina - Market size and forecast 2025-2030 ($ million)
Chart on Argentina - Year-over-year growth 2025-2030 (%)
Data Table on Argentina - Year-over-year growth 2025-2030 (%)

12.6.3 Colombia - Market size and forecast 2025-2030

Chart on Colombia - Market size and forecast 2025-2030 ($ million)
Data Table on Colombia - Market size and forecast 2025-2030 ($ million)
Chart on Colombia - Year-over-year growth 2025-2030 (%)
Data Table on Colombia - Year-over-year growth 2025-2030 (%)

12.7 Middle East and Africa - Market size and forecast 2025-2030

Chart on Middle East and Africa - Market size and forecast 2025-2030 ($ million)
Data Table on Middle East and Africa - Market size and forecast 2025-2030 ($ million)
Chart on Middle East and Africa - Year-over-year growth 2025-2030 (%)
Data Table on Middle East and Africa - Year-over-year growth 2025-2030 (%)
Chart on Regional Comparison - Middle East and Africa
Data Table on Regional Comparison - Middle East and Africa

12.7.1 Saudi Arabia - Market size and forecast 2025-2030

Chart on Saudi Arabia - Market size and forecast 2025-2030 ($ million)
Data Table on Saudi Arabia - Market size and forecast 2025-2030 ($ million)
Chart on Saudi Arabia - Year-over-year growth 2025-2030 (%)
Data Table on Saudi Arabia - Year-over-year growth 2025-2030 (%)

12.7.2 UAE - Market size and forecast 2025-2030

Chart on UAE - Market size and forecast 2025-2030 ($ million)
Data Table on UAE - Market size and forecast 2025-2030 ($ million)
Chart on UAE - Year-over-year growth 2025-2030 (%)
Data Table on UAE - Year-over-year growth 2025-2030 (%)

12.7.3 South Africa - Market size and forecast 2025-2030

Chart on South Africa - Market size and forecast 2025-2030 ($ million)
Data Table on South Africa - Market size and forecast 2025-2030 ($ million)
Chart on South Africa - Year-over-year growth 2025-2030 (%)
Data Table on South Africa - Year-over-year growth 2025-2030 (%)

12.7.4 Israel - Market size and forecast 2025-2030

Chart on Israel - Market size and forecast 2025-2030 ($ million)
Data Table on Israel - Market size and forecast 2025-2030 ($ million)
Chart on Israel - Year-over-year growth 2025-2030 (%)
Data Table on Israel - Year-over-year growth 2025-2030 (%)

12.7.5 Turkey - Market size and forecast 2025-2030

Chart on Turkey - Market size and forecast 2025-2030 ($ million)
Data Table on Turkey - Market size and forecast 2025-2030 ($ million)
Chart on Turkey - Year-over-year growth 2025-2030 (%)
Data Table on Turkey - Year-over-year growth 2025-2030 (%)

12.8 Market opportunity by geography

Market opportunity by geography ($ million)
Data Tables on Market opportunity by geography ($ million)

13. Drivers, Challenges, and Opportunity

13.1 Market drivers

Imperative for enhanced food security and agricultural productivity
Increasing focus on sustainable agriculture and resource management
Rapid technological advancements and declining costs

13.2 Market challenges

High initial investment costs and uncertain return on investment
Inadequate rural infrastructure and connectivity issues
Data management complexity and scarcity of technical expertise

13.3 Impact of drivers and challenges

Impact of drivers and challenges in 2025 and 2030

13.4 Market opportunities

Integration of artificial intelligence and machine learning for predictive and prescriptive analytics
Proliferation and convergence of remote and in-field sensing technologies
Shift toward integrated farm management platforms and data ecosystems

14. Competitive Landscape

14.1 Overview

14.2

Overview on criticality of inputs and factors of differentiation

14.3 Landscape disruption

Overview on factors of disruption

14.4 Industry risks

Impact of key risks on business

15. Competitive Analysis

15.1 Companies profiled

Companies covered

15.2 Company ranking index

15.3 Market positioning of companies

Matrix on companies position and classification

15.4 AGCO Corp.

AGCO Corp. - Overview
AGCO Corp. - Business segments
AGCO Corp. - Key news
AGCO Corp. - Key offerings
AGCO Corp. - Segment focus
SWOT

15.5 Arable Labs Inc.

Arable Labs Inc. - Overview
Arable Labs Inc. - Product / Service
Arable Labs Inc. - Key offerings
SWOT

15.6 Bayer AG

Bayer AG - Overview
Bayer AG - Business segments
Bayer AG - Key news
Bayer AG - Key offerings
Bayer AG - Segment focus
SWOT

15.7 CropX Technologies Ltd.

CropX Technologies Ltd. - Overview
CropX Technologies Ltd. - Product / Service
CropX Technologies Ltd. - Key offerings
SWOT

15.8 Deere and Co.

Deere and Co. - Overview
Deere and Co. - Business segments
Deere and Co. - Key news
Deere and Co. - Key offerings
Deere and Co. - Segment focus
SWOT

15.9 DICKEY john

DICKEY john - Overview
DICKEY john - Product / Service
DICKEY john - Key offerings
SWOT

15.10 DTN LLC

DTN LLC - Overview
DTN LLC - Product / Service
DTN LLC - Key offerings
SWOT

15.11 GroGuru Inc.

GroGuru Inc. - Overview
GroGuru Inc. - Product / Service
GroGuru Inc. - Key offerings
SWOT

15.12 Hexagon AB

Hexagon AB - Overview
Hexagon AB - Business segments
Hexagon AB - Key news
Hexagon AB - Key offerings
Hexagon AB - Segment focus
SWOT

15.13 Murata Manufacturing Co. Ltd.

Murata Manufacturing Co. Ltd. - Overview
Murata Manufacturing Co. Ltd. - Business segments
Murata Manufacturing Co. Ltd. - Key news
Murata Manufacturing Co. Ltd. - Key offerings
Murata Manufacturing Co. Ltd. - Segment focus
SWOT

15.14 Parker Hannifin Corp.

Parker Hannifin Corp. - Overview
Parker Hannifin Corp. - Business segments
Parker Hannifin Corp. - Key offerings
Parker Hannifin Corp. - Segment focus
SWOT

15.15 Raven Industries Inc.

Raven Industries Inc. - Overview
Raven Industries Inc. - Product / Service
Raven Industries Inc. - Key offerings
SWOT

15.16 Sentera Inc.

Sentera Inc. - Overview
Sentera Inc. - Product / Service
Sentera Inc. - Key offerings
SWOT

15.17 Syngenta Crop Protection AG

Syngenta Crop Protection AG - Overview
Syngenta Crop Protection AG - Product / Service
Syngenta Crop Protection AG - Key offerings
SWOT

15.18 Trimble Inc.

Trimble Inc. - Overview
Trimble Inc. - Business segments
Trimble Inc. - Key news
Trimble Inc. - Key offerings
Trimble Inc. - Segment focus
SWOT

16. Appendix

16.1 Scope of the report

Market definition
Objectives
Notes and caveats

16.2 Inclusions and exclusions checklist

Inclusions checklist
Exclusions checklist

16.3 Currency conversion rates for US$

16.4 Research methodology

16.5 Data procurement

Information sources

16.6 Data validation

16.7 Validation techniques employed for market sizing

16.8 Data synthesis

16.9 360 degree market analysis

16.10 List of abbreviations

Research Methodology

Technavio presents a detailed picture of the market by way of study, synthesis, and summation of data from multiple sources. The analysts have presented the various facets of the market with a particular focus on identifying the key industry influencers. The data thus presented is comprehensive, reliable, and the result of extensive research, both primary and secondary.

INFORMATION SOURCES

Primary sources

  • Manufacturers and suppliers
  • Channel partners
  • Industry experts
  • Strategic decision makers

Secondary sources

  • Industry journals and periodicals
  • Government data
  • Financial reports of key industry players
  • Historical data
  • Press releases

DATA ANALYSIS

Data Synthesis

  • Collation of data
  • Estimation of key figures
  • Analysis of derived insights

Data Validation

  • Triangulation with data models
  • Reference against proprietary databases
  • Corroboration with industry experts

REPORT WRITING

Qualitative

  • Market drivers
  • Market challenges
  • Market trends
  • Five forces analysis

Quantitative

  • Market size and forecast
  • Market segmentation
  • Geographical insights
  • Competitive landscape

Interested in this report?

Get your sample now to see our research methodology and insights!

Download Now

Frequently Asked Questions

Agriculture Sensing And Monitoring Devices market growth will increase by USD 748.0 million during 2026-2030.

The Agriculture Sensing And Monitoring Devices market is expected to grow at a CAGR of 8.6% during 2026-2030.

Agriculture Sensing And Monitoring Devices market is segmented by Application (Crop sensing and monitoring, Livestock sensing and monitoring) End-user (Farmers, Agricultural companies, Government and research) Product (Soil sensors, Water sensors, Climate sensors, Others)

AGCO Corp., Arable Labs Inc., Auroras Srl, Bayer AG, CropX Technologies Ltd., Deere and Co., DICKEY john, DTN LLC, GroGuru Inc., Hexagon AB, Murata Manufacturing Co. Ltd., Parker Hannifin Corp., Raven Industries Inc., Sentera Inc., Syngenta Crop Protection AG, Teralytic Inc., Trimble Inc. are a few of the key vendors in the Agriculture Sensing And Monitoring Devices market.

North America will register the highest growth rate of 36% among the other regions. Therefore, the Agriculture Sensing And Monitoring Devices market in North America is expected to garner significant business opportunities for the vendors during the forecast period.

US, Canada, Mexico, Germany, UK, France, Italy, Spain, The Netherlands, China, Japan, India, South Korea, Australia, Indonesia, Brazil, Argentina, Colombia, Saudi Arabia, UAE, South Africa, Israel, Turkey

  • Imperative for enhanced food security and agricultural productivity is the driving factor this market.

The Agriculture Sensing And Monitoring Devices market vendors should focus on grabbing business opportunities from the Application segment as it accounted for the largest market share in the base year.