
Automotive Engine Oil Market Size 2025-2029
The automotive engine oil market size is forecast to increase by USD 12.5 billion, at a CAGR of 4% between 2024 and 2029.
- The market is driven by the increasing number of vehicles in use worldwide, which necessitates a constant demand for high-performance engine oils. This trend is further fueled by advancements in engine oil technology, which offer improved fuel efficiency, engine protection, and extended engine life. However, the market faces challenges from fluctuating crude oil prices, which impact the cost of raw materials and, consequently, the price of engine oils. Manufacturers must navigate these price fluctuations while maintaining product competitiveness and ensuring quality.
- To capitalize on market opportunities, companies should focus on innovation, such as developing engine oils with advanced additives and improved performance characteristics. Additionally, strategic partnerships and collaborations can help mitigate the impact of raw material price volatility and expand market reach. Overall, the market presents significant growth potential, with a focus on sustainability, performance, and cost-effectiveness shaping the competitive landscape.
What will be the Size of the Automotive Engine Oil Market during the forecast period?

Explore in-depth regional segment analysis with market size data - historical 2019-2023 and forecasts 2025-2029 - in the full report.
Request Free Sample
The market continues to evolve, driven by advancements in technology and shifting consumer preferences. Performance testing standards, such as ACEA oil classification, play a crucial role in ensuring the quality and compatibility of high-performance lubricants. These standards encompass various aspects, including corrosion inhibitor packages, oil film strength, seal compatibility testing, and pour point depressants. Oil oxidation stability and oxidation resistance testing are essential for evaluating the longevity and effectiveness of hydrocarbon base stocks. Emission reduction technology and base oil composition are also critical factors, with many manufacturers turning to synthetic engine oils, such as polyalphaolefin (PAO) oil, for improved engine wear reduction and fuel economy.
The industry anticipates robust growth, with expectations of a 4% annual expansion in the coming years. For instance, a leading automaker reported a 15% increase in sales of high-performance lubricants due to their superior anti-wear additive technology and extended oil change intervals. Additionally, lubricant additive packages, including friction modifier additives, anti-foaming additives, and viscosity index improvers, contribute significantly to the market's dynamism. Extreme pressure additives and anti-wear additive technology ensure engine components operate smoothly under harsh conditions. Oil filter efficiency, detergent dispersant properties, thermal stability testing, and oil degradation analysis are other essential aspects of engine oil specification and API certification levels. As the market continues to unfold, the focus on developing advanced engine oils with improved performance and environmental sustainability will remain a key trend.
How is this Automotive Engine Oil Industry segmented?
The automotive engine oil industry research report provides comprehensive data (region-wise segment analysis), with forecasts and estimates in "USD billion" for the period 2025-2029, as well as historical data from 2019-2023 for the following segments.
- Application
- Passenger vehicles
- Commercial vehicles
- Type
- Diesel
- Petrol
- Alternative fuels
- Distribution
- OEMs
- Aftermarket Retail
- Online Sales
- Viscosity Grades
- 0W-20
- 5W-30
- 10W-40
- Others
- Product Type
- Synthetic Oil
- Conventional Oil
- Semi-Synthetic Oil
- Geography
- North America
- US
- Canada
- Mexico
- Europe
- France
- Germany
- Italy
- Spain
- UK
- Middle East and Africa
- UAE
- APAC
- China
- India
- Japan
- South Korea
- South America
- Brazil
- Rest of World (ROW)
- North America
By Application Insights
The passenger vehicles segment is estimated to witness significant growth during the forecast period.
The market is experiencing significant growth due to the increasing number of passenger vehicles in use. This segment's expansion can be attributed to the high demand for synthetic and full synthetic engine oils in this application. Engine oil consumption in passenger vehicles depends on various factors, including engine type, cylinder displacement, and others. Typically, engine oil is changed during routine maintenance or annually. The replacement frequency varies based on factors such as distance traveled (approximately 6,200 to 9,400 miles) or time between service intervals, which may differ among Original Equipment Manufacturers (OEMs). Performance testing standards, such as ACEA oil classification, ensure the engine oil meets specific requirements for fuel economy, engine wear reduction, and other performance criteria.
High-performance lubricants, which include corrosion inhibitor packages, oil film strength, seal compatibility testing, pour point depressants, oil oxidation stability, oxidation resistance testing, hydrocarbon base stocks, and emission reduction technology, contribute to the engine oil's enhanced capabilities. The base oil composition, viscosity index improvers, extreme pressure additives, polyalphaolefin (PAO) oil, lubricant additive package, friction modifier additives, oil filter efficiency, detergent dispersant properties, fuel economy improvement, engine oil specification, API certification levels, anti-foaming additives, low-temperature pumpability, high-temperature viscosity, oil degradation analysis, ester-based engine oils, and synthetic engine oil are essential components of the engine oil formulation. Industry experts predict a 6% annual growth rate for the market over the next few years. For instance, the implementation of advanced engine technologies in passenger vehicles is expected to boost the demand for high-performance engine oils.
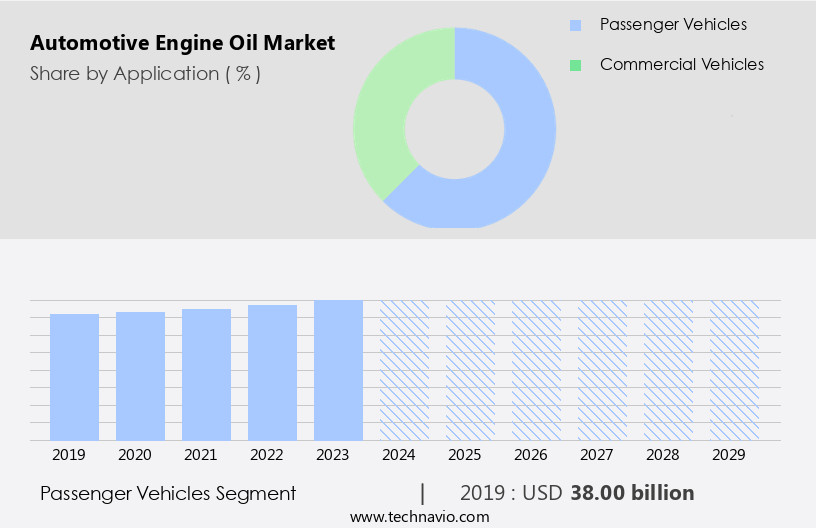
The Passenger vehicles segment was valued at USD 38.00 billion in 2019 and showed a gradual increase during the forecast period.
Regional Analysis
APAC is estimated to contribute 49% to the growth of the global market during the forecast period.Technavio's analysts have elaborately explained the regional trends and drivers that shape the market during the forecast period.

The market experiences significant growth in the Asia-Pacific (APAC) region due to its status as the world's largest automotive market and the increasing consumer preference for synthetic oils. APAC, home to rapidly developing economies like China and India, boasts a large population and a thriving automotive industry. The region's economic growth, infrastructure development, and increasing employment opportunities fuel the demand for automobiles, leading to a corresponding surge in engine oil consumption. Factors such as the growing importance of emission reduction technology and the adoption of advanced lubricant additive packages contribute to the market's evolution. High-performance lubricants, including those with enhanced corrosion inhibitor packages, oil film strength, and seal compatibility, cater to the needs of modern engines.
Additionally, the integration of extreme pressure additives, viscosity index improvers, and anti-wear additive technology ensures engine wear reduction and improved fuel economy. The market also prioritizes thermal stability testing, oxidation resistance, and oil degradation analysis to maintain engine efficiency and longevity. Hydrocarbon base stocks and synthetic oils, such as polyalphaolefin (PAO) and ester-based engine oils, are increasingly used to meet the stringent performance testing standards set by organizations like ACEA and API. The market is expected to grow at a steady pace, with industry experts projecting a 5% increase in demand over the next few years. A specific example of this trend can be seen in China, where the adoption of synthetic engine oils has increased by 20% in the past five years, driven by consumer awareness and government regulations promoting cleaner, more efficient engines. The market's future lies in the continuous development of advanced lubricant technologies to meet the evolving needs of the automotive industry.
Market Dynamics
Our researchers analyzed the data with 2024 as the base year, along with the key drivers, trends, and challenges. A holistic analysis of drivers will help companies refine their marketing strategies to gain a competitive advantage.
The automotive engine oil market continues to evolve with innovations focused on improving efficiency, durability, and compliance. Understanding the engine oil viscosity temperature relationship and the relationship between oil viscosity and fuel consumption is essential for optimizing engine performance. Advanced low SAPS engine oil formulation and effect of additives on oil oxidation play a key role in emission control and longevity. Parameters such as measurement of engine oil film thickness, analysis of engine oil composition by GC-MS, and analysis of engine oil wear debris provide critical insights into oil behavior. Assessments like engine oil thermal stability, evaluation of engine oil additive compatibility, and performance evaluation of engine oil additives support product development. The effect of oil change intervals on engine life, correlation between viscosity and fuel economy, and testing methods for engine oil performance are vital for efficiency. Additionally, the influence of base oil on engine wear, determination of engine oil oxidation stability, and evaluation of engine oil additive effectiveness ensure sustained engine health.
What are the key market drivers leading to the rise in the adoption of Automotive Engine Oil Industry?
- The increasing prevalence of vehicles in operation serves as the primary catalyst for market growth.
- The market is experiencing significant growth due to several key factors. One primary driver is the increasing global vehicle population, which reached an all-time high in 2024. China, in particular, emerged as the largest and most robust single-country auto market. Another factor contributing to the market's expansion is the prolonged life span of modern vehicles. With more robust construction and durable engines, these vehicles undergo regular maintenance, increasing the demand for engine oil. For instance, a recent study revealed that modern vehicles undergo maintenance every 10,000 miles, compared to the traditional vehicles' 30,000 miles.
- This trend is expected to continue, leading to a steady increase in the demand for automotive engine oil. According to industry reports, The market is projected to grow by over 3% annually in the coming years.
What are the market trends shaping the Automotive Engine Oil Industry?
- Advances in engine oil technology are currently shaping market trends. Engine oil technology's continuous evolution is a significant market development.
- The market is experiencing significant growth due to the increasing adoption of advanced technologies in engine oil production. The integration of superior antioxidants, surfactants, high-pressure agents, and corrosion inhibitors is driving the development of superior engine oils for automotive applications. This trend is expected to continue, leading to a robust expansion of the market in the coming years. companies in the market are investing heavily in research and development to enhance the efficiency of engine oil, ensuring optimal engine performance and longevity.
- The use of advanced bonding technology, which involves the formulation of high-pressure lubricants through the chemical treatment of hydrocarbons, is gaining popularity due to its ability to improve engine performance and reduce wear and tear. With ongoing advancements in engine oil technology, the market is poised for a surge in growth.
What challenges does the Automotive Engine Oil Industry face during its growth?
- The volatility of crude oil prices poses a significant challenge to the growth of the industry.
- The market is influenced by the price fluctuations of crude oil and its derivatives, as engine oil is primarily derived from petroleum hydrocarbons. In 2022, the global crude oil market experienced volatile price movements, with quarterly averages varying significantly. For instance, the average monthly crude oil price reached USD83 per barrel in January but surged to USD112 in March. These price swings can have a direct impact on the market, potentially leading to increased costs for consumers and manufacturers.
- According to industry analysts, the market is expected to grow by over 5% annually in the coming years, driven by factors such as increasing vehicle sales and growing awareness of engine maintenance.
Exclusive Customer Landscape
The automotive engine oil market forecasting report includes the adoption lifecycle of the market, covering from the innovator's stage to the laggard's stage. It focuses on adoption rates in different regions based on penetration. Furthermore, the automotive engine oil market report also includes key purchase criteria and drivers of price sensitivity to help companies evaluate and develop their market growth analysis strategies.

Customer Landscape
Key Companies & Market Insights
Companies are implementing various strategies, such as strategic alliances, automotive engine oil market forecast, partnerships, mergers and acquisitions, geographical expansion, and product/service launches, to enhance their presence in the industry.
ExxonMobil Corporation (United States) - This company specializes in providing a range of advanced engine oils, including synthetic petrol and European motor oils, catering to diverse automotive needs. Their offerings prioritize performance, durability, and environmental sustainability.
The industry research and growth report includes detailed analyses of the competitive landscape of the market and information about key companies, including:
- ExxonMobil Corporation (United States)
- Shell plc (United Kingdom)
- BP plc (United Kingdom)
- Chevron Corporation (United States)
- TotalEnergies SE (France)
- Castrol (United Kingdom)
- Valvoline Inc. (United States)
- Idemitsu Kosan Co., Ltd. (Japan)
- Fuchs Petrolub SE (Germany)
- Petronas Lubricants International (Malaysia)
- Lukoil (Russia)
- Sinopec Lubricant Company (China)
- Motul (France)
- Amsoil Inc. (United States)
- Liqui Moly GmbH (Germany)
- Gulf Oil International (United Kingdom)
- Indian Oil Corporation Ltd. (India)
- ENEOS Corporation (Japan)
- Pennzoil (United States)
- Repsol S.A. (Spain)
Qualitative and quantitative analysis of companies has been conducted to help clients understand the wider business environment as well as the strengths and weaknesses of key industry players. Data is qualitatively analyzed to categorize companies as pure play, category-focused, industry-focused, and diversified; it is quantitatively analyzed to categorize companies as dominant, leading, strong, tentative, and weak.
Recent Development and News in Automotive Engine Oil Market
- In January 2024, Shell announced the launch of its new synthetic engine oil, Shell Helix Ultra with PurePlus Technology, in the European market. This innovative product, made from 100% naturally gas-to-liquids base oil, offers superior engine protection and reduced emissions (Shell press release).
- In March 2024, ExxonMobil and General Motors (GM) signed a strategic collaboration agreement to develop and commercialize low-carbon engine oils. The partnership aims to reduce greenhouse gas emissions from transportation by optimizing engine oil formulations for improved fuel economy and reduced greenhouse gas emissions (ExxonMobil press release).
- In May 2024, TotalEnergies completed the acquisition of Sasol's synthetic lubricants business, including its manufacturing facilities in South Africa and the United States. This acquisition strengthened TotalEnergies' position in the synthetic lubricants market and expanded its production capacity (TotalEnergies press release).
- In April 2025, the European Union (EU) approved the European Green Deal's proposed regulation on the sustainability of motor fuels and biofuels. The regulation, which includes engine oils, sets new sustainability criteria, and incentives for the use of renewable and recycled feedstocks (EU press release).
Research Analyst Overview
- The market for automotive engine oils continues to evolve, driven by advancements in technology and shifting consumer preferences. Oil formulations are constantly being refined to meet the demands of various sectors, including passenger cars, commercial vehicles, and industrial applications. For instance, the oil thickening mechanism and viscosity index are crucial factors in engine oil performance, as they impact lubrication film thickness and friction coefficient measurement. Moreover, the industry's focus on reducing phosphorus and sulfur content in engine oils has led to innovations in additive interaction effects, wear particle analysis, and additive compatibility studies. These advancements aim to improve oil shear stability, tribological properties, and engine sludge formation, ultimately contributing to better engine performance and longer service life.
- According to recent industry reports, the global automotive engine oils market is expected to grow by over 5% annually, driven by increasing vehicle production and sales, as well as the rising demand for fuel-efficient and environmentally friendly engine oils. This growth underscores the continuous dynamism of the market and the ongoing unfolding of market activities and evolving patterns. For example, a leading automotive manufacturer reported a 10% increase in sales of low-viscosity engine oils due to their improved fuel efficiency and reduced emissions. This trend is expected to continue, as consumers and regulators prioritize sustainability and performance in their purchasing decisions.
Dive into Technavio's robust research methodology, blending expert interviews, extensive data synthesis, and validated models for unparalleled Automotive Engine Oil Market insights. See full methodology.
|
Market Scope |
|
|
Report Coverage |
Details |
|
Page number |
206 |
|
Base year |
2024 |
|
Historic period |
2019-2023 |
|
Forecast period |
2025-2029 |
|
Growth momentum & CAGR |
Accelerate at a CAGR of 4% |
|
Market growth 2025-2029 |
USD 12.5 billion |
|
Market structure |
Fragmented |
|
YoY growth 2024-2025(%) |
3.8 |
|
Key countries |
US, China, Germany, Canada, India, South Korea, France, Japan, Italy, Brazil, UAE, UK, Spain, and Mexico |
|
Competitive landscape |
Leading Companies, Market Positioning of Companies, Competitive Strategies, and Industry Risks |
What are the Key Data Covered in this Automotive Engine Oil Market Research and Growth Report?
- CAGR of the Automotive Engine Oil industry during the forecast period
- Detailed information on factors that will drive the growth and forecasting between 2025 and 2029
- Precise estimation of the size of the market and its contribution of the industry in focus to the parent market
- Accurate predictions about upcoming growth and trends and changes in consumer behaviour
- Growth of the market across APAC, Europe, North America, South America, and Middle East and Africa
- Thorough analysis of the market's competitive landscape and detailed information about companies
- Comprehensive analysis of factors that will challenge the automotive engine oil market growth of industry companies
We can help! Our analysts can customize this automotive engine oil market research report to meet your requirements.