Business Process-As-A-Service Market Size 2024-2028
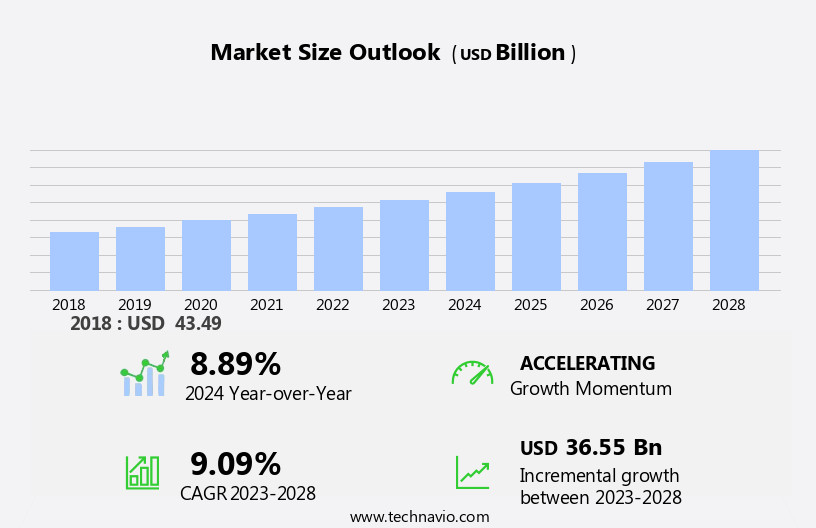
The business process-as-a-service market size is forecast to increase by USD 36.55 billion at a CAGR of 9.09% between 2023 and 2028.
- The Business Process-as-a-Service (BPaaS) market is experiencing significant growth due to the increasing demand for more efficient business processes. Companies are recognizing the benefits of outsourcing non-core functions to specialized service providers, enabling them to focus on their core competencies and improve operational agility. A key trend driving this market is the integration of Internet of Things (IoT) technologies, which generate vast amounts of data that require efficient processing and analysis. However, this trend also presents challenges, particularly In the areas of data security and privacy. As businesses continue to adopt digital transformation initiatives, ensuring the confidentiality, integrity, and availability of their data becomes increasingly important.
- BPaaS solutions span various functions such as finance, healthcare, IT and telecommunication, retail and e-commerce, media and entertainment, and more. Navigating these challenges will require BPaaS providers to invest in security measures and adopt best practices for data protection. Companies seeking to capitalize on the opportunities presented by the BPaaS market must stay abreast of these trends and be prepared to adapt to the evolving regulatory landscape. By partnering with experienced BPaaS providers, they can leverage advanced technologies and expertise to streamline their business processes, enhance customer experience, and gain a competitive edge.
What will be the Size of the Business Process-As-A-Service Market during the forecast period?
- The Business Process-as-a-Service (BPaaS) market encompasses a range of cloud-based offerings that enable organizations to outsource their business processes to third-party service providers. This market caters to various industries, including large enterprises, human resource management, accounting and finance, sales and marketing, supply chain management, government and defense, banking, financial services, insurance (BFSI), and others. Robotic Process Automation (RPA) and cloud computing are key technologies driving the BPaaS market, offering cost-effective solutions with scalability and digital innovations. The market's growth is fueled by the need for cost-efficiency, digital asset management, and compliance with information security regulations.
- With the increasing adoption of cloud-based services, BPaaS is becoming an essential component for businesses seeking to streamline their operations and remain competitive. Despite the benefits, concerns over external hacks and cybersecurity measures continue to influence market growth. Overall, the BPaaS market is expected to experience significant expansion In the coming years, as businesses continue to explore ways to optimize their processes and improve operational efficiency.
How is this Business Process-As-A-Service Industry segmented?
The business process-as-a-service industry research report provides comprehensive data (region-wise segment analysis), with forecasts and estimates in "USD billion" for the period 2024-2028, as well as historical data from 2018-2022 for the following segments.
- Service Type
- Customer service
- Finance and accounting
- Human Resource
- Procurement and supply chain
- Others
- Customer Type
- Large Enterprises
- Small and Medium Enterprises
- Geography
- North America
- US
- Europe
- France
- Germany
- UK
- APAC
- China
- Japan
- Middle East and Africa
- South America
- North America
By Service Type Insights
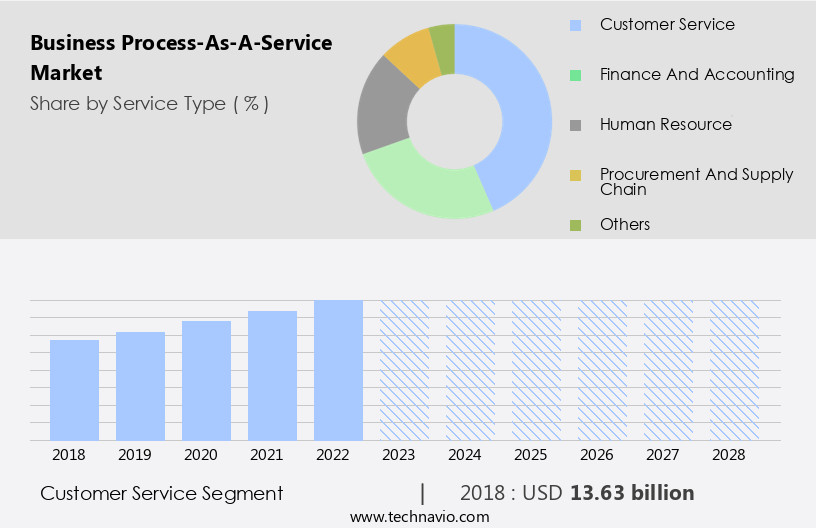
The customer service segment is estimated to witness significant growth during the forecast period.
Business Process-as-a-Service (BPaaS) has emerged as a crucial solution for large enterprises seeking to manage and optimize their business processes in a cost-effective and scalable manner. BPaaS encompasses various functions such as human resource management, accounting and finance, sales and marketing, supply chain management, government and defense, banking, financial services, insurance (BFSI), IT, telecommunications, healthcare, retail, manufacturing, and more. Backend solutions, customer experience, business-to-business sector, artificial intelligence, machine learning, data management, data security, hybrid cloud environments, and robotic process automation are integral components of BPaaS. BPaaS offers several benefits, including cost savings, scalability, digital innovations, and digital transformation.
It enables organizations to make data-driven decisions in remote work settings and adhere to industry regulations. BPaaS solutions are particularly valuable in sectors like IT and telecommunications, retail and e-commerce, media and entertainment, and manufacturing and retail, where large volumes of data need to be processed efficiently. Cloud-based BPaaS solutions offer increased security, with measures against external hacks and cybersecurity threats. The adoption of BPaaS is driven by the need for cost-efficiency, agility, and improved performance. Hybrid deployment modes, digital asset management, and subscription-based models are popular BPaaS delivery models. In summary, BPaaS is a vital tool for organizations aiming to streamline their business processes, enhance customer experience, and gain a competitive edge in today's digital landscape.
Get a glance at the market report of share of various segments Request Free Sample
The Customer service segment was valued at USD 13.63 billion in 2018 and showed a gradual increase during the forecast period.
Regional Analysis
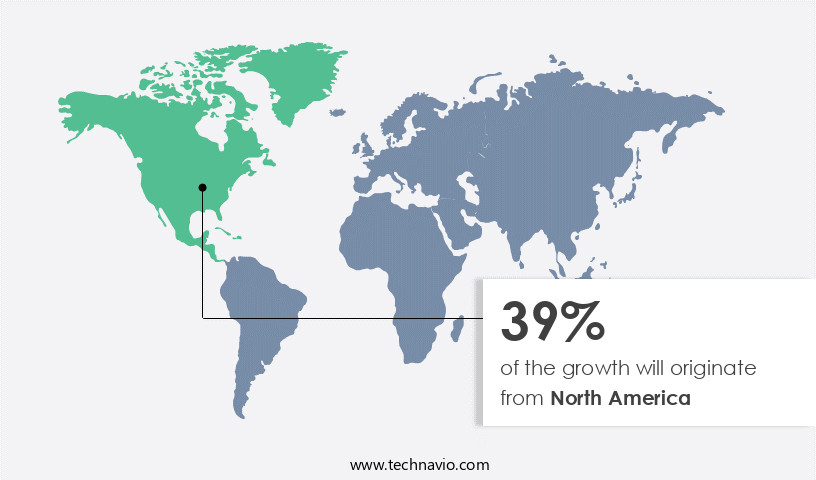
North America is estimated to contribute 39% to the growth of the global market during the forecast period. Technavio's analysts have elaborately explained the regional trends and drivers that shape the market during the forecast period.
For more insights on the market size of various regions, Request Free Sample
Business Process-as-a-Service (BPaaS) market growth in North America is driven by the increasing adoption of cloud computing and automation solutions among large enterprises. IBM and Oracle are major companies In the region contributing to the market expansion. Organizations in industries such as telecommunications, manufacturing, healthcare, retail, and finance are generating massive data volumes, necessitating the integration of BPaaS and advanced technologies like data analytics for real-time decision-making and process optimization. In the BFSI sector, BPaaS solutions enable cost-effective, scalable, and secure operations while adhering to industry regulations.
Similarly, in IT and telecommunications, BPaaS enables digital transformation through hybrid deployment modes, digital asset management, and information security measures. The subscription-based model offers cost-efficiency and flexibility, making it an attractive option for businesses in various sectors. BPaaS solutions also integrate with artificial intelligence, machine learning, and robotic process automation for enhanced business capabilities.
Market Dynamics
Our researchers analyzed the data with 2023 as the base year, along with the key drivers, trends, and challenges. A holistic analysis of drivers will help companies refine their marketing strategies to gain a competitive advantage.
What are the key market drivers leading to the rise In the adoption of Business Process-As-A-Service Industry?
- Demand for more efficient business processes is the key driver of the market. Business Process-as-a-Service (BPaaS) market is witnessing significant growth among large enterprises in various sectors such as human resource management, accounting and finance, sales and marketing, supply chain management, government and defense, banking, financial services, insurance (BFSI), IT, telecommunications, healthcare, retail, manufacturing, and more. Backend solutions that offer customer experience improvements, business-to-business sector enhancements, and digital innovations are driving this trend. Artificial intelligence and machine learning are integral components of these solutions, enabling data management, data security, and cost-effective scalability in hybrid cloud environments.
- Finance, healthcare, IT and telecom, manufacturing, and retail sectors are particularly adopting BPaaS due to the subscription-based model's flexibility and the ability to make data-driven decisions in remote work settings. Digital transformation and hybrid deployment mode are crucial factors, with digital asset management and information security regulations playing a significant role in the adoption process. Robotic process automation and cloud computing are essential automation tools, enhancing finance, healthcare, and other industries' operations while ensuring compliance and security. Thus, such factors are driving the growth of the market during the forecast period.
What are the market trends shaping the Business Process-As-A-Service Industry?
- Increasing integration of Internet of Things (IoT) is the upcoming market trend. Business Process-as-a-Service (BPaaS) market is a significant segment of the cloud computing industry, offering large enterprises cost-effective solutions for managing their business processes in areas such as human resource management, accounting and finance, sales and marketing, supply chain management, and more. The BFSI sector, government and defense, banking, financial services, IT, telecommunications, healthcare, retail, manufacturing, and other industries are increasingly adopting BPaaS for digital transformation. Backend solutions like data management, data security, artificial intelligence, machine learning, and robotic process automation are key components of BPaaS.
- Further, hybrid cloud environments and subscription-based models enable businesses to achieve scalability, digital innovations, and data-driven decision-making in remote work settings. Hybrid deployment mode, digital asset management, and information security regulations are essential considerations for businesses in this space. Cloud computing, automation, and finance sectors are major drivers of the BPaaS market. Cost savings, improved efficiency, and enhanced customer experience are primary benefits of BPaaS for businesses in the business-to-business sector. Thus, such trends will shape the growth of the market during the forecast period.
What challenges does the Business Process-As-A-Service Industry face during its growth?
- Data security and privacy issues is a key challenge affecting the industry growth. Business Process-as-a-Service (BPaaS) market is a significant segment of the cloud computing industry, offering large enterprises cost-effective solutions for managing their business processes in areas such as human resource management, accounting and finance, sales and marketing, supply chain management, and more. The BFSI sector, government and defense, banking, financial services, IT, telecommunications, healthcare, retail, manufacturing, and other industries are increasingly adopting BPaaS for digital transformation. Backend solutions, customer experience, and business-to-business sector are key areas of focus. Artificial intelligence, machine learning, data management, data security, hybrid cloud environments, and robotic process automation are essential components of BPaaS. Finance, healthcare, and other sectors require stringent information security regulations, making data security a top priority.
- Digital innovations, including automation, finance, healthcare, cost-effective solutions, scalability, and digital asset management, are driving the market's growth. The subscription-based model, hybrid deployment mode, and data-driven decision-making are essential features of BPaaS. Remote work settings have become the new norm, making BPaaS an attractive option for businesses looking to streamline their operations and improve efficiency. Hybrid deployment mode, allowing businesses to combine on-premises and cloud-based solutions, is gaining popularity. Overall, BPaaS is a game-changer for businesses seeking to optimize their operations, enhance customer experience, and stay competitive in the digital age. Hence, the above factors will impede the growth of the market during the forecast period
Exclusive Customer Landscape
The business process-as-a-service market forecasting report includes the adoption lifecycle of the market, market growth and forecasting, covering from the innovator's stage to the laggard's stage. It focuses on adoption rates in different regions based on penetration. Furthermore, the business process-as-a-service market report also includes key purchase criteria and drivers of price sensitivity to help companies evaluate and develop their market growth analysis strategies.
Customer Landscape
Key Companies & Market Insights
Companies are implementing various strategies, such as strategic alliances, business process-as-a-service market forecast, partnerships, mergers and acquisitions, geographical expansion, and product/service launches, to enhance their presence In the industry.
The industry research and growth report includes detailed analyses of the competitive landscape of the market and information about key companies, including:
- Accenture Plc
- ANGLER Technologies
- Automation Anywhere Inc.
- Capgemini Service SAS
- Cognizant Technology Solutions Corp.
- Conduent Inc.
- DXC Technology Co.
- Fujitsu Ltd.
- Genpact Ltd.
- HCL Technologies Ltd.
- Infosys Ltd.
- International Business Machines Corp.
- Oracle Corp.
- Outsource2india
- Tata Consultancy Services Ltd.
- Tech Mahindra Ltd.
- ValueLabs
- Vast Edge Inc.
- Virtusa Corp.
- Wipro Ltd.
Qualitative and quantitative analysis of companies has been conducted to help clients understand the wider business environment as well as the strengths and weaknesses of key industry players. Data is qualitatively analyzed to categorize companies as pure play, category-focused, industry-focused, and diversified; it is quantitatively analyzed to categorize companies as dominant, leading, strong, tentative, and weak.
Research Analyst Overview
Business Process-as-a-Service (BPaaS) has emerged as a significant trend In the global business landscape, offering large enterprises cost-effective and scalable solutions for managing various business functions. This market encompasses a wide range of processes, including human resource management, accounting and finance, sales and marketing, supply chain management, government and defense, banking and financial services, insurance (BFSI), IT, telecommunications, healthcare, retail, manufacturing, and backend solutions. BPaaS enables organizations to outsource business processes to third-party service providers, who leverage advanced technologies such as artificial intelligence (AI), machine learning, data management, data security, hybrid cloud environments, robotic process automation, and cloud computing to deliver efficient and accurate services.
The business-to-business sector is a significant consumer of BPaaS, as it allows for data-driven decision-making and remote work settings in a digital transformation era. The IT and telecom industry vertical is a prime adopter of BPaaS, as it requires high levels of automation and digital innovations to maintain competitiveness. Manufacturing and retail industries also benefit significantly from BPaaS, as it enables them to streamline operations, reduce costs, and improve customer experience. The subscription-based model of BPaaS offers flexibility and affordability, allowing businesses to pay only for the services they require. This model also ensures scalability, as businesses can easily increase or decrease their usage based on their needs.
BPaaS providers offer various deployment modes, including hybrid deployment mode, which allows businesses to maintain some control over their processes while outsourcing others. Digital asset management and information security regulations are essential considerations for BPaaS providers, as they handle sensitive data and require cybersecurity measures to prevent external hacks. Cloud adoption is a critical driver of the BPaaS market, as it enables businesses to access services from anywhere, at any time, and on any device. The market is expected to grow significantly In the coming years, driven by the increasing demand for cost-efficient, scalable, and flexible solutions in various industry verticals.
In summary, Business Process-as-a-Service is a dynamic and evolving market that offers large enterprises cost-effective and scalable solutions for managing various business functions. The market is driven by advanced technologies such as AI, machine learning, data management, data security, hybrid cloud environments, and robotic process automation, among others. The subscription-based model and various deployment modes offer flexibility and affordability, making BPaaS an attractive option for businesses in various industry verticals. The market is expected to grow significantly In the coming years, driven by the increasing demand for digital innovations and the need for cost-efficiency and flexibility.
|
Market Scope |
|
|
Report Coverage |
Details |
|
Page number |
211 |
|
Base year |
2023 |
|
Historic period |
2018-2022 |
|
Forecast period |
2024-2028 |
|
Growth momentum & CAGR |
Accelerate at a CAGR of 9.09% |
|
Market growth 2024-2028 |
USD 36.55 billion |
|
Market structure |
Fragmented |
|
YoY growth 2023-2024(%) |
8.89 |
|
Key countries |
US, UK, China, Japan, Germany, and France |
|
Competitive landscape |
Leading Companies, Market Positioning of Companies, Competitive Strategies, and Industry Risks |
What are the Key Data Covered in this Business Process-As-A-Service Market Research and Growth Report?
- CAGR of the Business Process-As-A-Service industry during the forecast period
- Detailed information on factors that will drive the growth and forecasting between 2024 and 2028
- Precise estimation of the size of the market and its contribution of the industry in focus to the parent market
- Accurate predictions about upcoming growth and trends and changes in consumer behaviour
- Growth of the market across North America, Europe, APAC, Middle East and Africa, and South America
- Thorough analysis of the market's competitive landscape and detailed information about companies
- Comprehensive analysis of factors that will challenge the business process-as-a-service market growth of industry companies
We can help! Our analysts can customize this business process-as-a-service market research report to meet your requirements.


