
Corporate Training Market Size 2025-2029
The corporate training market size is forecast to increase by USD 43.86 billion, at a CAGR of 7.8% between 2024 and 2029. The market is experiencing significant shifts driven by the emergence of cost-effective e-learning training modules and the integration of IoT and wearable devices.
Major Market Trends & Insights
- North America dominated the market and accounted for a 46% during the forecast period.
- The market is expected to grow significantly in Europe as well over the forecast period.
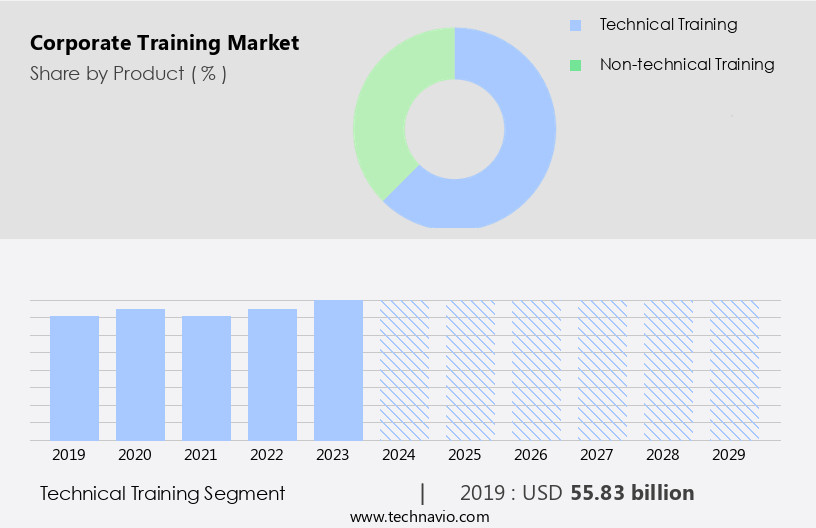
- Based upon the Product, the Technical training segment was valued at USD 55.83 billion in 2023
- Based on the Type, Blended segment accounted for the largest market revenue share in 2023
Market Size & Forecast
- Market Opportunities: USD 076.48 Billion
- Future Opportunities: USD 43.86 billion
- CAGR : 7.8%
- Europe: Largest market in 2023
Companies are increasingly adopting e-learning solutions due to their affordability and flexibility, enabling employees to access training materials anytime, anywhere. This trend is particularly relevant in today's remote work environment. Meanwhile, the Internet of Things (IoT) and wearable devices are revolutionizing corporate training by providing real-time data and analytics, allowing organizations to monitor employee performance and tailor training programs accordingly.
However, technical constraints pose a challenge to implementing these advanced training methods. Companies must ensure their IT infrastructure can support these technologies and that employees have the necessary skills and resources to utilize them effectively. Addressing these challenges will be crucial for organizations seeking to stay competitive and provide their workforce with the most effective and up-to-date training solutions.
What will be the Size of the Corporate Training Market during the forecast period?

- The market continues to evolve, with dynamic market activities unfolding across various sectors. Training materials are no longer static documents, but rather interactive and accessible through learning platforms that support professional development and training administration. Virtual classrooms and instructor-led training are seamlessly integrated with e-learning platforms, enabling mobile learning and sales training. Compliance training, assessment tools, and performance support are essential components, ensuring training effectiveness and adherence to learning objectives. Knowledge management and training content development are crucial for management training and skill development. Course authoring tools and e-learning authoring tools facilitate rapid elearning and video conferencing, while learning analytics and xapi compliance offer valuable insights into training delivery methods and training needs analysis.
- The integration of collaboration tools, self-paced learning, and online courses fosters employee engagement and career advancement. Talent management and certification programs leverage adaptive learning and api integrations to provide personalized learning experiences. Data security and training budget considerations are essential aspects of this evolving landscape. The market is characterized by ongoing innovation, with emerging trends such as AI-powered learning, simulation training, and on-the-job training shaping the future of professional development. The continuous integration of these technologies and methodologies ensures that corporate training programs remain effective and adaptable to the ever-changing business landscape.
How is this Corporate Training Industry segmented?
The corporate training industry research report provides comprehensive data (region-wise segment analysis), with forecasts and estimates in "USD billion" for the period 2025-2029, as well as historical data from 2019-2023 for the following segments.
- Product
- Technical training
- Non-technical training
- Type
- Blended
- E-learning
- Industries
- Retail
- Pharmaceutical and Healthcare
- Financial Services
- Professional Services
- Public Enterprises
- Information Technology
- Training Purpose
- Leadership Development
- Compliance
- Skill Development
- Company Size
- Small Businesses
- Medium Businesses
- Large Enterprises
- Geography
- North America
- US
- Canada
- Europe
- France
- Germany
- Italy
- Spain
- UK
- Middle East and Africa
- UAE
- APAC
- China
- India
- Japan
- South Korea
- South America
- Brazil
- Rest of World (ROW)
- North America
By Product Insights
The technical training segment is estimated to witness significant growth was valued at USD 55.83 billion in 2019 and showed a gradual increase during the forecast period.
The market for non-technical skills is experiencing significant growth due to the increasing importance of soft skills in driving employee productivity. This market segment includes training in intangible areas such as leadership development, team-building, problem-solving, and management techniques. Training programs in this sector are facilitative in nature, focusing on learner-centric outcomes defined by behavioral objectives. Organizations are increasingly prioritizing employee skills development for personal and professional growth. Learning platforms and training materials play a crucial role in delivering non-technical training. Compliance with privacy regulations and accessibility standards is essential for these platforms. Virtual classrooms and instructor-led training provide interactive learning experiences, while e-learning platforms and mobile learning enable flexibility and convenience.
Professional development and management training often involve assessment tools to measure training effectiveness and learning objectives. AI-powered learning and simulation training offer immersive, harmonious learning experiences. Virtual classrooms, e-learning platforms, and performance support tools facilitate on-the-job training and career advancement. Training administration, curriculum design, and data security are essential components of corporate training programs. Training budgets and collaboration tools help manage the training process effectively. Blended learning and training platform integration enable a personalized learning experience for employees. Incorporating adaptive learning and training needs analysis ensures that training content remains relevant and effective. SCORM and xAPI compliance enable seamless integration of learning systems and data tracking.
Self-paced learning and certification programs offer flexibility and a sense of achievement for learners. Training delivery methods continue to evolve, with a shift towards mobile-first learning and leadership development. Skill development and talent management are key priorities for organizations, driving the demand for corporate training programs.
Regional Analysis
North America is estimated to contribute 46% to the growth of the global market during the forecast period.Technavio's analysts have elaborately explained the regional trends and drivers that shape the market during the forecast period.

In The market, North America holds the largest share in 2024, driven by the increasing emphasis of corporations on employee engagement and productivity. This region is home to numerous multinational corporations and large organizations, such as Microsoft, AT&T, IBM, international banks, and insurance companies. These entities, with a diverse workforce, invest significantly in corporate training programs to enhance professional development, improve compliance, and boost skill development. The training landscape encompasses various components, including training materials, privacy compliance, learning platforms, and virtual classrooms. Compliance training, management training, and sales training are essential areas of focus. Assessment tools and training evaluation help measure training effectiveness.
Soft skills training, AI-powered learning, simulation training, and e-learning platforms cater to diverse learning styles and needs. Professional development, knowledge management, and talent management are crucial aspects of corporate training. Curriculum design, data security, and training budget are essential considerations. Collaboration tools facilitate employee engagement and blended learning. Rapid elearning, video conferencing, performance support, and learning analytics enable flexible and efficient training delivery. Accessibility compliance, SCORM compliance, and xAPI compliance ensure inclusivity and interoperability. Technical training, certification programs, adaptive learning, and training needs analysis are integral parts of the corporate training ecosystem. API integrations and self-paced learning cater to modern training requirements.
In conclusion, the market is dynamic, evolving to meet the diverse needs of organizations and their employees. The focus on employee engagement, skill development, and compliance training is driving market growth. The integration of technology and innovative learning methods is transforming the way organizations approach corporate training.
Market Dynamics
Our researchers analyzed the data with 2024 as the base year, along with the key drivers, trends, and challenges. A holistic analysis of drivers will help companies refine their marketing strategies to gain a competitive advantage.
In the dynamic and ever-evolving business landscape, the market plays a pivotal role in equipping workforces with essential skills and knowledge. This market encompasses a diverse range of services, including e-learning, classroom instruction, and on-the-job training. It caters to various industries, from technology and finance to healthcare and education. Companies invest in corporate training to enhance employee productivity, foster innovation, and promote a culture of continuous learning. Training programs cover a multitude of topics, such as leadership development, communication skills, and technical expertise. They leverage cutting-edge technologies like virtual reality, artificial intelligence, and gamification to deliver engaging and effective learning experiences. Ultimately, the market is a vital catalyst for organizational growth and success in today's competitive business environment.
What are the key market drivers leading to the rise in the adoption of Corporate Training Industry?
- The emergence of cost-effective e-learning training modules serves as a primary driver in the market's growth. These modules offer an efficient and economical solution for organizations to upskill their workforce, thereby fueling market expansion.
- Corporate training is an essential investment for organizations to enhance productivity and employee development. Traditional training methods, such as in-person sessions, come with significant expenses, including travel, employee and trainer time, and facility charges. In contrast, digital content and training solutions offer cost savings through the use of training materials and assessment tools available online. Compliance training, professional development, management training, and soft skills training are popular areas of focus. Learning platforms, virtual classrooms, and AI-powered learning are increasingly adopted for their immersive and harmonious learning experiences.
- Training administration is streamlined with assessment tools that evaluate learning objectives and measure training effectiveness. Privacy compliance is ensured through secure platforms and data protection measures. Organizations prioritize these cost-effective and efficient training methods to maintain a competitive edge in the market.
What are the market trends shaping the Corporate Training Industry?
- The emergence of the Internet of Things (IoT) and wearable devices represents a significant market trend in the technological landscape. These innovations are poised to revolutionize various industries and aspects of daily life.
- The market has witnessed significant growth due to the integration of technology into employee development programs. Wearable devices and applications, such as smart glasses and smartwatches, have become increasingly popular for their convenience and time-saving capabilities. These devices enable trainers to monitor trainee attendance and performance in real-time, making training sessions more efficient. Moreover, the use of wearable devices in conjunction with educational technologies, such as augmented reality (AR) and virtual reality (VR), offers immersive learning experiences. Simulation training through AR and VR provides accurate, multidimensional learning opportunities for modern organizations. Elearning platforms, mobile learning, instructor-led training, and knowledge management systems have also become essential components of corporate training.
- Course authoring tools and elearning authoring tools facilitate the development and delivery of customized training content. Rapid elearning and performance support through video conferencing ensure that employees can access training materials and resources anytime, anywhere. In conclusion, the integration of technology into corporate training has revolutionized the way organizations approach employee development. Wearable devices, AR, VR, elearning platforms, mobile learning, instructor-led training, knowledge management systems, course authoring tools, elearning authoring tools, rapid elearning, and performance support are some of the key elements driving the growth of the market.
What challenges does the Corporate Training Industry face during its growth?
- The implementation of corporate training in the industry is hindered by various technical constraints, posing a significant challenge to industry growth.
- Corporate training solutions have become essential for businesses to enhance employee skill development and career advancement. However, customization and integration remain significant challenges in implementing these solutions. Customization is crucial as it caters to specific end-user requirements, reducing time and complexity. Yet, it increases operational costs, particularly for small-scale companies. companies play a vital role in providing technical support to enhance product functionality. However, the withdrawal of support due to cost reductions poses challenges for companies. To address these challenges, training delivery methods have evolved, including on-the-job training, online courses, mobile-first learning, and personalized learning. Learning analytics, xAPI compliance, and SCORM compliance are essential features that enable tracking and reporting of employee progress.
- Technical training and leadership development programs are critical for talent management and certification programs offer recognition and validation of skills. Organizations must prioritize these aspects to ensure effective corporate training implementation. By focusing on these elements, businesses can leverage corporate training to improve employee performance, foster innovation, and achieve long-term success.
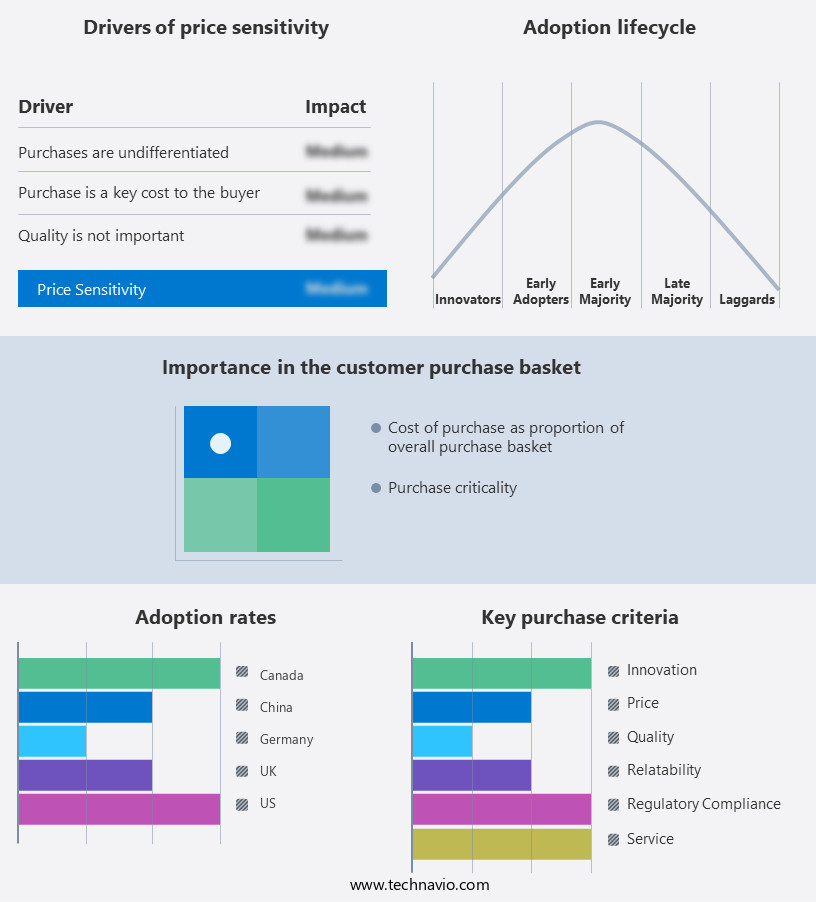
Exclusive Customer Landscape
The corporate training market forecasting report includes the adoption lifecycle of the market, covering from the innovator's stage to the laggard's stage. It focuses on adoption rates in different regions based on penetration. Furthermore, the corporate training market report also includes key purchase criteria and drivers of price sensitivity to help companies evaluate and develop their market growth analysis strategies.
Customer Landscape
Key Companies & Market Insights
Companies are implementing various strategies, such as strategic alliances, corporate training market forecast, partnerships, mergers and acquisitions, geographical expansion, and product/service launches, to enhance their presence in the industry.
Adobe Inc. - The company delivers expert training in Adobe's advanced analytics, advertising, audience management, and commerce solutions. These comprehensive courses equip professionals with the skills to optimize marketing strategies, enhance customer experiences, and drive business growth. By leveraging Adobe's industry-leading technologies, participants gain a competitive edge and expand their expertise in data-driven marketing.
The industry research and growth report includes detailed analyses of the competitive landscape of the market and information about key companies, including:
- Adobe Inc.
- Articulate Global Inc.
- Blanchard Training and Development Inc.
- BTS Group AB
- Cegos Group
- Cisco Systems Inc.
- City and Guilds Group
- D2L Inc.
- DEMOS
- Development Dimensions International Inc.
- Educomp Solutions Ltd.
- Franklin Covey Co.
- John Wiley and Sons Inc.
- Korn Ferry
- Learning Technologies Group Plc
- Mind Gym Plc
- NIIT Ltd.
- Richardson Sales Performance
- Simplilearn
- Skillsoft Corp.
Qualitative and quantitative analysis of companies has been conducted to help clients understand the wider business environment as well as the strengths and weaknesses of key industry players. Data is qualitatively analyzed to categorize companies as pure play, category-focused, industry-focused, and diversified; it is quantitatively analyzed to categorize companies as dominant, leading, strong, tentative, and weak.
Recent Development and News in Corporate Training Market
- In January 2024, Skillsoft announced the launch of its AI-driven corporate training platform, Percipio, which integrates with Microsoft Teams and Google Workspace to provide on-demand learning solutions for employees (Skillsoft Press Release, 2024).
- In March 2024, IBM and Coursera joined forces to offer IBM's professional certification programs on Coursera's platform, expanding IBM's reach in the market and providing Coursera with IBM's industry-recognized certifications (IBM Press Release, 2024).
- In May 2024, LinkedIn Learning, Microsoft's e-learning platform, secured a strategic partnership with Walmart to provide the retail giant's employees with access to LinkedIn Learning's content, aiming to upskill and reskill over 140,000 employees (LinkedIn Press Release, 2024).
- In February 2025, Degreed, a leading corporate learning platform, raised USD110 million in a Series E funding round, bringing its total funding to USD350 million, to fuel its product development and expand its market presence (Degreed Press Release, 2025).
Research Analyst Overview
- In the market, multimedia content and user-friendly interfaces are increasingly essential for effective learning experiences. Compliance requirements dictate the use of training manuals, interactive simulations, and performance management tools. Content authoring tools facilitate the creation of onboarding programs, channel training, and accessibility features. Collaboration software, data encryption, and project management tools enhance teamwork and security. Customer training, reporting features, and training videos are crucial for external stakeholders. LMS integrations, eLearning content libraries, and training delivery platforms streamline content access and distribution. Talent acquisition relies on knowledge checks and customizable dashboards for efficient candidate evaluation. Succession planning, learning path design, language localization, and interactive exercises ensure a skilled workforce.
- Security protocols and compliance certifications safeguard sensitive information. Reporting and analytics, web conferencing tools, and learning analytics dashboards provide valuable insights for continuous improvement. Case studies illustrate the impact of global training initiatives. Feedback mechanisms foster a culture of continuous learning and improvement.
Dive into Technavio's robust research methodology, blending expert interviews, extensive data synthesis, and validated models for unparalleled Corporate Training Market insights. See full methodology.
|
Market Scope |
|
|
Report Coverage |
Details |
|
Page number |
197 |
|
Base year |
2024 |
|
Historic period |
2019-2023 |
|
Forecast period |
2025-2029 |
|
Growth momentum & CAGR |
Accelerate at a CAGR of 7.8% |
|
Market growth 2025-2029 |
USD 43.86 billion |
|
Market structure |
Fragmented |
|
YoY growth 2024-2025(%) |
7.2 |
|
Key countries |
US, China, Germany, Canada, India, South Korea, France, Japan, Italy, Brazil, UAE, UK, and Spain |
|
Competitive landscape |
Leading Companies, Market Positioning of Companies, Competitive Strategies, and Industry Risks |
What are the Key Data Covered in this Corporate Training Market Research and Growth Report?
- CAGR of the Corporate Training industry during the forecast period
- Detailed information on factors that will drive the growth and forecasting between 2025 and 2029
- Precise estimation of the size of the market and its contribution of the industry in focus to the parent market
- Accurate predictions about upcoming growth and trends and changes in consumer behaviour
- Growth of the market across North America, Europe, APAC, South America, and Middle East and Africa
- Thorough analysis of the market's competitive landscape and detailed information about companies
- Comprehensive analysis of factors that will challenge the corporate training market growth of industry companies
We can help! Our analysts can customize this corporate training market research report to meet your requirements.