Cricket Equipment Market Size 2025-2029
The cricket equipment market size is forecast to increase by USD 2.78 billion at a CAGR of 3.5% between 2024 and 2029.
- The market is experiencing significant growth, driven primarily by the increasing number of cricket tournaments and sport events worldwide. With the proliferation of international and domestic tournaments, the demand for high-quality cricket equipment is on the rise. Furthermore, there is a noticeable trend towards health and wellness, with consumers showing a growing interest in sports and physical activities. This shift towards active lifestyles is creating new opportunities for cricket equipment manufacturers. However, the market faces challenges as well. One of the most pressing issues is the insufficient cricket infrastructure in some countries, particularly in developing regions. Lack of adequate facilities, such as cricket pitches and training centers, can hinder the growth of the game and limit the market potential.
- Despite these challenges, companies can capitalize on the market opportunities by focusing on innovation, product development, and strategic partnerships to meet the evolving needs of cricket enthusiasts and players. Additionally, investing in emerging markets and collaborating with local organizations to build cricket infrastructure could help overcome the infrastructure challenge and expand the market reach.
What will be the Size of the Cricket Equipment Market during the forecast period?

- The market continues to evolve, driven by advancements in materials, technology, and design. Amateur and professional cricket players alike seek innovative solutions for improved performance and safety. Cricket equipment trends reflect a focus on durability, comfort, and protective gear, particularly in junior and youth cricket. Manufacturers prioritize compliance with regulations and standards, ensuring high-quality cricket kits for all levels. Cricket innovation transcends traditional boundaries, with online platforms revolutionizing retail and distribution. Cricket analytics and coaching tools provide valuable insights, enhancing training and competition. Cricket equipment competition intensifies, as brands strive to outperform each other in design, technology, and price points.
- Cricket shoes, clothing, and accessories cater to diverse needs, with a growing emphasis on customization and functionality. Cricket equipment supply remains a critical concern, as international cricket schedules and domestic leagues drive demand. Cricket technology, from smart bats to advanced protective gear, continues to redefine the game. The cricket equipment industry adapts to the ever-changing market dynamics, fostering a competitive landscape that benefits players and enthusiasts alike. Cricket data and performance analysis tools offer valuable insights, enabling informed decisions and continuous improvement. Test cricket and one-day cricket share the spotlight, with both formats driving demand for high-performance equipment.
- In this continuous unfolding of market activities, cricket equipment brands, club cricket, cricket equipment design, cricket equipment competition, cricket performance, cricket analytics, cricket training, cricket equipment industry, cricket equipment online, cricket equipment performance, and test cricket remain interconnected, shaping the future of the market.
How is this Cricket Equipment Industry segmented?
The cricket equipment industry research report provides comprehensive data (region-wise segment analysis), with forecasts and estimates in "USD million" for the period 2025-2029, as well as historical data from 2019-2023 for the following segments.
- Product
- Cricket bats
- Cricket balls
- Cricket protective gears
- Others
- Distribution Channel
- Offline
- Online
- End-user
- Recreational players
- Professional players
- Type
- Mass
- Premium
- Geography
- Europe
- Germany
- UK
- Middle East and Africa
- South Africa
- UAE
- APAC
- Australia
- India
- New Zealand
- Pakistan
- Sri Lanka
- Rest of World (ROW)
- Europe
By Product Insights
The cricket bats segment is estimated to witness significant growth during the forecast period.
The market encompasses a range of materials and categories, including cricket bats, protective gear, shoes, kits, and accessories. Cricket bats, the major revenue contributor, are primarily made from willow woods, such as English willow and Kashmir willow, in regions like MEA and South America. Manufacturers in India and Pakistan produce a significant portion of professional cricket bats in APAC. Ethylene-vinyl acetate (EVA), a versatile copolymer, is also used in cricket bat production. Safety is a paramount concern in cricket equipment, with regulations governing protective gear and equipment standards. Cricket trends lean towards innovation, with advancements in technology leading to lighter, stronger, and more durable cricket kits.
Cricket equipment caters to amateur and professional players, as well as juniors and schools. One-day and T20 cricket have driven demand for high-performance cricket shoes and protective gear. Cricket equipment retailers play a crucial role in the industry, offering a wide range of brands, designs, and competition-ready kits. Cricket coaching and analytics have gained prominence, with technology enabling performance tracking and data-driven training. Cricket clothing and accessories, such as helmets, gloves, and pads, are essential components of a complete cricket kit. The cricket equipment industry is dynamic, with continuous innovation and competition driving improvements in design, technology, and quality.
Cricket equipment prices vary, with premium brands catering to professional and high-performance cricket. International cricket and club cricket further expand the market's reach and demand. Overall, the market is a vibrant and evolving industry that caters to the diverse needs of cricket enthusiasts worldwide.
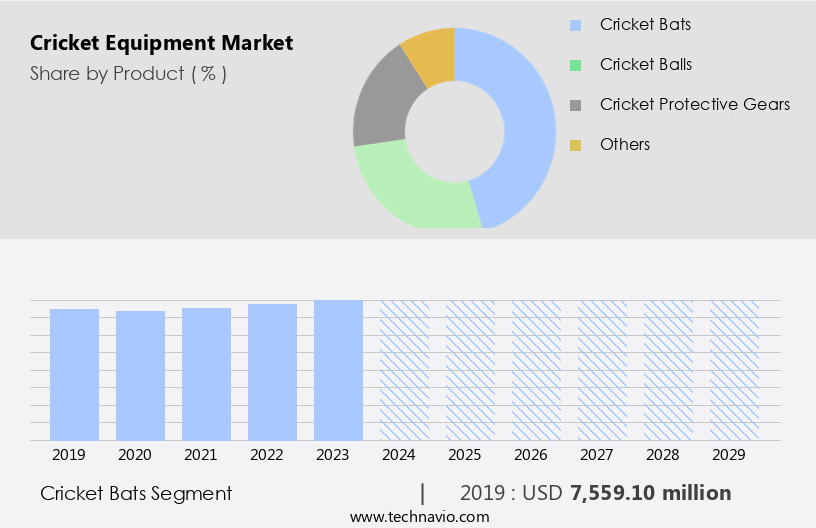
The Cricket bats segment was valued at USD 7.56 billion in 2019 and showed a gradual increase during the forecast period.
Regional Analysis
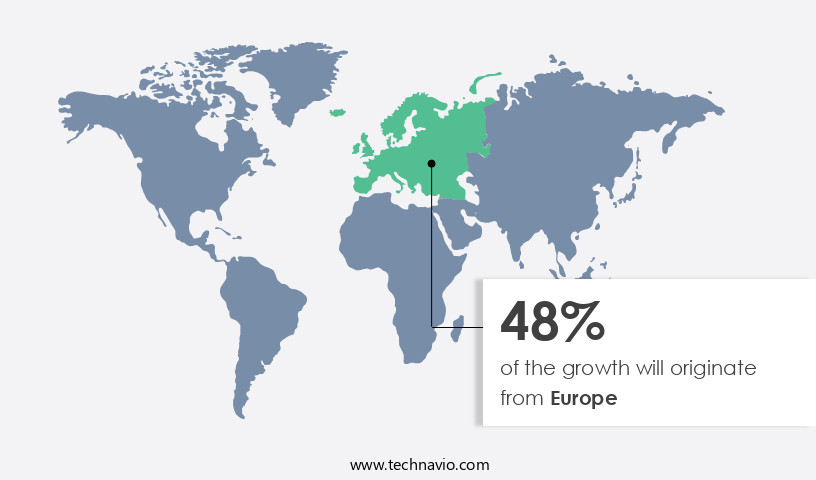
Europe is estimated to contribute 48% to the growth of the global market during the forecast period.Technavio's analysts have elaborately explained the regional trends and drivers that shape the market during the forecast period.
The market experiences significant growth, driven by the increasing popularity of cricket in Europe and other regions. Cricket materials, such as aluminum and Carbon Fiber, are utilized in manufacturing high-performance cricket bats and balls. Amateur cricket participation continues to rise, leading to increased demand for protective gear, including helmets, pads, and gloves. Cricket innovation is a key trend, with companies investing in technology to enhance equipment performance and durability. Cricket kits, consisting of a bat, ball, pads, gloves, and helmet, are essential for both amateur and professional players. Junior cricket programs and youth cricket leagues contribute to the market's expansion, with a focus on safety regulations and equipment standards.
Cricket shoes are designed with advanced materials for improved comfort and traction. Cricket equipment retailers play a crucial role in supplying cricket gear to players, with online platforms gaining popularity. One-day cricket and T20 cricket formats have increased the demand for cricket equipment, as more tournaments and leagues are organized. Schools and universities also contribute to the market by investing in cricket equipment for coaching and training purposes. Cricket equipment quality is a significant concern, with brands prioritizing research and development to create superior products. Cricket technology, such as smart bats and analytics tools, is revolutionizing the game by providing valuable insights for players and coaches.
Cricket coaching and training programs are increasingly utilizing cricket equipment to improve performance. International cricket competitions, including the ICC World Cup and the Indian Premier League, drive the demand for cricket equipment on a global scale. Cricket data and analytics are being used to optimize equipment design and manufacturing processes, leading to more efficient and cost-effective solutions. The cricket equipment industry is expected to continue growing, with a focus on innovation, quality, and sustainability.
Market Dynamics
Our researchers analyzed the data with 2024 as the base year, along with the key drivers, trends, and challenges. A holistic analysis of drivers will help companies refine their marketing strategies to gain a competitive advantage.
What are the key market drivers leading to the rise in the adoption of Cricket Equipment Industry?
- The significant rise in the number of cricket tournaments serves as the primary growth driver for the cricket market.
- The market is experiencing significant growth due to the increasing popularity of cricket as a sport. With the rise in the number of cricket tournaments and matches, both at the professional and youth levels, the demand for cricket equipment is increasing. One-day cricket and other formats have gained popularity, leading to a surge in the production of cricket equipment. Cricket equipment manufacturing companies are investing heavily in technology to produce durable and high-performance equipment. Protective gear, such as helmets and pads, are becoming increasingly important as safety concerns grow. Cricket accessories, including balls, bats, and wickets, are also in high demand.
- The cricket equipment retail market is growing, with many players entering the market to cater to the increasing demand. Cricket equipment suppliers are focusing on providing a wide range of products to meet the diverse needs of cricket players. The emphasis is on producing equipment that is not only durable but also immersive and harmonious, providing a better playing experience. In conclusion, the market is expected to continue its growth trajectory due to the increasing popularity of cricket and the growing number of tournaments and matches. The focus on technology and durability, along with the increasing demand for protective gear and accessories, will further drive the growth of the market.
What are the market trends shaping the Cricket Equipment Industry?
- The consumer preference for adopting healthy lifestyles represents a significant market trend. This shift towards wellness is expected to shape business strategies and product offerings in the near future.
- The market has experienced significant growth due to the increasing popularity of cricket, particularly in schools and educational institutions. The emphasis on cricket coaching and technology has led to a heightened focus on the quality of cricket equipment. This trend is driven by the desire to provide a better learning experience for students and improve their performance. T20 cricket, with its fast-paced and exciting nature, has also contributed to the demand for cricket equipment. Cricket data and analytics have become essential tools for coaches and teams, allowing them to make informed decisions and strategize effectively.
- As a result, cricket equipment distribution companies have responded by offering advanced technology-driven solutions. International cricket matches continue to fuel the demand for high-quality cricket equipment. Cricket clothing has become an integral part of the market, with manufacturers focusing on producing comfortable, durable, and functional garments. The market is expected to continue its growth trajectory, driven by the increasing number of cricket enthusiasts and the continuous advancements in cricket technology.
What challenges does the Cricket Equipment Industry face during its growth?
- The insufficient cricket infrastructure in certain countries poses a significant challenge to the expansion and growth of the cricket industry.
- The cricket equipment industry caters to the demands of cricket enthusiasts worldwide, with various brands offering innovative designs to enhance cricket performance. Club cricket, a significant segment of the market, thrives on the competitive spirit and passion for the game. Cricket equipment competition is fierce, with brands continually striving to outdo each other in terms of functionality, durability, and aesthetics. Cricket analytics and training have become essential components of the cricket ecosystem, enabling players to optimize their performance and strategies. Cricket equipment design focuses on improving ergonomics, material quality, and technological advancements to cater to the evolving needs of players.
- However, the growth of the cricket equipment industry is not uniform across all regions. In countries where cricket is not the most popular sport, the market remains underdeveloped due to insufficient infrastructure. For instance, many countries in APAC, excluding India and Pakistan, face this challenge. The US, in North America, is another example where the lack of cricket grounds limits the market's potential. The West Indies cricket team has also highlighted the need for improved infrastructure to support the growth of the game. In conclusion, the cricket equipment industry is driven by the competitive spirit and passion for cricket, with a focus on innovation and performance.
- However, the growth of the market is hindered in countries where the required infrastructure is lacking.
Exclusive Customer Landscape
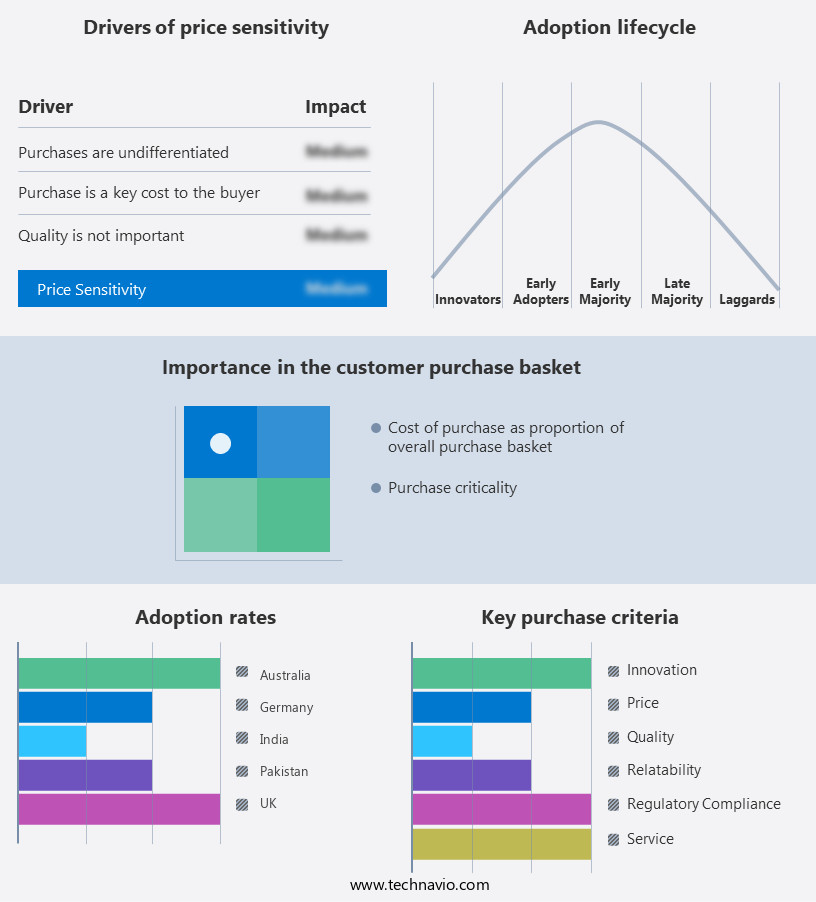
The cricket equipment market forecasting report includes the adoption lifecycle of the market, covering from the innovator's stage to the laggard's stage. It focuses on adoption rates in different regions based on penetration. Furthermore, the cricket equipment market report also includes key purchase criteria and drivers of price sensitivity to help companies evaluate and develop their market growth analysis strategies.
Customer Landscape
Key Companies & Market Insights
Companies are implementing various strategies, such as strategic alliances, cricket equipment market forecast, partnerships, mergers and acquisitions, geographical expansion, and product/service launches, to enhance their presence in the industry.
Adidas AG - This company specializes in providing top-tier cricket equipment, including the Howzat Spike 20, Rise V2, Nu 23, and Cricup 21 cricket shoes. Our offerings cater to the needs of dedicated cricket players, ensuring superior comfort, durability, and performance. Each shoe model is meticulously designed to enhance the athlete's experience on the field. By utilizing innovative materials and cutting-edge technology, we aim to elevate the cricket player's game and contribute to their success. Our commitment to quality and customer satisfaction sets US apart in the market.
The industry research and growth report includes detailed analyses of the competitive landscape of the market and information about key companies, including:
- Adidas AG
- Beat All Sports
- British Cricket Balls Ltd.
- CA Sports PVT LTD
- Cooper Cricket
- Delux Sports Co.
- Duncan Fearnley Cricket Sales Ltd
- Fantail
- Grays of Cambridge Ltd
- Kippax Willow Ltd.
- Kookaburra Sport Pty Ltd.
- Kraken Cricket
- Masuri Group Ltd.
- MRF Ltd.
- Nike Inc.
- PUMA SE
- Sanspareils Greenlands Pvt Ltd.
- Sareen Sports Industries
- Sommers Sports
- Spartan Sports
- Stanford Cricket Industries
- Woodworm Direct
Qualitative and quantitative analysis of companies has been conducted to help clients understand the wider business environment as well as the strengths and weaknesses of key industry players. Data is qualitatively analyzed to categorize companies as pure play, category-focused, industry-focused, and diversified; it is quantitatively analyzed to categorize companies as dominant, leading, strong, tentative, and weak.
Recent Development and News in Cricket Equipment Market
- In February 2024, leading cricket equipment manufacturer, Gray-Nicolls, introduced its innovative new bat range, the Vintage Legends, featuring cutting-edge technology and classic designs (Gray-Nicolls Press Release). This strategic product launch aimed to cater to both traditional and modern cricket players, expanding the company's product portfolio.
- In May 2025, Adidas and New Balance, two major sports brands, announced a partnership to co-brand cricket shoes, marking a significant collaboration in the cricket equipment industry (Adidas Press Release). This strategic alliance was expected to boost both companies' market presence and product offerings in the cricket sector.
- In October 2024, Sanspareils Greenlands, an Indian cricket equipment manufacturer, raised INR 150 crores (USD20 million) in a Series C funding round led by Sequoia India and Fidelity Management & Research Company (VCCircle). This substantial investment aimed to support the company's expansion plans, including new product development and increased market penetration.
- In January 2025, the Indian government announced the National Cricket Infrastructure and Development Fund, allocating INR 500 crores (USD67 million) to upgrade cricket facilities across the country (Ministry of Youth Affairs and Sports Press Release). This initiative was expected to create new opportunities for cricket equipment manufacturers and suppliers, as well as boost the overall growth of the cricket industry in India.
Research Analyst Overview
The market encompasses a range of essential items for players, including bats, shoes, protective gear, and accessories. Bat construction, specifically the bat sweet spot and willow quality, significantly influences batting performance. Cricket shoe performance and durability are crucial factors for players, with traction and support key considerations. Shin guards, arm guards, and protective padding offer essential safety features. Cricket ball size, weight, and seam type impact ball bounce and swing.
Bat handle, balance, and grip technology contribute to optimal bat performance. Cricket clothing breathability and comfort are essential for player endurance. Wicket keeper gloves, wicket keeping gear, and batsman helmets provide additional protective measures. Regular cricket equipment maintenance ensures longevity and optimal functionality.
Dive into Technavio's robust research methodology, blending expert interviews, extensive data synthesis, and validated models for unparalleled Cricket Equipment Market insights. See full methodology.
|
Market Scope |
|
|
Report Coverage |
Details |
|
Page number |
229 |
|
Base year |
2024 |
|
Historic period |
2019-2023 |
|
Forecast period |
2025-2029 |
|
Growth momentum & CAGR |
Accelerate at a CAGR of 3.5% |
|
Market growth 2025-2029 |
USD 2776.7 million |
|
Market structure |
Fragmented |
|
YoY growth 2024-2025(%) |
3.1 |
|
Key countries |
UK, Germany, India, Australia, Pakistan, New Zealand, Sri Lanka, South Africa, UAE, and Zimbabwe |
|
Competitive landscape |
Leading Companies, Market Positioning of Companies, Competitive Strategies, and Industry Risks |
What are the Key Data Covered in this Cricket Equipment Market Research and Growth Report?
- CAGR of the Cricket Equipment industry during the forecast period
- Detailed information on factors that will drive the growth and forecasting between 2025 and 2029
- Precise estimation of the size of the market and its contribution of the industry in focus to the parent market
- Accurate predictions about upcoming growth and trends and changes in consumer behaviour
- Growth of the market across Europe, APAC, North America, South America, and Middle East and Africa
- Thorough analysis of the market's competitive landscape and detailed information about companies
- Comprehensive analysis of factors that will challenge the cricket equipment market growth of industry companies
We can help! Our analysts can customize this cricket equipment market research report to meet your requirements.