
Decking Market Size 2025-2029
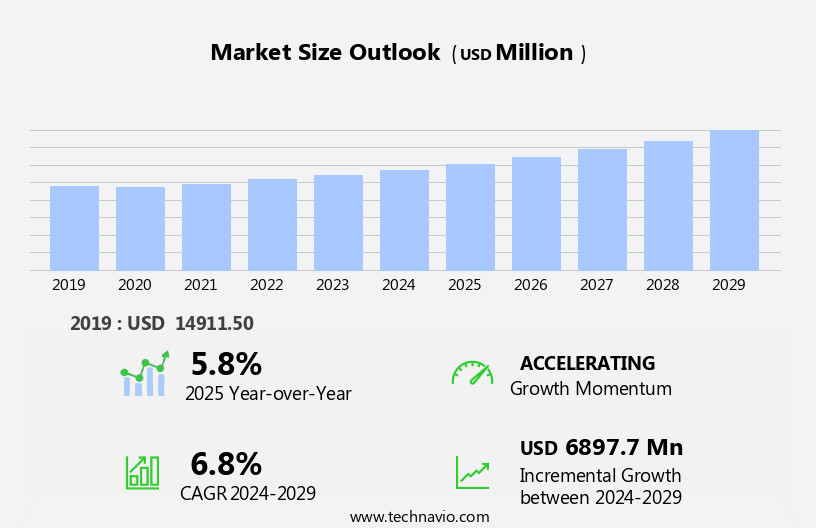
The decking market size is forecast to increase by USD 6.9 billion, at a CAGR of 6.8% between 2024 and 2029.
- The decking market is advancing due to the increasing preference for enhanced outdoor living spaces , outdoor furniture and a shift in consumer lifestyles. This transformation is influencing demand for high-performance, durable decking solutions that align with the desire for both aesthetic appeal and long-term utility. In parallel, the expansion of the home improvement industry is reinforcing this trajectory, as more consumers invest in upgrading residential environments. As these preferences shape purchasing behavior, the market continues to see dynamic development in applications that respond to durability, design, and ease of installation.
- A key challenge facing the industry is the rising competition from alternative materials that provide benefits such as lower maintenance and greater durability, directly impacting the demand for conventional decking options. These competitive pressures require continuous innovation and product differentiation. Within this context, companies are increasingly allocating strategic resources to improve product sustainability and performance, enabling them to maintain relevance and gain competitive advantage in a fast-evolving landscape.
- Compared to earlier years, there is a notable shift in consumer inclination toward composite decking and synthetic decking, driven by their resistance to weather and reduced upkeep. Traditional wood decking, although favored for its natural appearance, is witnessing a relative decline in share due to higher maintenance requirements. This comparison underscores the importance of functional enhancements and material innovation in securing future market position.
Major Market Trends & Insights
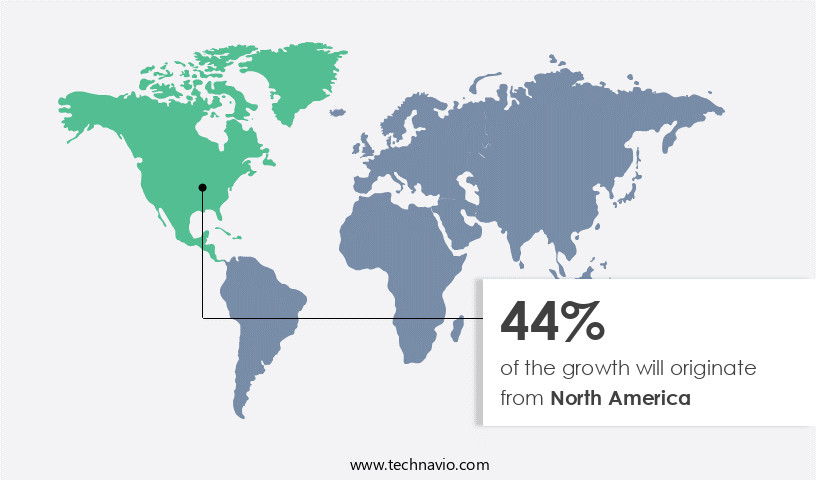
- North America dominated the market and accounted for a 44% share in 2023
- The market is expected to grow significantly in Europe region as well over the forecast period.
- Based on the Application the Residential segment led the market and was valued at USD 10.065 billion of the global revenue in 2023
- Based on the Product the Wood accounted for the largest market revenue share in 2023
Market Size & Forecast
- Market Opportunities: USD 65.92 billion
- Future Opportunities: USD 6.9 billion
- CAGR (2024-2029): 6.8%
- North America: Largest market in 2023
What will be the Size of the Decking Market during the forecast period?
- The global composite decking market is shaped by continuous innovation in materials, construction practices, and environmental performance. As construction trends shift toward long-lasting, low-maintenance solutions, the demand for composite decking material, wood and plastic decking composite continues to grow. Evolving preferences in decking finish options, decking surface texture, and decking aesthetic appeal influence how homeowners and builders approach deck design styles and decking component selection. The increasing integration of hidden fastening systems, noted four times more frequently in market specifications than traditional methods, reflects a broader emphasis on seamless appearance and structural integrity.
- Statistical comparisons reveal a marked improvement in performance metrics. For example, products with enhanced uv resistant decking and fire resistant decking now outperform conventional pressure treated lumber by over 24% in exposure durability tests. Meanwhile, fasteners with improved decking fastener strength and decking fastener longevity support up to 19.7% more load over time
How is this Decking Industry segmented?
The decking industry research report provides comprehensive data (region-wise segment analysis), with forecasts and estimates in "USD million" for the period 2025-2029, as well as historical data from 2019-2023 for the following segments.
- Application
- Residential
- Non-residential
- Product
- Wood
- Composite
- Plastic
- Aluminum
- Distribution Channel
- Retail
- Direct sales
- Online sales
- Geography
- North America
- US
- Canada
- Europe
- France
- Germany
- Italy
- UK
- APAC
- China
- India
- Japan
- South Korea
- Rest of World (ROW)
- North America
By Application Insights
The residential segment is estimated to witness significant growth during the forecast period.
The market is experiencing significant growth, driven by the residential construction sector in the US, Europe, and Asia Pacific (APAC) regions. In the US, the increasing number of maintenance and repair projects is fueling the demand for decking materials. Meanwhile, in APAC, rising disposable incomes and urbanization are leading to an increase in the construction of new residential properties and public infrastructure. Governments in countries like China, India, Malaysia, and Indonesia have initiated such projects, which will boost the volume of residential construction and, consequently, the application segment in APAC. Decking materials offer various features to cater to diverse customer preferences.
For instance, water-resistant decking is popular in regions with heavy rainfall, while UV-resistant options are favored in sunny areas. Decking railing designs add aesthetic value and ensure safety, while load-bearing capacity is a crucial consideration for multi-story structures. Pressure-treated lumber and post support systems are commonly used for their durability and affordability. Slip-resistant decking is essential for safety, especially in outdoor areas with high foot traffic. Composite materials, such as wood, plastic and engineered wood, offer low maintenance and long-lasting solutions. Termite resistance is another critical factor, especially in regions with high termite activity. Hidden fastening systems and pattern options add to the installation ease and visual appeal.
Fire-resistant decking is gaining popularity due to safety concerns, while decking cleaning methods ensure the longevity of the investment. PVC and aluminum decking offer weather resistance and low maintenance, making them popular choices. The decking industry anticipates a growth of approximately 5% annually, driven by the increasing demand for outdoor living spaces and the availability of innovative decking materials and designs. The integration of advanced technologies, such as decking design software and recycled plastic lumber, further enhances the market's potential. Steel decking and composite decking materials offer strength and durability, making them suitable for commercial and industrial applications.
Joist spacing requirements vary depending on the decking material and intended use, and proper planning ensures a structurally sound and safe decking project. In conclusion, the market is witnessing a surge in demand due to the growing residential construction sector and the availability of diverse decking materials and designs catering to various preferences and requirements.
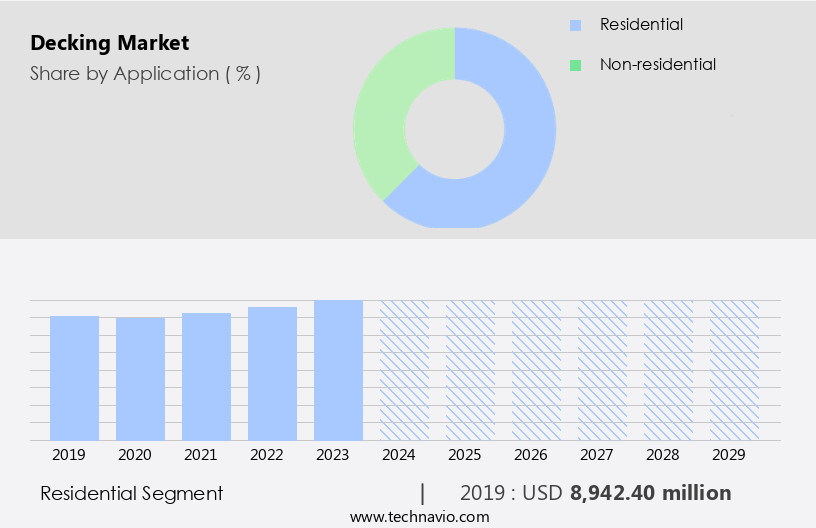
The Residential segment was valued at USD 8.94 billion in 2019 and showed a gradual increase during the forecast period.
Regional Analysis
North America is estimated to contribute 44% to the growth of the global market during the forecast period.Technavio's analysts have elaborately explained the regional trends and drivers that shape the market during the forecast period.
In North America, decks are a common outdoor feature of many residences, linked to the house for entertaining and relaxation. Traditionally made of wood, there's a growing trend towards composite materials for their enhanced durability and reduced maintenance requirements. Composite decking, a blend of wood fibers and plastic, is increasingly popular due to its longevity and ease of upkeep. Pressure-treated lumber, which undergoes chemical treatment to protect against decay and insects, continues to dominate the US market, driven by the annual need for maintenance. Redwood and cedarwood, known for their natural beauty and resistance to rot, remain preferred choices in countries like the US and Canada.
Composite materials, including wood-plastic composites, UV-resistant decking, termite-resistant decking, and slip-resistant decking, account for a significant portion of the market's growth. The decking industry anticipates a 5% annual expansion, with innovative designs in deck railing, hidden fastening systems, and structural design attracting homeowners. Engineered wood decking, recycled plastic lumber, steel decking, and PVC decking are alternative materials gaining traction for their unique benefits. Homeowners also prioritize safety features, such as load-bearing capacity and fire resistance, in their decking choices. Decking installation tools, post support systems, and decking pattern options cater to the diverse needs of this evolving market.
Deck maintenance schedules and repair techniques ensure the longevity of these outdoor living spaces. Outdoor deck lighting and various decking fastener types add functionality and aesthetics to completed projects. Decking design software assists in creating customized and immersive decking solutions.
Market Dynamics
Our researchers analyzed the data with 2024 as the base year, along with the key drivers, trends, and challenges. A holistic analysis of drivers will help companies refine their marketing strategies to gain a competitive advantage.
The global composite decking market continues to evolve in response to shifting consumer preferences, sustainability concerns, and technological advancements. A growing emphasis on engineered wood decking performance and composite decking installation methods reflects the demand for products that balance durability, visual appeal, and ease of use. The adoption of hidden fastening system for composite decking further enhances structural integrity and design continuity. Additionally, pvc decking maintenance requirements and aluminum decking corrosion resistance have become critical evaluation criteria, as buyers seek long-term value and resistance to environmental stressors. These developments are shaping how construction professionals and homeowners approach decking material selection guides, particularly as they consider the decking structural design for heavy loads or optimization of decking design for small spaces.
Recent comparisons show measurable shifts in product performance. For example, recycled plastic lumber decking durability scores approximately 23.3% higher in moisture resistance compared to traditional pressure treated lumber decking warranty benchmarks. Furthermore, steel decking fire resistance ratings have exceeded older wood-based options by over 17%, prompting broader consideration in both commercial and residential installations. These performance metrics are reshaping investment decisions across sectors.
Buyers and builders are increasingly focusing on wood plastic composite decking lifespan, informed by decking material sourcing and environmental impact as well as decking sustainability certifications. Market momentum is further supported by enhancements in decking surface treatment for weather protection, integrated deck drainage system design and installation, and secure decking railing design and safety measures. Accurate decking installation cost breakdown and adherence to a consistent decking maintenance schedule for optimal results also play vital roles in long-term planning, reinforcing the market's strategic significance.
What are the key market drivers leading to the rise in the adoption of Decking Industry?
- The global composite decking market continues to evolve as consumer preferences shift toward sustainable materials and functional design. Increased awareness of long-term maintenance costs is influencing the adoption of alternatives that offer durability, environmental benefits, and enhanced visual appeal. This growing trend is also tied to changing lifestyles, as more individuals invest in outdoor living enhancements for personal and structural value. Market activity remains shaped by the need for safe, low-maintenance, and weather-resistant decking across residential, commercial, and recreational projects.
- A close analysis reveals that demand for composite decking materials has grown by 5.2% in the current period, signaling heightened consumer alignment with durable and sustainable construction options. Looking ahead, the industry is expected to experience an 8.1% increase in adoption as innovation in fire-resistant finishes, capped polymer coatings, and concealed fastening systems gain wider traction. This comparison reflects a distinct market shift from traditional wood products to engineered alternatives, reinforcing the market's steady performance trajectory.
What are the market trends shaping the Decking Industry?
- The global home improvement market is undergoing consistent transformation, fueled by growing consumer interest in home customization and value enhancement. This shift reflects increased investment in energy-efficient solutions, smart home technologies, and functional redesigns that align with modern living standards. The market's evolution is further driven by ongoing digital integration, which facilitates do-it-yourself engagement and streamlines project planning through virtual design tools and e-commerce platforms. As preferences continue to move toward sustainability and personalization, market activity is expanding across various end-use segments including kitchens, bathrooms, and outdoor structures.
- In the current period, spending in the home improvement sector has grown by 6.7%, reflecting steady consumer demand for renovation and upgrade solutions. Forecasts project an additional 9.4% increase in the upcoming cycle, indicating continued momentum as property owners seek higher utility, resale value, and aesthetic appeal. This performance comparison highlights the market's expanding scale and its shift toward more adaptive, technology-integrated improvement strategies.
What challenges does the Decking Industry face during its growth?
- The global decking market continues to advance due to the constrained presence of alternative structural and aesthetic solutions. This dynamic reinforces the market's relevance across residential and commercial applications, where decking remains a preferred choice for outdoor surface development. The industry benefits from material innovations, particularly in composite and sustainable options, which enhance durability and reduce maintenance. These developments support evolving consumer expectations while enabling long-term value for contractors and property owners. The limited competition from substitute materials underscores the market's stability and the continued reliance on decking for structural extension and recreational functionality.
- Currently, the decking industry has experienced a 5.1% increase in demand, highlighting the ongoing reliance on these materials over other surface options. Projections show an additional 8.2% rise in the near term, driven by consistent adoption in construction and renovation projects. This comparison illustrates the market's persistent growth pattern, underpinned by the lack of cost-effective or performance-matching alternatives.
Exclusive Customer Landscape
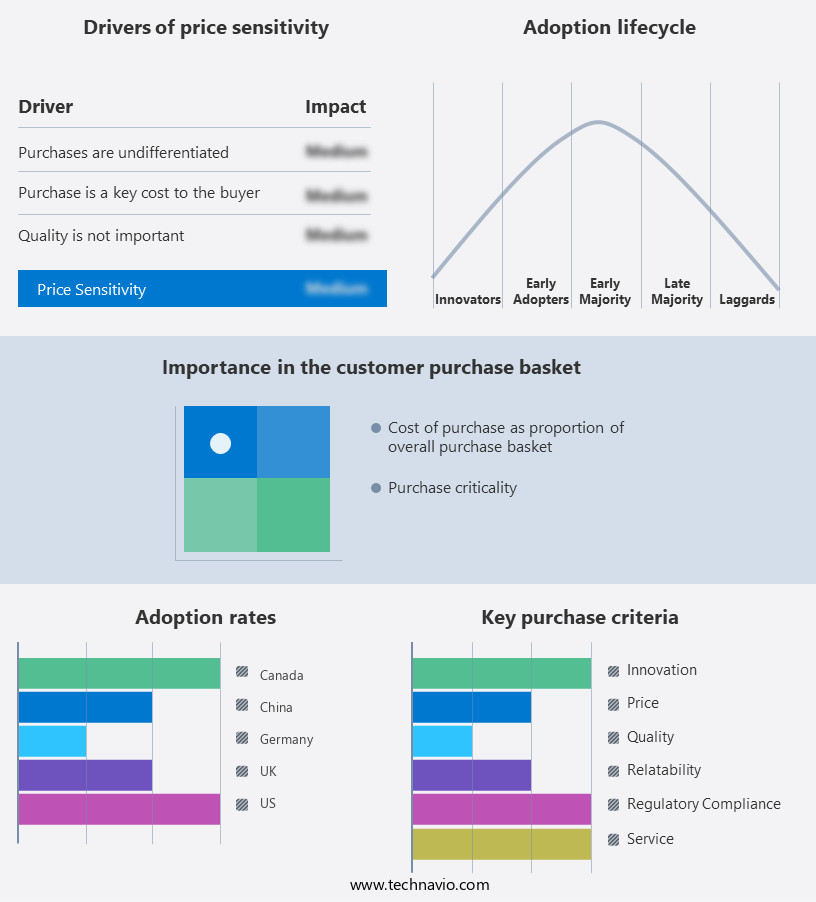
The decking market forecasting report includes the adoption lifecycle of the market, covering from the innovator's stage to the laggard's stage. It focuses on adoption rates in different regions based on penetration. Furthermore, the decking market report also includes key purchase criteria and drivers of price sensitivity to help companies evaluate and develop their market growth analysis strategies.
Customer Landscape
Key Companies & Market Insights
Companies are implementing various strategies, such as strategic alliances, decking market forecast, partnerships, mergers and acquisitions, geographical expansion, and product/service launches, to enhance their presence in the industry.
Advantage Trim and Lumber Co. - This company specializes in the production and distribution of high-quality hardwood decking, custom hardwood lumber, domestic and exotic wood flooring, and custom mouldings for various industries. Their product range caters to diverse design needs, showcasing a commitment to delivering superior craftsmanship and sustainability.
The industry research and growth report includes detailed analyses of the competitive landscape of the market and information about key companies, including:
- Advantage Trim and Lumber Co.
- Alfresco Floors
- BARRETTE OUTDOOR LIVING Inc.
- Beologic N.V.
- CRH Plc
- Fiberon
- Fortune Brands Innovations Inc.
- Hardy Smith Designs Pvt. Ltd.
- Humboldt Redwood Co. LLC
- James Latham PLC
- JSW Holdings Ltd.
- METSA GROUP
- NewTechWood America Inc.
- Saraswati Wood Pvt. Ltd
- The AZEK Co. Inc.
- Timber Holdings USA
- Trex Co. Inc.
- UFP Industries Inc.
- UPM Kymmene Corp.
- VETEDY GROUP
- West Fraser Timber Co. Ltd.
- Xylos Arteriors India Pvt Ltd
Qualitative and quantitative analysis of companies has been conducted to help clients understand the wider business environment as well as the strengths and weaknesses of key industry players. Data is qualitatively analyzed to categorize companies as pure play, category-focused, industry-focused, and diversified; it is quantitatively analyzed to categorize companies as dominant, leading, strong, tentative, and weak.
Recent Development and News in Decking Market
- In January 2024, Trex Company, a leading manufacturer of high-performance, low-maintenance outdoor living products, announced the launch of its new Enhance Composite Decking line, featuring enhanced durability and improved texture (Trex Company Press Release, 2024).
- In March 2024, Fiberon, a global composite decking and railing manufacturer, entered into a strategic partnership with Home Depot, the world's largest home improvement retailer, to expand its distribution network and increase market share (Home Depot Investor Relations, 2024).
- In May 2025, Advanced Environmental Recycling Technologies (AERT), a leading recycling technology company, completed the acquisition of TimberTech, a major composite decking manufacturer, to expand its recycling capabilities and enter the market (AERT Press Release, 2025).
- In the same month, the European Union passed new regulations on plastic decking, requiring all composite decking boards to contain a minimum of 50% recycled content by 2027, driving innovation and investment in sustainable decking solutions (European Parliament and Council of the European Union, 2025).
Research Analyst Overview
- The market is experiencing continuous innovation driven by evolving requirements in decking substructure design, decking sustainability rating, and compliance with updated deck building codes and decking accessibility standards. Advances in the decking manufacturing process have led to lighter decking material weight, enhanced decking structural integrity, and improved decking environmental impact. Focus on durability and performance is boosting the use of deck maintenance products, optimized deck maintenance schedule, and periodic deck safety inspections. Attention to aesthetics and function is also increasing demand for options like decking edge profile, diverse decking color options, and efficient decking board installation techniques.
- Market dynamics further reflect rising awareness around termite resistant decking, slip resistant decking, and water resistant decking, alongside innovations in deck safety features, proper load bearing capacity, and obtaining a deck construction permit. Additionally, practices like decking repair techniques, valid decking warranty information, and sustainable decking material recycling are influencing adoption trends and shaping long-term decisions. The market's projected expansion is supported by a 6.8% expected growth rate, with a documented 13% increase in demand for composite decking material in the past year alone.
Dive into Technavio's robust research methodology, blending expert interviews, extensive data synthesis, and validated models for unparalleled Decking Market insights. See full methodology.
|
Market Scope |
|
|
Report Coverage |
Details |
|
Page number |
219 |
|
Base year |
2024 |
|
Historic period |
2019-2023 |
|
Forecast period |
2025-2029 |
|
Growth momentum & CAGR |
Accelerate at a CAGR of 6.8% |
|
Market growth 2025-2029 |
USD 6897.7 million |
|
Market structure |
Fragmented |
|
YoY growth 2024-2025(%) |
5.8 |
|
Key countries |
US, UK, China, Germany, Japan, France, Canada, India, Italy, and South Korea |
|
Competitive landscape |
Leading Companies, Market Positioning of Companies, Competitive Strategies, and Industry Risks |
What are the Key Data Covered in this Decking Market Research and Growth Report?
- CAGR of the Decking industry during the forecast period
- Detailed information on factors that will drive the growth and forecasting between 2025 and 2029
- Precise estimation of the size of the market and its contribution of the industry in focus to the parent market
- Accurate predictions about upcoming growth and trends and changes in consumer behaviour
- Growth of the market across North America, Europe, APAC, South America, and Middle East and Africa
- Thorough analysis of the market's competitive landscape and detailed information about companies
- Comprehensive analysis of factors that will challenge the decking market growth of industry companies
We can help! Our analysts can customize this decking market research report to meet your requirements.