Delivery Management Software Market Size 2024-2028
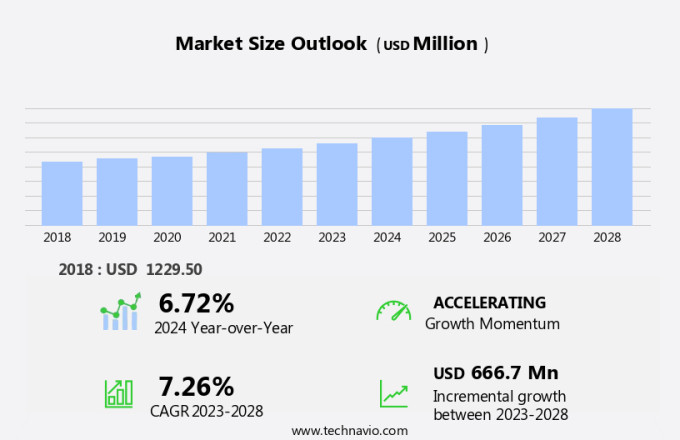
The delivery management software market size is forecast to increase by USD 666.7 billion at a CAGR of 7.26% between 2023 and 2028.
- The market is experiencing significant growth due to several key trends. The increasing prevalence of e-commerce is driving the need for efficient and effective delivery management systems. Additionally, the incorporation of predictive analytics for strategic planning is becoming increasingly important for businesses to optimize their operations and improve customer satisfaction. However, the high implementation and maintenance costs of delivery management software remain a challenge for smaller businesses and organizations. To stay competitive in today's market, it is crucial for businesses to carefully consider the benefits and costs of implementing a delivery management system. By doing so, they can streamline their operations, reduce delivery times, and enhance their overall customer experience.
What will be the Size of the Delivery Management Software Market During the Forecast Period?
- The market is experiencing significant growth due to the increasing demand for efficient logistics solutions in various industries, including large enterprises, restaurants, and courier businesses. Automation and cloud technology are driving this market, with both on-premises and Software-as-a-Service (SaaS) solutions available to cater to enterprise sizes. Cloud computing and advanced technologies such as AI and machine learning are revolutionizing delivery management, enabling real-time tracking, route optimization, and proof of delivery. These avant-garde technologies improve communication capabilities, ensuring seamless coordination between delivery personnel and customers. In the ecommerce industry, the growing popularity of on-demand delivery services and e-commerce platforms necessitates the adoption of advanced software solutions to streamline the last-mile delivery process.
- Courier and postal services also benefit from these innovations, enhancing their operational efficiency and customer experience. Software developers continue to innovate, offering both on-premise and SaaS-based delivery management solutions to cater to the diverse needs of businesses. These solutions enable real-time tracking, communication, and optimization, ensuring that goods reach their destinations on time and in optimal condition.
How is this Delivery Management Software Industry segmented and which is the largest segment?
The delivery management software industry research report provides comprehensive data (region-wise segment analysis), with forecasts and estimates in "USD million" for the period 2024-2028, as well as historical data from 2018-2022 for the following segments.
- Deployment
- Cloud
- On-premises
- End-user
- Logistics
- Retail and e-commerce
- Food and beverages
- Healthcare
- Manufacturing
- Geography
- APAC
- China
- India
- Japan
- North America
- US
- Europe
- Germany
- France
- Middle East and Africa
- South America
- APAC
By Deployment Insights
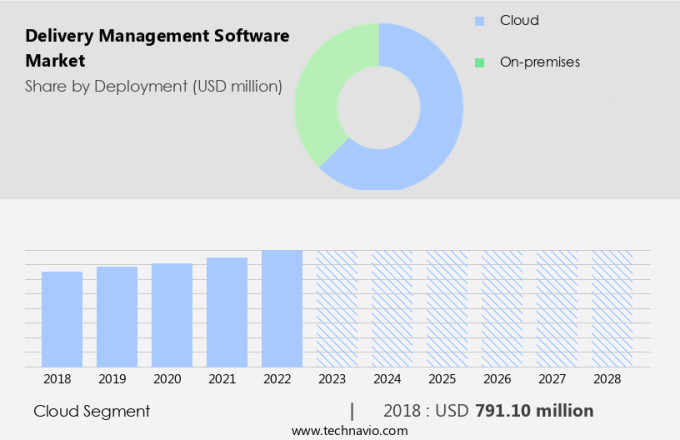
- The cloud segment is estimated to witness significant growth during the forecast period.
In the global delivery management market, cloud-based solutions are gaining popularity due to their flexibility, scalability, and cost-effectiveness. These solutions enable businesses to manage their delivery operations efficiently from anywhere, enhancing customer satisfaction. Cloud technology offers seamless integration with other systems, real-time tracking, and automated processes, which are essential for handling large volumes of deliveries, particularly in the e-commerce and logistics industries. The flexibility to update and scale without significant infrastructure investment makes cloud deployment an attractive option for businesses of all sizes. Key providers of cloud-based delivery management software include LogiNext Solutions and Onfleet Inc., offering features such as last-mile delivery support, real-time tracking, and integration with multiple delivery partners.
Cloud solutions also facilitate paperless operations, real-time communication capabilities, and proof of delivery confirmation, enhancing the overall customer experience. The market caters to various sectors, including courier businesses, restaurant delivery, and last-mile delivery services, with advanced technologies like AI and machine learning enabling route optimization and on-demand delivery services. The SaaS model and CRM integration further streamline operations, making it an indispensable tool for logistics firms and e-commerce platforms.
Get a glance at the Delivery Management Software Industry report of share of various segments Request Free Sample
The Cloud segment was valued at USD 791.10 billion in 2018 and showed a gradual increase during the forecast period.
Regional Analysis
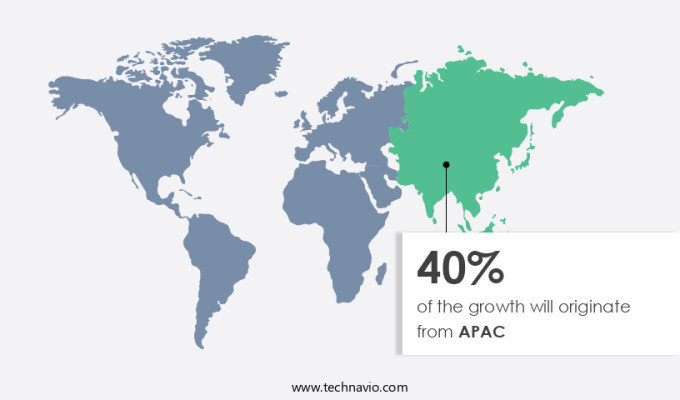
- APAC is estimated to contribute 40% to the growth of the global market during the forecast period.
Technavio's analysts have elaborately explained the regional trends and drivers that shape the market during the forecast period.
For more insights on the market share of various regions, Request Free Sample
In the Asia-Pacific (APAC) market, the delivery management software sector is witnessing substantial growth due to urbanization, expanding e-commerce activities, and escalating consumer demand for swift and reliable deliveries. The proliferation of e-commerce platforms, fueled by rising internet penetration and smartphone usage, is a primary growth driver. For instance, APAC recorded approximately 1.29 billion mobile internet subscribers in 2022, representing a substantial increase from 2015 when there were around 700 million mobile internet users in the region. The logistics and supply chain sectors' expansion in countries like China, India, and Japan is further propelling the adoption of delivery management software.
This software enables logistics firms and self-service portals to optimize routes, provide real-time tracking, facilitate proof of delivery, and enhance communication capabilities. Cloud technology, SaaS models, and AI/machine learning are avante-garde technologies increasingly integrated into these solutions. The e-commerce industry and on-demand delivery services are significant end-users, while courier businesses and food delivery services also benefit from these advanced software solutions.
Market Dynamics
Our delivery management software market researchers analyzed the data with 2023 as the base year, along with the key drivers, trends, and challenges. A holistic analysis of drivers will help companies refine their marketing strategies to gain a competitive advantage.
What are the key market drivers leading to the rise in the adoption of Delivery Management Software Industry?
- Increasing prevalence of e-commerce is the key driver of the market.
Delivery management software plays a pivotal role in streamlining logistics processes for various industries, including courier businesses, restaurant delivery services, and e-commerce. Automation through cloud technology and cloud computing enables real-time tracking, proof of delivery, and communication capabilities, enhancing the customer experience. SaaS-based solutions offer self-service portals, route optimization, and paperless operations, making it easier for businesses to manage their operations. In the e-commerce industry, on-demand delivery services have gained significant traction, necessitating advanced software solutions. Avant-garde technologies like AI and machine learning facilitate efficient last-mile delivery, route optimization, and CRM integration. Logistics firms and e-commerce platforms benefit from these solutions, ensuring seamless communication and improving overall efficiency.
Further, cloud solutions offer scalability and flexibility, catering to enterprise sizes ranging from small to large corporations. The integration of AI and IoT in delivery management software further enhances its capabilities, providing real-time data analysis and predictive analytics, enabling proactive decision-making. Technology continues to revolutionize the delivery landscape, with SaaS models and online shopping driving the demand for advanced software solutions. Thus, such factors are driving the growth of the market during the forecast period.
What are the market trends shaping the Delivery Management Software Industry?
- Incorporation of predictive analytics for strategic planning is the upcoming market trend.
The incorporation of predictive analytics for strategic planning is the key trend in the market. Delivery management software plays a pivotal role in streamlining logistics operations for various industries, including courier businesses, restaurant delivery services, and e-commerce enterprises. The market encompasses both cloud-based and on-premises solutions, catering to businesses of all sizes, from small startups to large corporations. Cloud technology and SaaS models have gained significant traction due to their flexibility and affordability. Key features of delivery management software include route optimization, real-time tracking, proof of delivery, communication capabilities, and self-service portals. These solutions leverage avante-garde technologies such as AI and machine learning to optimize last-mile delivery and enhance the customer experience. In the e-commerce industry, these software solutions are integral to on-demand delivery services and e-commerce platforms.
Moreover, logistics firms and software developers are continuously innovating to integrate advanced technologies like AI and IoT for paperless operations and efficient communication. Cloud computing and SaaS-based delivery management software enable real-time data access, ensuring seamless coordination between various stakeholders. These solutions are particularly beneficial for large enterprises, enabling them to manage complex logistics operations more effectively. Courier and postal services, food delivery, and last-mile delivery services all stand to gain from the implementation of these advanced software solutions. Ultimately, the goal is to provide a superior customer experience, ensuring timely and accurate delivery while minimizing operational costs. Thus, such trends will shape the growth of the market during the forecast period.
What challenges does the Delivery Management Software Industry face during its growth?
- High implementation and maintenance costs of delivery management software is a key challenge affecting the industry growth.
High implementation and maintenance costs of delivery management software is the major challenge that affects the growth of the market. Delivery management software plays a pivotal role in streamlining logistics operations for various industries, including courier businesses, restaurant delivery services, and e-commerce. This software leverages automation through cloud technology and SaaS models to optimize last-mile delivery, route planning, and real-time tracking. Large enterprises, especially in the eCommerce industry, benefit significantly from advanced features like self-service portals, proof of delivery, communication capabilities, and AI-driven route optimization. Cloud computing and cloud technology enable paperless operations, reducing manual work and increasing efficiency. Avant-garde technologies such as AI and machine learning enhance the software's capabilities, providing predictive analytics and automating repetitive tasks. On-premises and SaaS-Based solutions cater to businesses of all sizes, offering customizable features for enterprise-level logistics firms and on-demand delivery services.
However, the software solutions improve customer experience by providing seamless integration with e-commerce platforms and real-time updates on order status. Technology advancements in the market include advanced CRM, last-mile delivery services, and IoT integration, making it an essential tool for businesses aiming to stay competitive in the eCommerce landscape. Software developers and logistics firms continue to innovate, ensuring the software remains an indispensable asset for online shopping and food delivery businesses. Hence, the above factors will impede the growth of the market during the forecast period
Exclusive Customer Landscape
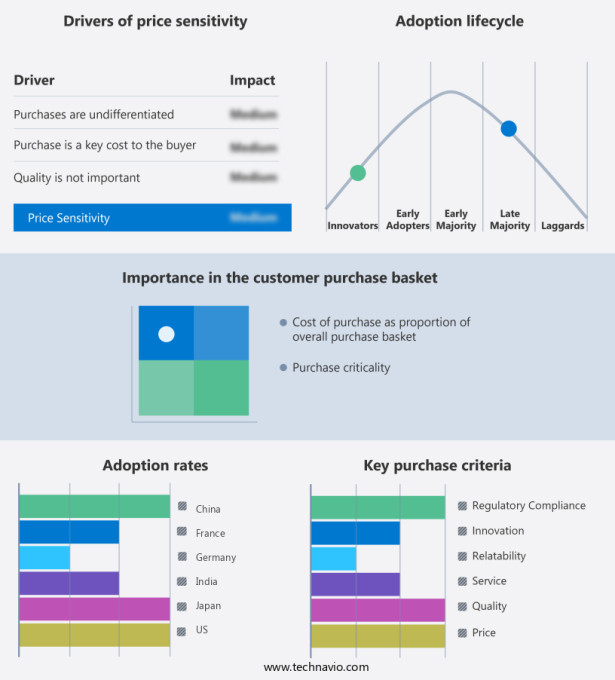
The delivery management software market forecasting report includes the adoption lifecycle of the market, covering from the innovator's stage to the laggard's stage. It focuses on adoption rates in different regions based on penetration. Furthermore, the delivery management software market report also includes key purchase criteria and drivers of price sensitivity to help companies evaluate and develop their market growth analysis strategies.
Customer Landscape
Key Companies & Market Insights
Companies are implementing various strategies, such as strategic alliances, delivery management software market forecast, partnerships, mergers and acquisitions, geographical expansion, and product/service launches, to enhance their presence in the industry.
Bringg - Our company specializes in Delivery Management Software solutions, encompassing Advanced Driver Management and Floating Inventory systems. These tools streamline operations for businesses, ensuring efficient dispatching, real-time tracking, and optimized inventory utilization. By leveraging our technology, organizations can enhance their logistics capabilities, improve customer satisfaction, and boost overall productivity.
The industry research and growth report includes detailed analyses of the competitive landscape of the market and information about key companies, including:
- Bringg
- Deliforce Technologies Private Ltd.
- Descartes Systems Group Inc.
- Detrack
- FarEye Technologies Inc.
- GetSwift Ltd
- Honeywell International Inc.
- JungleWorks
- LogiNext Solutions
- Mobisoft Infotech LLC
- Onfleet Inc.
- Oracle Corp.
- Safetyculture
- SAP SE
- Shipox Inc.
- Track POD
- WorkWave LLC
- Zebra Technologies Corp.
- ZETES Industries SA
- Zippykind
Qualitative and quantitative analysis of companies has been conducted to help clients understand the wider business environment as well as the strengths and weaknesses of key industry players. Data is qualitatively analyzed to categorize companies as pure play, category-focused, industry-focused, and diversified; it is quantitatively analyzed to categorize companies as dominant, leading, strong, tentative, and weak.
Research Analyst Overview
Delivery management software has become an indispensable tool for businesses aiming to streamline their logistics operations and enhance customer experience in today's e-commerce-driven market. The market for delivery management software is witnessing significant growth due to the increasing demand for automation and real-time tracking in various industries, including restaurants, courier businesses, and large enterprises. Cloud technology and on-demand delivery services have revolutionized the way businesses manage their delivery processes. Cloud-based solutions offer numerous advantages, such as scalability, flexibility, and cost savings. On the other hand, on-premises systems cater to businesses that require more control over their data and operations.
The market caters to businesses of all sizes, from small courier companies to large logistics firms. The software solutions enable real-time tracking, proof of delivery, and communication capabilities, ensuring efficient and reliable delivery services. Self-service portals allow businesses to manage their operations with ease, while CRM integration facilitates customer relationship management. The e-commerce industry has been a significant driver of growth in the market. E-commerce platforms have made it easier than ever for businesses to reach a global customer base, leading to an increase in the volume of deliveries. This, in turn, has put pressure on businesses to optimize their delivery processes to meet customer expectations.
Avant-garde technologies such as AI and machine learning are being integrated into delivery management software to improve route optimization, paperless operations, and customer experience. Last-mile delivery services, which are critical in ensuring timely and accurate delivery, are also benefiting from these advanced technologies. The market is highly competitive, with numerous software developers offering solutions tailored to different industries and business needs. Logistics firms and e-commerce businesses are increasingly adopting SAAS (Software as a Service) models, which offer cost savings and ease of implementation. The integration of AI and IoT (Internet of Things) technologies in delivery management software is expected to bring about significant advancements in the near future.
These technologies will enable real-time monitoring of delivery vehicles, predictive maintenance, and automated dispatching, among other benefits. In conclusion, the market is a dynamic and evolving landscape, driven by the growing demand for automation, real-time tracking, and improved customer experience in various industries. The integration of advanced technologies such as AI, machine learning, and IoT is expected to further revolutionize the market and offer numerous benefits to businesses.
|
Delivery Management Software Market Scope |
|
|
Report Coverage |
Details |
|
Page number |
203 |
|
Base year |
2023 |
|
Historic period |
2018-2022 |
|
Forecast period |
2024-2028 |
|
Growth momentum & CAGR |
Accelerate at a CAGR of 7.26% |
|
Market growth 2024-2028 |
USD 666.7 million |
|
Market structure |
Fragmented |
|
YoY growth 2023-2024(%) |
6.72 |
|
Key countries |
China, US, Germany, France, India, and Japan |
|
Competitive landscape |
Leading Companies, Market Positioning of Companies, Competitive Strategies, and Industry Risks |
What are the Key Data Covered in this Delivery Management Software Market Research and Growth Report?
- CAGR of the Delivery Management Software industry during the forecast period
- Detailed information on factors that will drive the Delivery Management Software growth and forecasting between 2024 and 2028
- Precise estimation of the size of the market and its contribution of the industry in focus to the parent market
- Accurate predictions about upcoming growth and trends and changes in consumer behaviour
- Growth of the market across APAC, North America, Europe, Middle East and Africa, and South America
- Thorough analysis of the market's competitive landscape and detailed information about companies
- Comprehensive analysis of factors that will challenge the delivery management software market growth of industry companies
We can help! Our analysts can customize this delivery management software market research report to meet your requirements.


