Digital Signage Market Analysis, Size, and Forecast 2026-2030: North America (US, Canada, and Mexico), APAC (China, Japan, and India), Europe (Germany, UK, and France), South America (Brazil, Argentina, and Colombia), Middle East and Africa (Saudi Arabia, UAE, and South Africa), and Rest of World (ROW)

Digital Signage Market Analysis, Size, and Forecast 2026-2030:
North America (US, Canada, and Mexico), APAC (China, Japan, and India), Europe (Germany, UK, and France), South America (Brazil, Argentina, and Colombia), Middle East and Africa (Saudi Arabia, UAE, and South Africa), and Rest of World (ROW)

Published: Mar 2026 310 Pages SKU: IRTNTR40503

Market Overview at a Glance

$12.43 B
Market Opportunity
10.5%
CAGR 2025 - 2030
37.6%
APAC Growth
$4.75 B
Retail segment 2024

Digital Signage Market Size 2026-2030

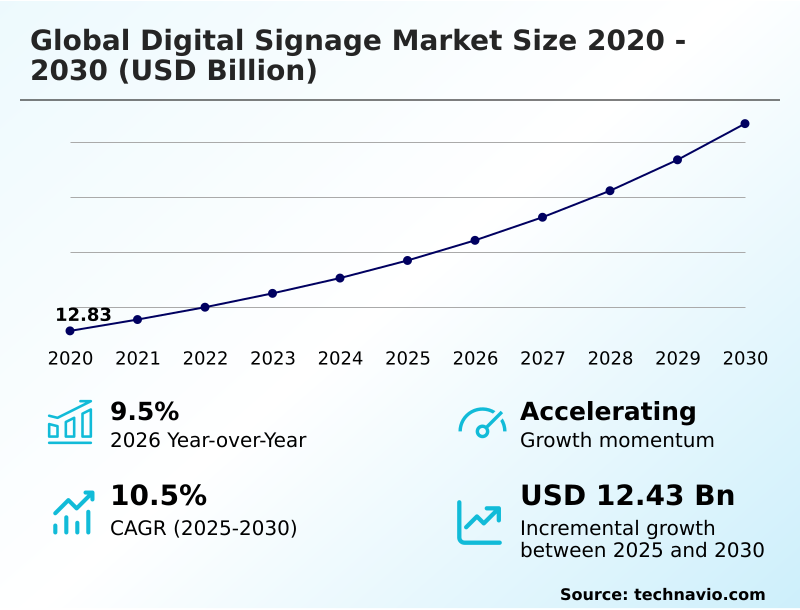
The digital signage market size is valued to increase by USD 12.43 billion, at a CAGR of 10.5% from 2025 to 2030. High growth of retail space will drive the digital signage market.

Major Market Trends & Insights

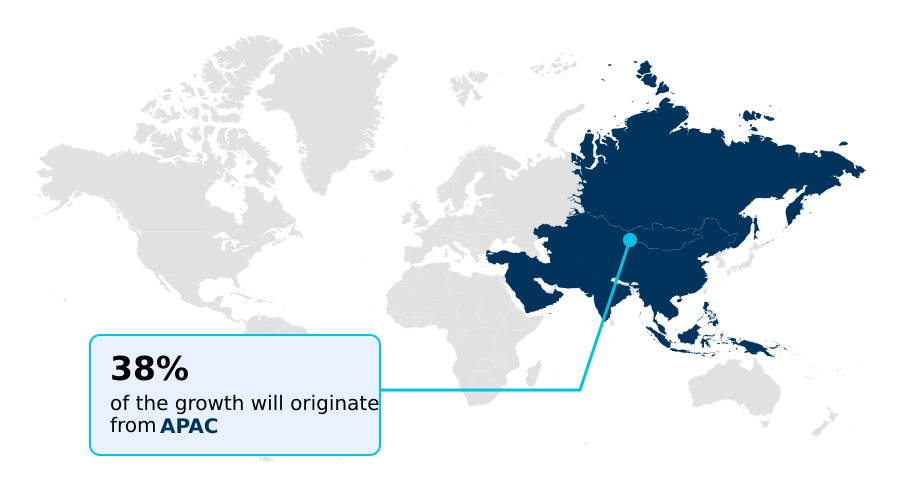
  • APAC dominated the market and accounted for a 37.6% growth during the forecast period.
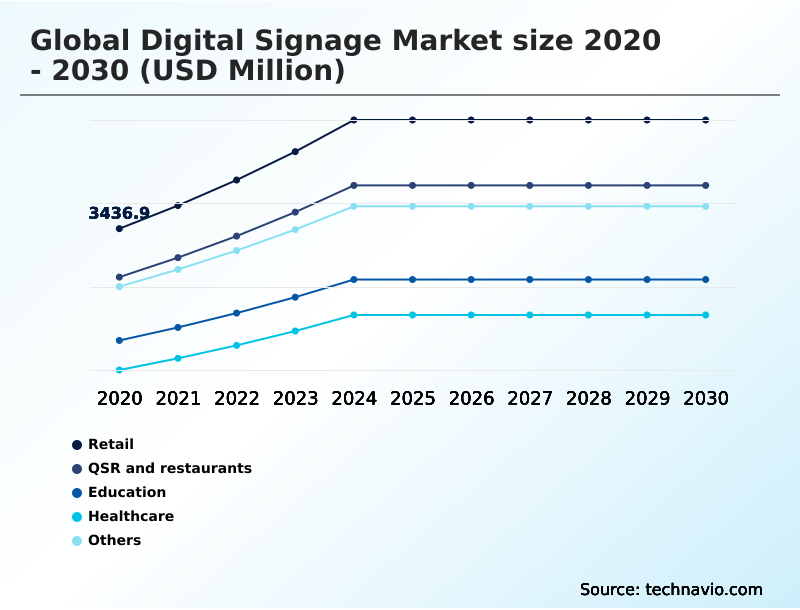
  • By Application - Retail segment was valued at USD 4.75 billion in 2024
  • By Component - Hardware segment accounted for the largest market revenue share in 2024

Market Size & Forecast

  • Market Opportunities: USD 18.84 billion
  • Market Future Opportunities: USD 12.43 billion
  • CAGR from 2025 to 2030 : 10.5%

Market Summary

  • The digital signage market is undergoing a significant transformation, moving beyond passive information displays to become an integral component of modern communication strategies. This evolution is driven by advancements in display hardware and the increasing sophistication of software platforms. Organizations across retail, transportation, and corporate sectors are leveraging this technology to enhance customer engagement, streamline operations, and deliver targeted messaging.
  • A key aspect of this shift is the integration of data analytics, which allows for the measurement of content effectiveness and provides insights into audience behavior. For instance, a retail chain can analyze viewer data from in-store displays to optimize promotional content, leading to improved sales conversion without collecting personal information.
  • This capability transforms signage from a simple capital expense into a strategic tool for data-driven decision-making. However, the need for compelling and continuously updated content presents an ongoing operational challenge, requiring dedicated resources for creative development and management to maintain viewer interest and maximize return on investment.

What will be the Size of the Digital Signage Market during the forecast period?

Get Key Insights on Market Forecast (PDF) Request Free Sample

How is the Digital Signage Market Segmented?

The digital signage industry research report provides comprehensive data (region-wise segment analysis), with forecasts and estimates in "USD million" for the period 2026-2030, as well as historical data from 2020-2024 for the following segments.

  • Application
    • Retail
    • QSR and restaurants
    • Education
    • Healthcare
    • Others
  • Component
    • Hardware
    • Software
    • Services
  • Technology
    • LCD or LED
    • Projection
    • OLED
  • Geography
    • North America
      • US
      • Canada
      • Mexico
    • APAC
      • China
      • Japan
      • India
    • Europe
      • Germany
      • UK
      • France
    • South America
      • Brazil
      • Argentina
      • Colombia
    • Middle East and Africa
      • Saudi Arabia
      • UAE
      • South Africa
    • Rest of World (ROW)

By Application Insights

The retail segment is estimated to witness significant growth during the forecast period.

The retail segment is rapidly evolving into sophisticated phygital retail environments, where digital displays are pivotal for omnichannel retail integration. Beyond simple advertising, retailers deploy high-brightness displays and interactive kiosks to enable dynamic pricing displays and offer interactive product catalogs.

These systems facilitate experiential marketing installations and data-driven personalization through in-store analytics, supporting virtual try-on experiences and personalized marketing campaigns. The use of digital menu boards in associated food service spaces further enhances operational efficiency.

This shift towards immersive digital touchpoints is driven by the need to elevate customer engagement, with centralized content distribution ensuring consistent brand messaging across all locations, improving customer journey mapping by over 25%.

Request Free Sample

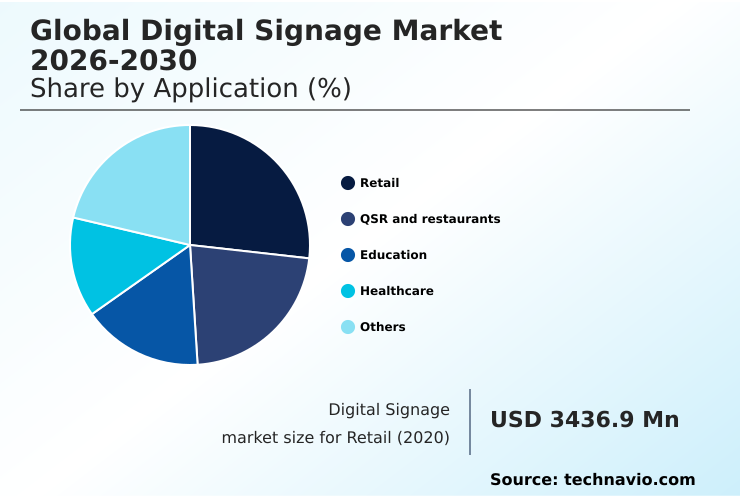
The Retail segment was valued at USD 4.75 billion in 2024 and showed a gradual increase during the forecast period.

Request Free Sample

Regional Analysis

APAC is estimated to contribute 37.6% to the growth of the global market during the forecast period.Technavio’s analysts have elaborately explained the regional trends and drivers that shape the market during the forecast period.

See How Digital Signage Market Demand is Rising in APAC Request Free Sample

The geographic landscape of the market is characterized by mature, high-adoption regions and rapidly emerging growth centers. North America, a substantial market, focuses on upgrading existing infrastructure with 4K UHD displays and complex architectural media facades.

Meanwhile, the APAC region is the fastest-growing area, accounting for over 37% of the market's incremental growth, driven by new infrastructure projects and the adoption of ai-driven content delivery and networked display solutions.

Europe emphasizes regulatory compliance and sustainability, with a focus on energy-efficient systems and geofenced content delivery for targeted messaging. Across all regions, the adoption of cloud-based content management is unifying operations.

Advanced applications like projection mapping using ultra short throw lenses and the deployment of multi-zone screen layouts on 8k resolution displays are becoming more common in landmark projects globally.
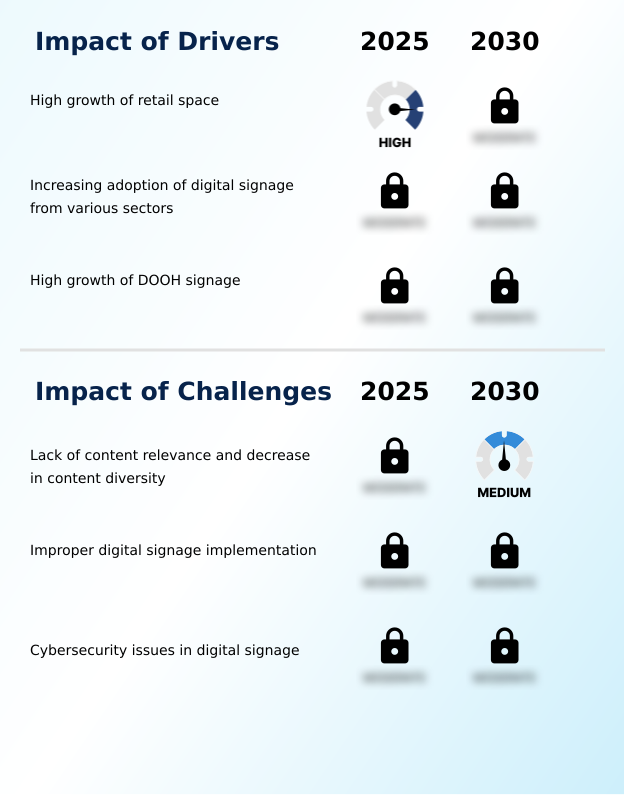
Market Dynamics

Our researchers analyzed the data with 2025 as the base year, along with the key drivers, trends, and challenges. A holistic analysis of drivers will help companies refine their marketing strategies to gain a competitive advantage.

  • Navigating the complexities of the digital signage market requires a deep understanding of specific use cases and technological trade-offs. The debate over soc vs external media player performance, for example, is central to deployment strategy, with integrated systems offering simplicity while external units provide greater processing power for demanding applications.
  • The benefits of cloud-based cms for retail chains are clear, enabling seamless updates across hundreds of locations. However, this connectivity introduces cybersecurity best practices for networked signage as a critical consideration. In vertical-specific applications, the roi of interactive kiosks in healthcare settings is measured by improved patient flow and reduced administrative burden.
  • Similarly, implementing dynamic pricing on digital menu boards helps restaurants optimize revenue. The challenges of outdoor led display installation involve weatherproofing and ensuring visibility in bright ambient light.
  • As the industry evolves, using ai for personalized in-store advertising is becoming more prevalent, though it must align with compliance with gdpr for personalized advertising, especially when using facial recognition for audience analytics.
  • This move toward intelligent, integrated systems is creating value in areas like reducing perceived wait times with queue management, with some systems showing a 30% improvement in customer satisfaction scores.

What are the key market drivers leading to the rise in the adoption of Digital Signage Industry?

  • The high growth of retail space globally is a key driver for the digital signage market, fueling demand for dynamic in-store communication and customer engagement tools.

  • Market growth is significantly driven by expanding applications across various sectors and the increasing adoption of programmatic dooh advertising.
  • In public and commercial spaces, there is a strong demand for outdoor led solutions and interactive wayfinding systems to manage traffic and enhance visitor experiences.
  • The deployment of fine pitch led and direct view led (dvled) technologies in corporate communication networks and smart city information portals is becoming more widespread.
  • In sectors like healthcare and hospitality, digital door signs and digital concierge services are improving operational efficiency and patient information systems. For instance, facilities using integrated queue management systems have reported a 25% reduction in perceived wait times.
  • The ability to push emergency alert integration across networked displays has also become a critical driver for adoption in public venues, ensuring rapid communication during critical events.

What are the market trends shaping the Digital Signage Industry?

  • The introduction of System on a Chip (SoC) technology is an emerging trend, streamlining digital signage solutions. This integration reduces hardware complexity and the total cost of ownership for deployments.

  • Key market trends are centered on technological innovation that enhances visual impact and simplifies deployment. The introduction of system on a chip (soc) technology and the adoption of software as a service (saas) models are reducing total cost of ownership, with some integrated platforms lowering maintenance calls by 15%.
  • Innovations in display hardware, such as transparent oled, quantum dot led (qled), and flexible epaper displays, are enabling more creative installations. These systems increasingly feature gesture control interfaces and support augmented reality overlays, creating more interactive user experiences. The use of multi-screen synchronization to create seamless video walls is becoming standard for high-impact applications.
  • Furthermore, the ability to integrate with external systems via api for third-party integration allows for dynamic content triggering based on real-time data, boosting content relevance by over 30%.

What challenges does the Digital Signage Industry face during its growth?

  • A lack of content relevance and decreasing diversity poses a key challenge to industry growth, diminishing audience engagement and the overall effectiveness of digital displays.

  • Key challenges in the market revolve around content management, security, and operational oversight. The effectiveness of a deployment is highly dependent on a robust content management system (cms) that supports context-aware content and real-time data integration.
  • Without sophisticated remote device management and player health monitoring, maintaining network uptime becomes a significant operational burden, with network failures causing a 10% loss in potential advertising revenue for some operators. As systems become more connected, cybersecurity is a growing concern, necessitating stringent user access control levels and secure content approval workflows.
  • Bandwidth management tools are also crucial for ensuring smooth content delivery, especially when distributing high-resolution files to numerous external media players and video wall controllers. Ensuring accurate proof-of-play reporting for advertisers adds another layer of complexity.

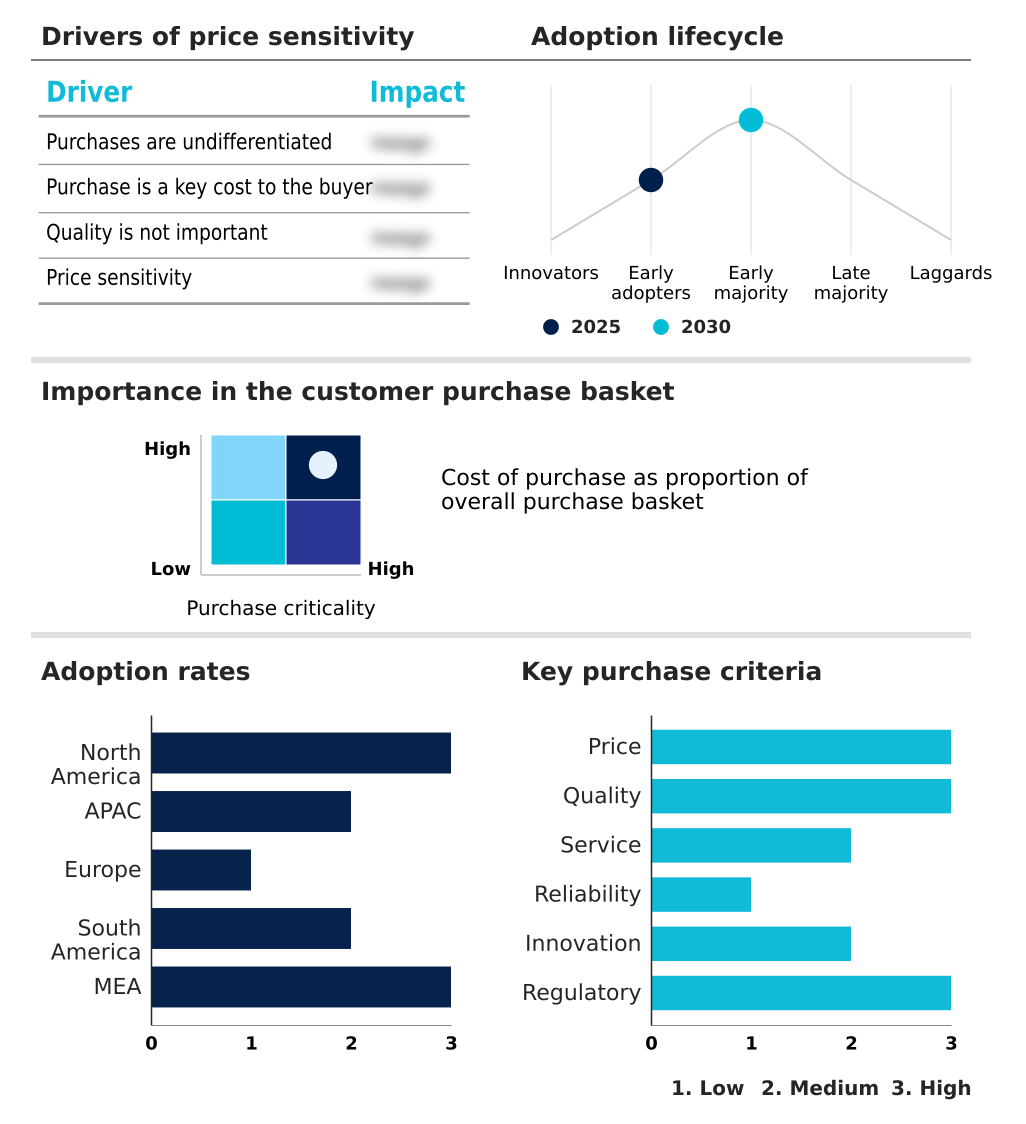
Exclusive Technavio Analysis on Customer Landscape

The digital signage market forecasting report includes the adoption lifecycle of the market, covering from the innovator’s stage to the laggard’s stage. It focuses on adoption rates in different regions based on penetration. Furthermore, the digital signage market report also includes key purchase criteria and drivers of price sensitivity to help companies evaluate and develop their market growth analysis strategies.

Customer Landscape of Digital Signage Industry

Competitive Landscape

Companies are implementing various strategies, such as strategic alliances, digital signage market forecast, partnerships, mergers and acquisitions, geographical expansion, and product/service launches, to enhance their presence in the industry.

Acer Inc. - Provides advanced 4K UHD displays and ultra-bright screens for high-performance indoor and outdoor commercial applications, addressing a wide range of commercial visualization needs.

The industry research and growth report includes detailed analyses of the competitive landscape of the market and information about key companies, including:

  • Acer Inc.
  • ASUSTeK Computer Inc.
  • AUO Corp.
  • Barco NV
  • Christie Digital Systems Inc
  • Dell Technologies Inc.
  • Elo Touch Solutions Inc.
  • HP Inc.
  • Koninklijke Philips NV
  • Leyard International
  • LG Electronics Inc.
  • Mitsubishi Electric Corp.
  • NEC Corp.
  • Panasonic Holdings Corp.
  • Planar Systems Inc.
  • Samsung Electronics Co. Ltd.
  • Sharp Corp.
  • Sony Group Corp.
  • Toshiba Corp.
  • ViewSonic Corp.

Qualitative and quantitative analysis of companies has been conducted to help clients understand the wider business environment as well as the strengths and weaknesses of key industry players. Data is qualitatively analyzed to categorize companies as pure play, category-focused, industry-focused, and diversified; it is quantitatively analyzed to categorize companies as dominant, leading, strong, tentative, and weak.

Recent Development and News in Digital signage market

  • In November 2024, Advantech launched the DS-380, a system designed to bring advanced AI vision to outdoor DOOH displays, enhancing image processing and operational reliability for demanding environments.
  • In January 2025, DynaScan announced the introduction of a new range of indoor and outdoor ePaper displays, including a 75-inch outdoor color display powered by E Ink Kaleido 3 technology for energy-efficient signage.
  • In February 2025, Samsung officially introduced its Color E-Paper (EMDX) series, a new energy-efficient digital signage lineup featuring ultra-low power consumption and remote management capabilities via a dedicated mobile application.
  • In March 2025, Standard AI launched an improved version of its VISION computer vision platform, offering enhanced real-time audience analytics and clearer detection accuracy for the Digital Out-of-Home advertising market.

Dive into Technavio’s robust research methodology, blending expert interviews, extensive data synthesis, and validated models for unparalleled Digital Signage Market insights. See full methodology.

Market Scope
Page number 310
Base year 2025
Historic period 2020-2024
Forecast period 2026-2030
Growth momentum & CAGR Accelerate at a CAGR of 10.5%
Market growth 2026-2030 USD 12434.2 million
Market structure Fragmented
YoY growth 2025-2026(%) 9.5%
Key countries US, Canada, Mexico, China, Japan, India, South Korea, Indonesia, Australia, Germany, UK, France, Italy, Spain, The Netherlands, Brazil, Argentina, Colombia, Saudi Arabia, UAE, South Africa, Egypt and Nigeria
Competitive landscape Leading Companies, Market Positioning of Companies, Competitive Strategies, and Industry Risks

Request Free Sample

Research Analyst Overview

  • The digital signage market's evolution from a hardware-centric industry to an integrated ecosystem powered by software and data marks a fundamental shift in its value proposition. The proliferation of system on a chip (soc) displays, fine pitch led, and transparent oled technologies provides a versatile canvas, but the true differentiator lies in the intelligence behind the screen.
  • The integration of audience analytics and ai-driven content delivery is transforming displays into strategic assets capable of data-driven personalization. This pivot has significant boardroom implications, particularly for budgeting and performance measurement.
  • For instance, the ability to correlate in-store analytics from interactive kiosks with sales data allows for a clear ROI calculation, shifting the perception of digital signage from a capital expenditure to a measurable marketing investment.
  • As a result, businesses are achieving over a 20% uplift in campaign effectiveness by leveraging context-aware content, fundamentally changing how they allocate resources for physical-space communication and omnichannel retail integration.

What are the Key Data Covered in this Digital Signage Market Research and Growth Report?

  • What is the expected growth of the Digital Signage Market between 2026 and 2030?

    • USD 12.43 billion, at a CAGR of 10.5%

  • What segmentation does the market report cover?

    • The report is segmented by Application (Retail, QSR and restaurants, Education, Healthcare, and Others), Component (Hardware, Software, and Services), Technology (LCD or LED, Projection, and OLED) and Geography (North America, APAC, Europe, South America, Middle East and Africa)

  • Which regions are analyzed in the report?

    • North America, APAC, Europe, South America and Middle East and Africa

  • What are the key growth drivers and market challenges?

    • High growth of retail space, Lack of content relevance and decrease in content diversity

  • Who are the major players in the Digital Signage Market?

    • Acer Inc., ASUSTeK Computer Inc., AUO Corp., Barco NV, Christie Digital Systems Inc, Dell Technologies Inc., Elo Touch Solutions Inc., HP Inc., Koninklijke Philips NV, Leyard International, LG Electronics Inc., Mitsubishi Electric Corp., NEC Corp., Panasonic Holdings Corp., Planar Systems Inc., Samsung Electronics Co. Ltd., Sharp Corp., Sony Group Corp., Toshiba Corp. and ViewSonic Corp.

Market Research Insights

  • Market dynamics are increasingly shaped by the adoption of intelligent and connected technologies that enhance operational efficiency and audience engagement. The shift towards software as a service (saas) models for content management is enabling more scalable and cost-effective deployments. For instance, businesses using cloud-based platforms for centralized content distribution report a reduction in campaign deployment times by up to 40%.
  • The integration of AI and IoT sensors allows for dynamic content triggering based on environmental conditions or audience demographics, improving message relevance. This data-driven approach, supported by robust audience measurement metrics, offers a clearer view of campaign performance.
  • Deployments leveraging predictive content scheduling have demonstrated an 18% improvement in engagement rates by aligning promotions with anticipated customer traffic patterns, showcasing a move towards more proactive and effective communication strategies.

We can help! Our analysts can customize this digital signage market research report to meet your requirements.

Get in touch

1. Executive Summary

1.1 Market overview

Executive Summary - Chart on Market Overview
Executive Summary - Data Table on Market Overview
Executive Summary - Chart on Global Market Characteristics
Executive Summary - Chart on Market by Geography
Executive Summary - Chart on Market Segmentation by Application
Executive Summary - Chart on Market Segmentation by Component
Executive Summary - Chart on Market Segmentation by Technology
Executive Summary - Chart on Incremental Growth
Executive Summary - Data Table on Incremental Growth
Executive Summary - Chart on Company Market Positioning

2. Technavio Analysis

2.1 Analysis of price sensitivity, lifecycle, customer purchase basket, adoption rates, and purchase criteria

2.2 Criticality of inputs and Factors of differentiation

Chart on Overview on criticality of inputs and factors of differentiation

2.3 Factors of disruption

Chart on Overview on factors of disruption

2.4 Impact of drivers and challenges

Chart on Impact of drivers and challenges in 2025 and 2030

3. Market Landscape

3.1 Market ecosystem

Chart on Parent Market
Data Table on - Parent Market

3.2 Market characteristics

Chart on Market characteristics analysis

3.3 Value chain analysis

Chart on Value chain analysis

4. Market Sizing

4.1 Market definition

Data Table on Offerings of companies included in the market definition

4.2 Market segment analysis

Market segments

4.3 Market size 2025

4.4 Market outlook: Forecast for 2025-2030

Chart on Global - Market size and forecast 2025-2030 ($ million)
Data Table on Global - Market size and forecast 2025-2030 ($ million)
Chart on Global Market: Year-over-year growth 2025-2030 (%)
Data Table on Global Market: Year-over-year growth 2025-2030 (%)

5. Historic Market Size

5.1 Global Digital Signage Market 2020 - 2024

Historic Market Size - Data Table on Global Digital Signage Market 2020 - 2024 ($ million)

5.2 Application segment analysis 2020 - 2024

Historic Market Size - Application Segment 2020 - 2024 ($ million)

5.3 Component segment analysis 2020 - 2024

Historic Market Size - Component Segment 2020 - 2024 ($ million)

5.4 Technology segment analysis 2020 - 2024

Historic Market Size - Technology Segment 2020 - 2024 ($ million)

5.5 Geography segment analysis 2020 - 2024

Historic Market Size - Geography Segment 2020 - 2024 ($ million)

5.6 Country segment analysis 2020 - 2024

Historic Market Size - Country Segment 2020 - 2024 ($ million)

6. Qualitative Analysis

6.1 The AI impact on Global Digital Signage Market

7. Five Forces Analysis

7.1 Five forces summary

Five forces analysis - Comparison between 2025 and 2030

7.2 Bargaining power of buyers

Bargaining power of buyers - Impact of key factors 2025 and 2030

7.3 Bargaining power of suppliers

Bargaining power of suppliers - Impact of key factors in 2025 and 2030

7.4 Threat of new entrants

Threat of new entrants - Impact of key factors in 2025 and 2030

7.5 Threat of substitutes

Threat of substitutes - Impact of key factors in 2025 and 2030

7.6 Threat of rivalry

Threat of rivalry - Impact of key factors in 2025 and 2030

7.7 Market condition

Chart on Market condition - Five forces 2025 and 2030

8. Market Segmentation by Application

8.1 Market segments

Chart on Application - Market share 2025-2030 (%)
Data Table on Application - Market share 2025-2030 (%)

8.2 Comparison by Application

Chart on Comparison by Application
Data Table on Comparison by Application

8.3 Retail - Market size and forecast 2025-2030

Chart on Retail - Market size and forecast 2025-2030 ($ million)
Data Table on Retail - Market size and forecast 2025-2030 ($ million)
Chart on Retail - Year-over-year growth 2025-2030 (%)
Data Table on Retail - Year-over-year growth 2025-2030 (%)

8.4 QSR and restaurants - Market size and forecast 2025-2030

Chart on QSR and restaurants - Market size and forecast 2025-2030 ($ million)
Data Table on QSR and restaurants - Market size and forecast 2025-2030 ($ million)
Chart on QSR and restaurants - Year-over-year growth 2025-2030 (%)
Data Table on QSR and restaurants - Year-over-year growth 2025-2030 (%)

8.5 Education - Market size and forecast 2025-2030

Chart on Education - Market size and forecast 2025-2030 ($ million)
Data Table on Education - Market size and forecast 2025-2030 ($ million)
Chart on Education - Year-over-year growth 2025-2030 (%)
Data Table on Education - Year-over-year growth 2025-2030 (%)

8.6 Healthcare - Market size and forecast 2025-2030

Chart on Healthcare - Market size and forecast 2025-2030 ($ million)
Data Table on Healthcare - Market size and forecast 2025-2030 ($ million)
Chart on Healthcare - Year-over-year growth 2025-2030 (%)
Data Table on Healthcare - Year-over-year growth 2025-2030 (%)

8.7 Others - Market size and forecast 2025-2030

Chart on Others - Market size and forecast 2025-2030 ($ million)
Data Table on Others - Market size and forecast 2025-2030 ($ million)
Chart on Others - Year-over-year growth 2025-2030 (%)
Data Table on Others - Year-over-year growth 2025-2030 (%)

8.8 Market opportunity by Application

Market opportunity by Application ($ million)
Data Table on Market opportunity by Application ($ million)

9. Market Segmentation by Component

9.1 Market segments

Chart on Component - Market share 2025-2030 (%)
Data Table on Component - Market share 2025-2030 (%)

9.2 Comparison by Component

Chart on Comparison by Component
Data Table on Comparison by Component

9.3 Hardware - Market size and forecast 2025-2030

Chart on Hardware - Market size and forecast 2025-2030 ($ million)
Data Table on Hardware - Market size and forecast 2025-2030 ($ million)
Chart on Hardware - Year-over-year growth 2025-2030 (%)
Data Table on Hardware - Year-over-year growth 2025-2030 (%)

9.4 Software - Market size and forecast 2025-2030

Chart on Software - Market size and forecast 2025-2030 ($ million)
Data Table on Software - Market size and forecast 2025-2030 ($ million)
Chart on Software - Year-over-year growth 2025-2030 (%)
Data Table on Software - Year-over-year growth 2025-2030 (%)

9.5 Services - Market size and forecast 2025-2030

Chart on Services - Market size and forecast 2025-2030 ($ million)
Data Table on Services - Market size and forecast 2025-2030 ($ million)
Chart on Services - Year-over-year growth 2025-2030 (%)
Data Table on Services - Year-over-year growth 2025-2030 (%)

9.6 Market opportunity by Component

Market opportunity by Component ($ million)
Data Table on Market opportunity by Component ($ million)

10. Market Segmentation by Technology

10.1 Market segments

Chart on Technology - Market share 2025-2030 (%)
Data Table on Technology - Market share 2025-2030 (%)

10.2 Comparison by Technology

Chart on Comparison by Technology
Data Table on Comparison by Technology

10.3 LCD or LED - Market size and forecast 2025-2030

Chart on LCD or LED - Market size and forecast 2025-2030 ($ million)
Data Table on LCD or LED - Market size and forecast 2025-2030 ($ million)
Chart on LCD or LED - Year-over-year growth 2025-2030 (%)
Data Table on LCD or LED - Year-over-year growth 2025-2030 (%)

10.4 Projection - Market size and forecast 2025-2030

Chart on Projection - Market size and forecast 2025-2030 ($ million)
Data Table on Projection - Market size and forecast 2025-2030 ($ million)
Chart on Projection - Year-over-year growth 2025-2030 (%)
Data Table on Projection - Year-over-year growth 2025-2030 (%)

10.5 OLED - Market size and forecast 2025-2030

Chart on OLED - Market size and forecast 2025-2030 ($ million)
Data Table on OLED - Market size and forecast 2025-2030 ($ million)
Chart on OLED - Year-over-year growth 2025-2030 (%)
Data Table on OLED - Year-over-year growth 2025-2030 (%)

10.6 Market opportunity by Technology

Market opportunity by Technology ($ million)
Data Table on Market opportunity by Technology ($ million)

11. Customer Landscape

11.1 Customer landscape overview

Analysis of price sensitivity, lifecycle, customer purchase basket, adoption rates, and purchase criteria

12. Geographic Landscape

12.1 Geographic segmentation

Chart on Market share by geography 2025-2030 (%)
Data Table on Market share by geography 2025-2030 (%)

12.2 Geographic comparison

Chart on Geographic comparison
Data Table on Geographic comparison

12.3 North America - Market size and forecast 2025-2030

Chart on North America - Market size and forecast 2025-2030 ($ million)
Data Table on North America - Market size and forecast 2025-2030 ($ million)
Chart on North America - Year-over-year growth 2025-2030 (%)
Data Table on North America - Year-over-year growth 2025-2030 (%)
Chart on Regional Comparison - North America
Data Table on Regional Comparison - North America

12.3.1 US - Market size and forecast 2025-2030

Chart on US - Market size and forecast 2025-2030 ($ million)
Data Table on US - Market size and forecast 2025-2030 ($ million)
Chart on US - Year-over-year growth 2025-2030 (%)
Data Table on US - Year-over-year growth 2025-2030 (%)

12.3.2 Canada - Market size and forecast 2025-2030

Chart on Canada - Market size and forecast 2025-2030 ($ million)
Data Table on Canada - Market size and forecast 2025-2030 ($ million)
Chart on Canada - Year-over-year growth 2025-2030 (%)
Data Table on Canada - Year-over-year growth 2025-2030 (%)

12.3.3 Mexico - Market size and forecast 2025-2030

Chart on Mexico - Market size and forecast 2025-2030 ($ million)
Data Table on Mexico - Market size and forecast 2025-2030 ($ million)
Chart on Mexico - Year-over-year growth 2025-2030 (%)
Data Table on Mexico - Year-over-year growth 2025-2030 (%)

12.4 APAC - Market size and forecast 2025-2030

Chart on APAC - Market size and forecast 2025-2030 ($ million)
Data Table on APAC - Market size and forecast 2025-2030 ($ million)
Chart on APAC - Year-over-year growth 2025-2030 (%)
Data Table on APAC - Year-over-year growth 2025-2030 (%)
Chart on Regional Comparison - APAC
Data Table on Regional Comparison - APAC

12.4.1 China - Market size and forecast 2025-2030

Chart on China - Market size and forecast 2025-2030 ($ million)
Data Table on China - Market size and forecast 2025-2030 ($ million)
Chart on China - Year-over-year growth 2025-2030 (%)
Data Table on China - Year-over-year growth 2025-2030 (%)

12.4.2 Japan - Market size and forecast 2025-2030

Chart on Japan - Market size and forecast 2025-2030 ($ million)
Data Table on Japan - Market size and forecast 2025-2030 ($ million)
Chart on Japan - Year-over-year growth 2025-2030 (%)
Data Table on Japan - Year-over-year growth 2025-2030 (%)

12.4.3 India - Market size and forecast 2025-2030

Chart on India - Market size and forecast 2025-2030 ($ million)
Data Table on India - Market size and forecast 2025-2030 ($ million)
Chart on India - Year-over-year growth 2025-2030 (%)
Data Table on India - Year-over-year growth 2025-2030 (%)

12.4.4 South Korea - Market size and forecast 2025-2030

Chart on South Korea - Market size and forecast 2025-2030 ($ million)
Data Table on South Korea - Market size and forecast 2025-2030 ($ million)
Chart on South Korea - Year-over-year growth 2025-2030 (%)
Data Table on South Korea - Year-over-year growth 2025-2030 (%)

12.4.5 Indonesia - Market size and forecast 2025-2030

Chart on Indonesia - Market size and forecast 2025-2030 ($ million)
Data Table on Indonesia - Market size and forecast 2025-2030 ($ million)
Chart on Indonesia - Year-over-year growth 2025-2030 (%)
Data Table on Indonesia - Year-over-year growth 2025-2030 (%)

12.4.6 Australia - Market size and forecast 2025-2030

Chart on Australia - Market size and forecast 2025-2030 ($ million)
Data Table on Australia - Market size and forecast 2025-2030 ($ million)
Chart on Australia - Year-over-year growth 2025-2030 (%)
Data Table on Australia - Year-over-year growth 2025-2030 (%)

12.5 Europe - Market size and forecast 2025-2030

Chart on Europe - Market size and forecast 2025-2030 ($ million)
Data Table on Europe - Market size and forecast 2025-2030 ($ million)
Chart on Europe - Year-over-year growth 2025-2030 (%)
Data Table on Europe - Year-over-year growth 2025-2030 (%)
Chart on Regional Comparison - Europe
Data Table on Regional Comparison - Europe

12.5.1 Germany - Market size and forecast 2025-2030

Chart on Germany - Market size and forecast 2025-2030 ($ million)
Data Table on Germany - Market size and forecast 2025-2030 ($ million)
Chart on Germany - Year-over-year growth 2025-2030 (%)
Data Table on Germany - Year-over-year growth 2025-2030 (%)

12.5.2 UK - Market size and forecast 2025-2030

Chart on UK - Market size and forecast 2025-2030 ($ million)
Data Table on UK - Market size and forecast 2025-2030 ($ million)
Chart on UK - Year-over-year growth 2025-2030 (%)
Data Table on UK - Year-over-year growth 2025-2030 (%)

12.5.3 France - Market size and forecast 2025-2030

Chart on France - Market size and forecast 2025-2030 ($ million)
Data Table on France - Market size and forecast 2025-2030 ($ million)
Chart on France - Year-over-year growth 2025-2030 (%)
Data Table on France - Year-over-year growth 2025-2030 (%)

12.5.4 Italy - Market size and forecast 2025-2030

Chart on Italy - Market size and forecast 2025-2030 ($ million)
Data Table on Italy - Market size and forecast 2025-2030 ($ million)
Chart on Italy - Year-over-year growth 2025-2030 (%)
Data Table on Italy - Year-over-year growth 2025-2030 (%)

12.5.5 Spain - Market size and forecast 2025-2030

Chart on Spain - Market size and forecast 2025-2030 ($ million)
Data Table on Spain - Market size and forecast 2025-2030 ($ million)
Chart on Spain - Year-over-year growth 2025-2030 (%)
Data Table on Spain - Year-over-year growth 2025-2030 (%)

12.5.6 The Netherlands - Market size and forecast 2025-2030

Chart on The Netherlands - Market size and forecast 2025-2030 ($ million)
Data Table on The Netherlands - Market size and forecast 2025-2030 ($ million)
Chart on The Netherlands - Year-over-year growth 2025-2030 (%)
Data Table on The Netherlands - Year-over-year growth 2025-2030 (%)

12.6 South America - Market size and forecast 2025-2030

Chart on South America - Market size and forecast 2025-2030 ($ million)
Data Table on South America - Market size and forecast 2025-2030 ($ million)
Chart on South America - Year-over-year growth 2025-2030 (%)
Data Table on South America - Year-over-year growth 2025-2030 (%)
Chart on Regional Comparison - South America
Data Table on Regional Comparison - South America

12.6.1 Brazil - Market size and forecast 2025-2030

Chart on Brazil - Market size and forecast 2025-2030 ($ million)
Data Table on Brazil - Market size and forecast 2025-2030 ($ million)
Chart on Brazil - Year-over-year growth 2025-2030 (%)
Data Table on Brazil - Year-over-year growth 2025-2030 (%)

12.6.2 Argentina - Market size and forecast 2025-2030

Chart on Argentina - Market size and forecast 2025-2030 ($ million)
Data Table on Argentina - Market size and forecast 2025-2030 ($ million)
Chart on Argentina - Year-over-year growth 2025-2030 (%)
Data Table on Argentina - Year-over-year growth 2025-2030 (%)

12.6.3 Colombia - Market size and forecast 2025-2030

Chart on Colombia - Market size and forecast 2025-2030 ($ million)
Data Table on Colombia - Market size and forecast 2025-2030 ($ million)
Chart on Colombia - Year-over-year growth 2025-2030 (%)
Data Table on Colombia - Year-over-year growth 2025-2030 (%)

12.7 Middle East and Africa - Market size and forecast 2025-2030

Chart on Middle East and Africa - Market size and forecast 2025-2030 ($ million)
Data Table on Middle East and Africa - Market size and forecast 2025-2030 ($ million)
Chart on Middle East and Africa - Year-over-year growth 2025-2030 (%)
Data Table on Middle East and Africa - Year-over-year growth 2025-2030 (%)
Chart on Regional Comparison - Middle East and Africa
Data Table on Regional Comparison - Middle East and Africa

12.7.1 Saudi Arabia - Market size and forecast 2025-2030

Chart on Saudi Arabia - Market size and forecast 2025-2030 ($ million)
Data Table on Saudi Arabia - Market size and forecast 2025-2030 ($ million)
Chart on Saudi Arabia - Year-over-year growth 2025-2030 (%)
Data Table on Saudi Arabia - Year-over-year growth 2025-2030 (%)

12.7.2 UAE - Market size and forecast 2025-2030

Chart on UAE - Market size and forecast 2025-2030 ($ million)
Data Table on UAE - Market size and forecast 2025-2030 ($ million)
Chart on UAE - Year-over-year growth 2025-2030 (%)
Data Table on UAE - Year-over-year growth 2025-2030 (%)

12.7.3 South Africa - Market size and forecast 2025-2030

Chart on South Africa - Market size and forecast 2025-2030 ($ million)
Data Table on South Africa - Market size and forecast 2025-2030 ($ million)
Chart on South Africa - Year-over-year growth 2025-2030 (%)
Data Table on South Africa - Year-over-year growth 2025-2030 (%)

12.7.4 Egypt - Market size and forecast 2025-2030

Chart on Egypt - Market size and forecast 2025-2030 ($ million)
Data Table on Egypt - Market size and forecast 2025-2030 ($ million)
Chart on Egypt - Year-over-year growth 2025-2030 (%)
Data Table on Egypt - Year-over-year growth 2025-2030 (%)

12.7.5 Nigeria - Market size and forecast 2025-2030

Chart on Nigeria - Market size and forecast 2025-2030 ($ million)
Data Table on Nigeria - Market size and forecast 2025-2030 ($ million)
Chart on Nigeria - Year-over-year growth 2025-2030 (%)
Data Table on Nigeria - Year-over-year growth 2025-2030 (%)

12.8 Market opportunity by geography

Market opportunity by geography ($ million)
Data Tables on Market opportunity by geography ($ million)

13. Drivers, Challenges, and Opportunity

13.1 Market drivers

High growth of retail space
Increasing adoption of digital signage from various sectors
High growth of DOOH signage

13.2 Market challenges

Lack of content relevance and decrease in content diversity
Improper digital signage implementation
Cybersecurity issues in digital signage

13.3 Impact of drivers and challenges

Impact of drivers and challenges in 2025 and 2030

13.4 Market opportunities

Introduction of SOC technology
Innovations in display technology
Big data analytics and AI in digital signage

14. Competitive Landscape

14.1 Overview

14.2

Overview on criticality of inputs and factors of differentiation

14.3 Landscape disruption

Overview on factors of disruption

14.4 Industry risks

Impact of key risks on business

15. Competitive Analysis

15.1 Companies profiled

Companies covered

15.2 Company ranking index

15.3 Market positioning of companies

Matrix on companies position and classification

15.4 Acer Inc.

Acer Inc. - Overview
Acer Inc. - Business segments
Acer Inc. - Key news
Acer Inc. - Key offerings
Acer Inc. - Segment focus
SWOT

15.5 AUO Corp.

AUO Corp. - Overview
AUO Corp. - Business segments
AUO Corp. - Key news
AUO Corp. - Key offerings
AUO Corp. - Segment focus
SWOT

15.6 Barco NV

Barco NV - Overview
Barco NV - Business segments
Barco NV - Key news
Barco NV - Key offerings
Barco NV - Segment focus
SWOT

15.7 Dell Technologies Inc.

Dell Technologies Inc. - Overview
Dell Technologies Inc. - Business segments
Dell Technologies Inc. - Key news
Dell Technologies Inc. - Key offerings
Dell Technologies Inc. - Segment focus
SWOT

15.8 HP Inc.

HP Inc. - Overview
HP Inc. - Business segments
HP Inc. - Key news
HP Inc. - Key offerings
HP Inc. - Segment focus
SWOT

15.9 Koninklijke Philips NV

Koninklijke Philips NV - Overview
Koninklijke Philips NV - Business segments
Koninklijke Philips NV - Key news
Koninklijke Philips NV - Key offerings
Koninklijke Philips NV - Segment focus
SWOT

15.10 LG Electronics Inc.

LG Electronics Inc. - Overview
LG Electronics Inc. - Business segments
LG Electronics Inc. - Key offerings
LG Electronics Inc. - Segment focus
SWOT

15.11 Mitsubishi Electric Corp.

Mitsubishi Electric Corp. - Overview
Mitsubishi Electric Corp. - Business segments
Mitsubishi Electric Corp. - Key offerings
Mitsubishi Electric Corp. - Segment focus
SWOT

15.12 NEC Corp.

NEC Corp. - Overview
NEC Corp. - Business segments
NEC Corp. - Key news
NEC Corp. - Key offerings
NEC Corp. - Segment focus
SWOT

15.13 Panasonic Holdings Corp.

Panasonic Holdings Corp. - Overview
Panasonic Holdings Corp. - Business segments
Panasonic Holdings Corp. - Key news
Panasonic Holdings Corp. - Key offerings
Panasonic Holdings Corp. - Segment focus
SWOT

15.14 Planar Systems Inc.

Planar Systems Inc. - Overview
Planar Systems Inc. - Product / Service
Planar Systems Inc. - Key offerings
SWOT

15.15 Samsung Electronics Co. Ltd.

Samsung Electronics Co. Ltd. - Overview
Samsung Electronics Co. Ltd. - Business segments
Samsung Electronics Co. Ltd. - Key news
Samsung Electronics Co. Ltd. - Key offerings
Samsung Electronics Co. Ltd. - Segment focus
SWOT

15.16 Sharp Corp.

Sharp Corp. - Overview
Sharp Corp. - Business segments
Sharp Corp. - Key news
Sharp Corp. - Key offerings
Sharp Corp. - Segment focus
SWOT

15.17 Sony Group Corp.

Sony Group Corp. - Overview
Sony Group Corp. - Business segments
Sony Group Corp. - Key offerings
Sony Group Corp. - Segment focus
SWOT

15.18 Toshiba Corp.

Toshiba Corp. - Overview
Toshiba Corp. - Business segments
Toshiba Corp. - Key news
Toshiba Corp. - Key offerings
Toshiba Corp. - Segment focus
SWOT

16. Appendix

16.1 Scope of the report

Market definition
Objectives
Notes and caveats

16.2 Inclusions and exclusions checklist

Inclusions checklist
Exclusions checklist

16.3 Currency conversion rates for US$

16.4 Research methodology

16.5 Data procurement

Information sources

16.6 Data validation

16.7 Validation techniques employed for market sizing

16.8 Data synthesis

16.9 360 degree market analysis

16.10 List of abbreviations

Research Methodology

Technavio presents a detailed picture of the market by way of study, synthesis, and summation of data from multiple sources. The analysts have presented the various facets of the market with a particular focus on identifying the key industry influencers. The data thus presented is comprehensive, reliable, and the result of extensive research, both primary and secondary.

INFORMATION SOURCES

Primary sources

  • Manufacturers and suppliers
  • Channel partners
  • Industry experts
  • Strategic decision makers

Secondary sources

  • Industry journals and periodicals
  • Government data
  • Financial reports of key industry players
  • Historical data
  • Press releases

DATA ANALYSIS

Data Synthesis

  • Collation of data
  • Estimation of key figures
  • Analysis of derived insights

Data Validation

  • Triangulation with data models
  • Reference against proprietary databases
  • Corroboration with industry experts

REPORT WRITING

Qualitative

  • Market drivers
  • Market challenges
  • Market trends
  • Five forces analysis

Quantitative

  • Market size and forecast
  • Market segmentation
  • Geographical insights
  • Competitive landscape

Interested in this report?

Get your sample now to see our research methodology and insights!

Download Now

Frequently Asked Questions

Digital Signage market growth will increase by USD 12434.2 million during 2026-2030.

The Digital Signage market is expected to grow at a CAGR of 10.5% during 2026-2030.

Digital Signage market is segmented by Application (Retail, QSR and restaurants, Education, Healthcare, Others) Component (Hardware, Software, Services) Technology (LCD or LED, Projection, OLED)

Acer Inc., ASUSTeK Computer Inc., AUO Corp., Barco NV, Christie Digital Systems Inc, Dell Technologies Inc., Elo Touch Solutions Inc., HP Inc., Koninklijke Philips NV, Leyard International, LG Electronics Inc., Mitsubishi Electric Corp., NEC Corp., Panasonic Holdings Corp., Planar Systems Inc., Samsung Electronics Co. Ltd., Sharp Corp., Sony Group Corp., Toshiba Corp., ViewSonic Corp. are a few of the key vendors in the Digital Signage market.

APAC will register the highest growth rate of 37.6% among the other regions. Therefore, the Digital Signage market in APAC is expected to garner significant business opportunities for the vendors during the forecast period.

US, Canada, Mexico, China, Japan, India, South Korea, Indonesia, Australia, Germany, UK, France, Italy, Spain, The Netherlands, Brazil, Argentina, Colombia, Saudi Arabia, UAE, South Africa, Egypt, Nigeria

  • High growth of retail space is the driving factor this market.

The Digital Signage market vendors should focus on grabbing business opportunities from the Application segment as it accounted for the largest market share in the base year.