Electronic Display Devices Market Analysis, Size, and Forecast 2026-2030: APAC (China, Japan, and India), North America (US, Canada, and Mexico), Europe (Germany, UK, and France), South America (Brazil and Argentina), Middle East and Africa (Saudi Arabia, UAE, and South Africa), and Rest of World (ROW)

Electronic Display Devices Market Analysis, Size, and Forecast 2026-2030:
APAC (China, Japan, and India), North America (US, Canada, and Mexico), Europe (Germany, UK, and France), South America (Brazil and Argentina), Middle East and Africa (Saudi Arabia, UAE, and South Africa), and Rest of World (ROW)

Published: Dec 2025 323 Pages SKU: IRTNTR80168

Market Overview at a Glance

$54.79 B
Market Opportunity
5.3%
CAGR 2025 - 2030
40.6%
APAC Growth
$41.85 B
Televisions segment 2024

Electronic Display Devices Market Size 2026-2030

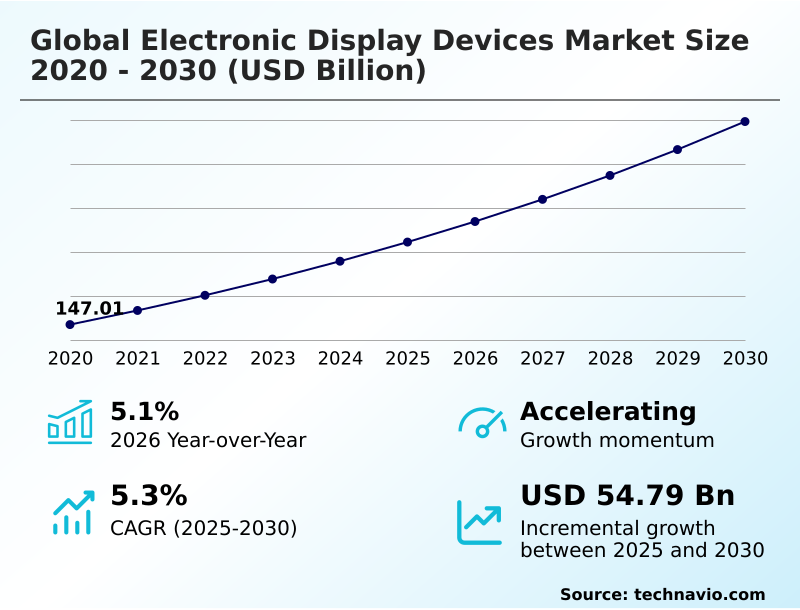
The electronic display devices market size is valued to increase by USD 54.79 billion, at a CAGR of 5.3% from 2025 to 2030. Increasing proliferation of smart devices and IoT integration will drive the electronic display devices market.

Major Market Trends & Insights

  • APAC dominated the market and accounted for a 40.6% growth during the forecast period.
  • By Type - Televisions segment was valued at USD 41.85 billion in 2024
  • By End-user - Commercial segment accounted for the largest market revenue share in 2024

Market Size & Forecast

  • Market Opportunities: USD 92.29 billion
  • Market Future Opportunities: USD 54.79 billion
  • CAGR from 2025 to 2030 : 5.3%

Market Summary

  • The electronic display devices market is undergoing a period of profound transformation, characterized by rapid technological evolution and the expansion of application frontiers. Growth is driven by a strategic push toward creating more immersive, interactive, and seamlessly integrated visual experiences.
  • This transition redefines the display's role from a simple output device to a central component of the human-machine interface in an increasingly connected world. Key developments include advancements in emissive technologies and innovation in form factors and embedded functionalities.
  • For example, the convergence of sensing and display functions is a pivotal trend, particularly in mobile and wearable technology, where panels can now integrate biometric sensors. The automotive sector has emerged as a particularly strong driver of demand, with the evolution of the vehicle cockpit into a fully digital, software-defined environment necessitating larger, more complex display solutions.
  • In a business context, optimizing the supply chain for specialized components like indium gallium zinc oxide backplanes for medical imaging equipment is critical. This involves managing inventory for diverse products ranging from camera-based digital mirrors to large-format screens requiring advanced optical bonding process, ensuring long operational lifecycles while balancing cost and innovation across sectors.

What will be the Size of the Electronic Display Devices Market during the forecast period?

Get Key Insights on Market Forecast (PDF) Request Free Sample

How is the Electronic Display Devices Market Segmented?

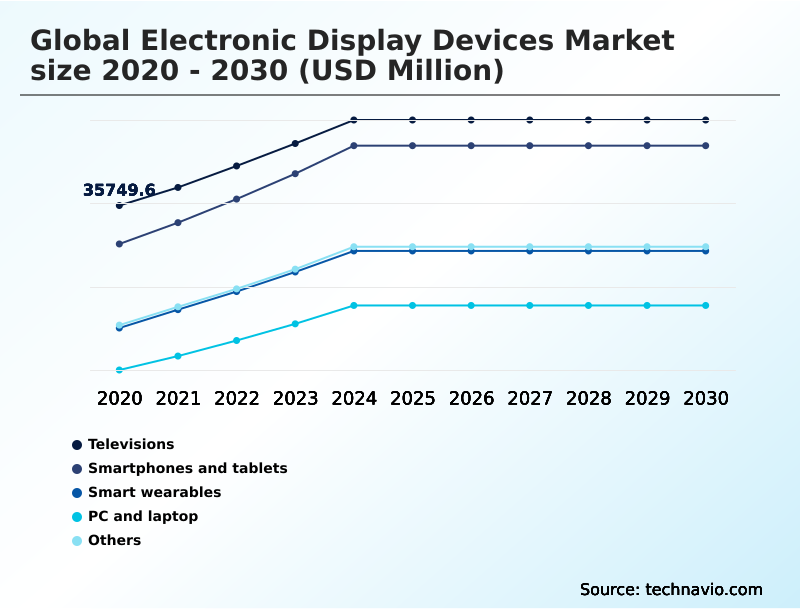
The electronic display devices industry research report provides comprehensive data (region-wise segment analysis), with forecasts and estimates in "USD million" for the period 2026-2030, as well as historical data from 2020-2024 for the following segments.

  • Type
    • Televisions
    • Smartphones and tablets
    • Smart wearables
    • PC and laptop
    • Others
  • End-user
    • Commercial
    • Residential
  • Technology
    • LCD
    • OLED
    • LED
    • Others
  • Geography
    • APAC
      • China
      • Japan
      • India
    • North America
      • US
      • Canada
      • Mexico
    • Europe
      • Germany
      • UK
      • France
    • South America
      • Brazil
      • Argentina
    • Middle East and Africa
      • Saudi Arabia
      • UAE
      • South Africa
    • Rest of World (ROW)

By Type Insights

The televisions segment is estimated to witness significant growth during the forecast period.

The televisions segment is a foundational arena for electronic display devices, driven by a persistent trend toward premiumization. Growth is increasingly fueled by value as consumers demand a superior premium visual experience.

This is pushing manufacturers to enhance liquid crystal display technology with features like mini-led backlighting and local dimming zones to improve high dynamic range performance.

Competing emissive display platforms such as organic light emitting diode are preferred for cinematic content due to their pixel-level light control.

The smart home ecosystem's expansion makes the television a central human-machine interface, with gaming needs driving adoption of high refresh rate panels.

Innovations in micro lens array technology are also improving brightness, achieving up to a 15% increase in power efficiency for residential models. These advancements cater to consumer electronics applications demanding continuous improvement.

Request Free Sample

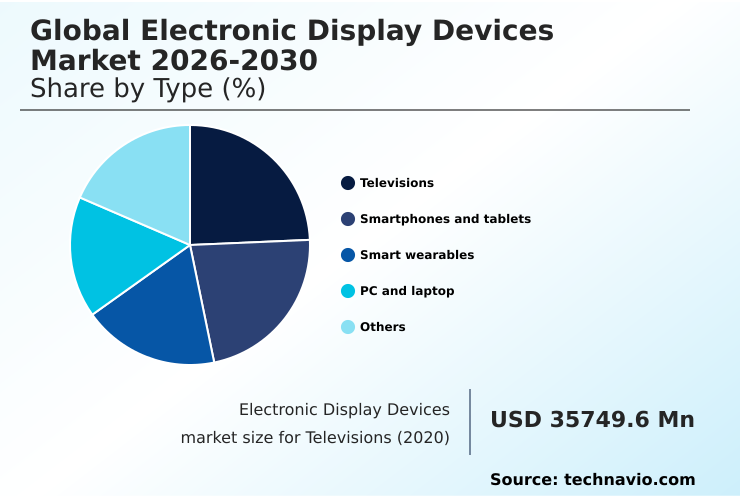
The Televisions segment was valued at USD 41.85 billion in 2024 and showed a gradual increase during the forecast period.

Request Free Sample

Regional Analysis

APAC is estimated to contribute 40.6% to the growth of the global market during the forecast period.Technavio’s analysts have elaborately explained the regional trends and drivers that shape the market during the forecast period.

See How Electronic Display Devices Market Demand is Rising in APAC Request Free Sample

The APAC region is the epicenter of the electronic display devices market, serving as both the primary manufacturing hub and the largest consumer market, accounting for over 40% of incremental growth.

Countries in this region host leading panel manufacturers specializing in in-plane switching and amorphous silicon backplane technologies. The region's dominance is supported by extensive supply chain infrastructure for components like timing controllers.

Massive internal demand from consumer electronics and the construction of smart cities fuels growth in applications from professional-grade monitors to large-format immersive visual installations.

This combination of unparalleled manufacturing scale, with production yields improving by 10% annually, and vast internal demand for power-frugal displays creates a self-reinforcing cycle of innovation that defines the global market trajectory.

Market Dynamics

Our researchers analyzed the data with 2025 as the base year, along with the key drivers, trends, and challenges. A holistic analysis of drivers will help companies refine their marketing strategies to gain a competitive advantage.

  • Strategic decision-making in the display market requires a deep understanding of nuanced technological trade-offs. The debate over the cost of microled vs oled displays is central, as it directly impacts product positioning and profitability. For premium segments, firms must master oled burn-in mitigation techniques to ensure product longevity, a key consumer concern.
  • In the competitive gaming sector, the performance difference between mini-led vs qd-oled for gaming can determine market leadership. For mobile applications, ltpo backplane power consumption benefits are critical for addressing the high refresh rate impact on mobile battery life.
  • The industry also grapples with significant manufacturing hurdles, including the challenges in foldable display manufacturing and the complex microled mass transfer process challenges. In automotive, automotive pillar-to-pillar display integration is redefining interior design, while digital mirror system display requirements push for higher dynamic range and reliability.
  • For niche applications, understanding flexible substrate materials for wearables and the energy efficiency of e-paper displays opens new revenue streams. Similarly, transparent oled retail display applications are transforming in-store experiences. Boardroom discussions must weigh the impact of esg criteria on display manufacturing against the technical demands of ruggedized displays for industrial environments.
  • Analyzing the supply chain for driver integrated circuits reveals that sourcing from multiple vendors can reduce dependency risk and lower procurement costs by up to 15% compared to single-sourcing strategies.
  • Finally, a clear comprehension of color gamut coverage for professional monitors, how variable refresh rate technology explained to consumers, and the cost comparison of ips vs va panels informs product development and marketing strategies.

What are the key market drivers leading to the rise in the adoption of Electronic Display Devices Industry?

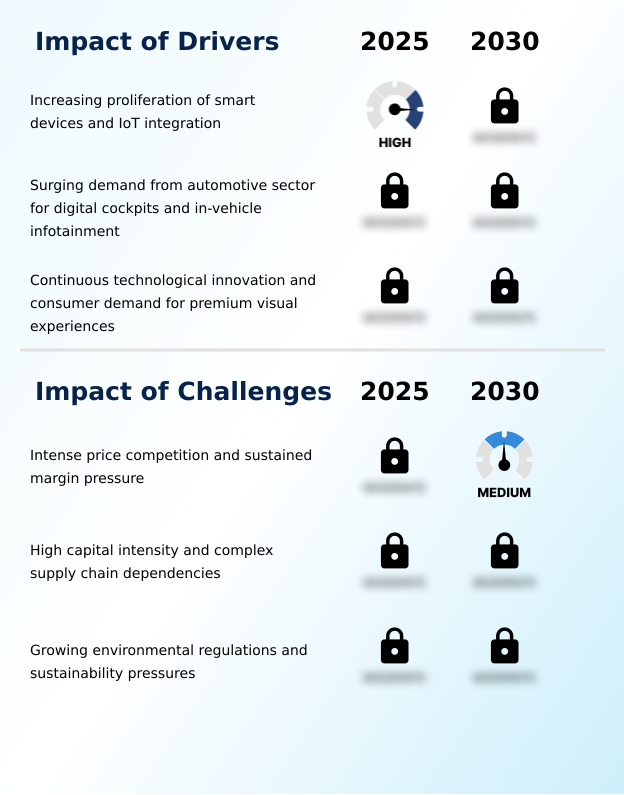
  • The increasing proliferation of smart devices and deeper IoT integration is a key driver, making electronic displays the ubiquitous human-machine interface across a vast ecosystem of connected electronics.

  • The proliferation of smart devices and IoT integration is a foundational driver, embedding displays as the principal interface in an expanding ecosystem of connected electronics. In automotive, the shift to a software-defined digital environment is transforming vehicle interiors.
  • Digital cockpit solutions featuring in-vehicle infotainment systems and advanced driver-assist systems are generating substantial demand for freeform display panels. These systems, often requiring system-on-chip integration and capacitive touch technology, are central to the user experience.
  • The trend towards pillar-to-pillar screens consolidates multiple displays, reducing component volume by 25%. This pervasive integration into high-volume addressable markets where automotive-grade requirements are stringent, including standards for sunlight legibility, ensures a diversified demand base.

What are the market trends shaping the Electronic Display Devices Industry?

  • A defining market trend is the widespread proliferation of Mini-LED backlighting systems enhancing existing LCD architecture. This runs parallel to the strategic emergence of MicroLED technology as a next-generation emissive display platform.

  • The market is shaped by the adoption of novel form factors that redefine product design and user interaction. The use of flexible oled substrates and ultra-thin bendable glass has enabled foldable pc technology, which improves multitasking efficiency by over 40%.
  • Beyond foldable designs, the development of rollable and stretchable electrophoretic ink display variants promises new applications in wearables and smart textiles. Concurrently, gaming-specific features such as high pixel response times and adaptive sync technologies are becoming standard. This focus on dynamic motion clarity has led to a 60% increase in the adoption of panels with refresh rates above 120Hz.
  • These trends signify a pivotal evolution toward dynamic and adaptable surfaces for commercial digital signage and personal use.

What challenges does the Electronic Display Devices Industry face during its growth?

  • Intense price competition coupled with sustained margin pressure represents a key challenge, driven by high capital intensity and cyclical supply-demand imbalances within the market.

  • The market confronts significant capital intensity challenges, as constructing advanced fabrication plants requires enormous upfront investment, with upgrade cycles increasing costs by over 30% every few years. These facilities depend on a complex and fragile global supply chain with high supply chain dependencies on a few providers of high-purity glass substrates and other critical materials.
  • This concentration creates vulnerabilities to disruptions and adds cost pressure. Concurrently, growing environmental scrutiny and the need for sustainable manufacturing practices are escalating challenges. Regulations like right to repair legislation and a focus on end-of-life management and circular economy principles demand substantial investment in greener technologies and more modular designs, impacting firms' operational planning and profitability.

Exclusive Technavio Analysis on Customer Landscape

The electronic display devices market forecasting report includes the adoption lifecycle of the market, covering from the innovator’s stage to the laggard’s stage. It focuses on adoption rates in different regions based on penetration. Furthermore, the electronic display devices market report also includes key purchase criteria and drivers of price sensitivity to help companies evaluate and develop their market growth analysis strategies.

Customer Landscape of Electronic Display Devices Industry

Competitive Landscape

Companies are implementing various strategies, such as strategic alliances, electronic display devices market forecast, partnerships, mergers and acquisitions, geographical expansion, and product/service launches, to enhance their presence in the industry.

Apple Inc. - Delivering advanced electronic display devices with tandem OLED, mini-LED backlighting, and high refresh rates, setting benchmarks for visual performance and power efficiency in premium applications.

The industry research and growth report includes detailed analyses of the competitive landscape of the market and information about key companies, including:

  • Apple Inc.
  • BOE Technology Group Co. Ltd.
  • Corning Inc.
  • DuPont de Nemours Inc.
  • E Ink Holdings Inc.
  • Fujitsu Ltd.
  • HP Inc.
  • Innolux Corp.
  • LG Display Co. Ltd.
  • Mitsubishi Electric
  • NEC Corp.
  • Panasonic Holdings Corp.
  • Powertip Technology Corp
  • Royole Corp
  • Samsung Electronics Co. Ltd.
  • Sharp Corp.
  • Sony Group Corp.
  • TCL Industries Holdings Ltd.
  • Universal Display Corp.

Qualitative and quantitative analysis of companies has been conducted to help clients understand the wider business environment as well as the strengths and weaknesses of key industry players. Data is qualitatively analyzed to categorize companies as pure play, category-focused, industry-focused, and diversified; it is quantitatively analyzed to categorize companies as dominant, leading, strong, tentative, and weak.

Recent Development and News in Electronic display devices market

  • In September, 2024, Continental AG showcased its Crystal Center Display, a 15-inch frameless automotive display utilizing MicroLED technology to achieve exceptional brightness and transparency for modern vehicle interiors.
  • In November, 2024, AU Optronics Corp. demonstrated a 13.5-inch transparent MicroLED display, highlighting the technology's potential for automotive head-up displays and high-end retail signage applications.
  • In January, 2025, LG Display Co. Ltd. introduced its third-generation OLED television panels featuring META Technology, which uses a Micro Lens Array to significantly boost brightness and energy efficiency.
  • In April, 2025, Samsung Display showcased its Sensor OLED Display, which integrates fingerprint and blood pressure sensing capabilities directly into the panel, enabling more streamlined device designs.

Dive into Technavio’s robust research methodology, blending expert interviews, extensive data synthesis, and validated models for unparalleled Electronic Display Devices Market insights. See full methodology.

Market Scope
Page number 323
Base year 2025
Historic period 2020-2024
Forecast period 2026-2030
Growth momentum & CAGR Accelerate at a CAGR of 5.3%
Market growth 2026-2030 USD 54791.3 million
Market structure Fragmented
YoY growth 2025-2026(%) 5.1%
Key countries China, Japan, India, South Korea, Australia, Indonesia, US, Canada, Mexico, Germany, UK, France, Italy, Spain, The Netherlands, Brazil, Argentina, Chile, Saudi Arabia, UAE, South Africa, Israel and Turkey
Competitive landscape Leading Companies, Market Positioning of Companies, Competitive Strategies, and Industry Risks

Request Free Sample

Research Analyst Overview

  • The electronic display devices market is defined by intense technological competition, primarily between established liquid crystal display platforms and newer emissive display platforms. While an advanced liquid crystal display leverages innovations like mini-led backlighting and quantum dot enhancement film to enhance performance, organic light emitting diode technology excels with superior contrast and enables flexible oled substrates.
  • The industry is now advancing toward microled technology and transparent oled displays, which promise further breakthroughs. In automotive, digital cockpit solutions are becoming standard, driving demand for in-plane switching, freeform display panels to create seamless pillar-to-pillar screens for in-vehicle infotainment and advanced driver-assist systems. Integrating augmented reality heads up displays requires significant R&D budget allocation, a critical boardroom decision.
  • These systems rely on components like driver integrated circuits, timing controllers, and high-purity glass substrates. The use of low-temperature polycrystalline oxide backplanes with variable refresh rate technology has improved power efficiency by 20%, a key metric influencing both mobile device design and consumer choice.
  • This complex interplay of technologies, from electrophoretic ink display to camera-based digital mirrors, shapes a dynamic and highly innovative landscape.

What are the Key Data Covered in this Electronic Display Devices Market Research and Growth Report?

  • What is the expected growth of the Electronic Display Devices Market between 2026 and 2030?

    • USD 54.79 billion, at a CAGR of 5.3%

  • What segmentation does the market report cover?

    • The report is segmented by Type (Televisions, Smartphones and tablets, Smart wearables, PC and laptop, and Others), End-user (Commercial, and Residential), Technology (LCD, OLED, LED, and Others) and Geography (APAC, North America, Europe, South America, Middle East and Africa)

  • Which regions are analyzed in the report?

    • APAC, North America, Europe, South America and Middle East and Africa

  • What are the key growth drivers and market challenges?

    • Increasing proliferation of smart devices and IoT integration, Intense price competition and sustained margin pressure

  • Who are the major players in the Electronic Display Devices Market?

    • Apple Inc., BOE Technology Group Co. Ltd., Corning Inc., DuPont de Nemours Inc., E Ink Holdings Inc., Fujitsu Ltd., HP Inc., Innolux Corp., LG Display Co. Ltd., Mitsubishi Electric, NEC Corp., Panasonic Holdings Corp., Powertip Technology Corp, Royole Corp, Samsung Electronics Co. Ltd., Sharp Corp., Sony Group Corp., TCL Industries Holdings Ltd. and Universal Display Corp.

Market Research Insights

  • The market's dynamics are influenced by a strategic push toward a more seamless visual appearance and an all-screen aesthetic in consumer devices. Innovations in under-display camera technology have improved the effective screen area by over 5%, enhancing user immersion.
  • For commercial applications, firms deploying industrial control panels are realizing up to a 15% reduction in operational errors due to improved interface clarity and responsiveness. In automotive, the integration of multiple screens into a single, cohesive unit provides a streamlined user experience.
  • This consolidation trend, focused on delivering a premium visual experience, underscores a market-wide shift where performance and design integration are paramount.

We can help! Our analysts can customize this electronic display devices market research report to meet your requirements.

Get in touch

1. Executive Summary

1.1 Market overview

Executive Summary - Chart on Market Overview
Executive Summary - Data Table on Market Overview
Executive Summary - Chart on Global Market Characteristics
Executive Summary - Chart on Market by Geography
Executive Summary - Chart on Market Segmentation by Type
Executive Summary - Chart on Market Segmentation by End-user
Executive Summary - Chart on Market Segmentation by Technology
Executive Summary - Chart on Incremental Growth
Executive Summary - Data Table on Incremental Growth
Executive Summary - Chart on Company Market Positioning

2. Technavio Analysis

2.1 Analysis of price sensitivity, lifecycle, customer purchase basket, adoption rates, and purchase criteria

2.2 Criticality of inputs and Factors of differentiation

Chart on Overview on criticality of inputs and factors of differentiation

2.3 Factors of disruption

Chart on Overview on factors of disruption

2.4 Impact of drivers and challenges

Chart on Impact of drivers and challenges in 2025 and 2030

3. Market Landscape

3.1 Market ecosystem

Chart on Parent Market
Data Table on - Parent Market

3.2 Market characteristics

Chart on Market characteristics analysis

3.3 Value chain analysis

Chart on Value chain analysis

4. Market Sizing

4.1 Market definition

Data Table on Offerings of companies included in the market definition

4.2 Market segment analysis

Market segments

4.3 Market size 2025

4.4 Market outlook: Forecast for 2025-2030

Chart on Global - Market size and forecast 2025-2030 ($ million)
Data Table on Global - Market size and forecast 2025-2030 ($ million)
Chart on Global Market: Year-over-year growth 2025-2030 (%)
Data Table on Global Market: Year-over-year growth 2025-2030 (%)

5. Historic Market Size

5.1 Global Electronic Display Devices Market 2020 - 2024

Historic Market Size - Data Table on Global Electronic Display Devices Market 2020 - 2024 ($ million)

5.2 Type segment analysis 2020 - 2024

Historic Market Size - Type Segment 2020 - 2024 ($ million)

5.3 End-user segment analysis 2020 - 2024

Historic Market Size - End-user Segment 2020 - 2024 ($ million)

5.4 Technology segment analysis 2020 - 2024

Historic Market Size - Technology Segment 2020 - 2024 ($ million)

5.5 Geography segment analysis 2020 - 2024

Historic Market Size - Geography Segment 2020 - 2024 ($ million)

5.6 Country segment analysis 2020 - 2024

Historic Market Size - Country Segment 2020 - 2024 ($ million)

6. Qualitative Analysis

6.1 The AI impact on global electronic display devices market

7. Five Forces Analysis

7.1 Five forces summary

Five forces analysis - Comparison between 2025 and 2030

7.2 Bargaining power of buyers

Bargaining power of buyers - Impact of key factors 2025 and 2030

7.3 Bargaining power of suppliers

Bargaining power of suppliers - Impact of key factors in 2025 and 2030

7.4 Threat of new entrants

Threat of new entrants - Impact of key factors in 2025 and 2030

7.5 Threat of substitutes

Threat of substitutes - Impact of key factors in 2025 and 2030

7.6 Threat of rivalry

Threat of rivalry - Impact of key factors in 2025 and 2030

7.7 Market condition

Chart on Market condition - Five forces 2025 and 2030

8. Market Segmentation by Type

8.1 Market segments

Chart on Type - Market share 2025-2030 (%)
Data Table on Type - Market share 2025-2030 (%)

8.2 Comparison by Type

Chart on Comparison by Type
Data Table on Comparison by Type

8.3 Televisions - Market size and forecast 2025-2030

Chart on Televisions - Market size and forecast 2025-2030 ($ million)
Data Table on Televisions - Market size and forecast 2025-2030 ($ million)
Chart on Televisions - Year-over-year growth 2025-2030 (%)
Data Table on Televisions - Year-over-year growth 2025-2030 (%)

8.4 Smartphones and tablets - Market size and forecast 2025-2030

Chart on Smartphones and tablets - Market size and forecast 2025-2030 ($ million)
Data Table on Smartphones and tablets - Market size and forecast 2025-2030 ($ million)
Chart on Smartphones and tablets - Year-over-year growth 2025-2030 (%)
Data Table on Smartphones and tablets - Year-over-year growth 2025-2030 (%)

8.5 Smart wearables - Market size and forecast 2025-2030

Chart on Smart wearables - Market size and forecast 2025-2030 ($ million)
Data Table on Smart wearables - Market size and forecast 2025-2030 ($ million)
Chart on Smart wearables - Year-over-year growth 2025-2030 (%)
Data Table on Smart wearables - Year-over-year growth 2025-2030 (%)

8.6 PC and laptop - Market size and forecast 2025-2030

Chart on PC and laptop - Market size and forecast 2025-2030 ($ million)
Data Table on PC and laptop - Market size and forecast 2025-2030 ($ million)
Chart on PC and laptop - Year-over-year growth 2025-2030 (%)
Data Table on PC and laptop - Year-over-year growth 2025-2030 (%)

8.7 Others - Market size and forecast 2025-2030

Chart on Others - Market size and forecast 2025-2030 ($ million)
Data Table on Others - Market size and forecast 2025-2030 ($ million)
Chart on Others - Year-over-year growth 2025-2030 (%)
Data Table on Others - Year-over-year growth 2025-2030 (%)

8.8 Market opportunity by Type

Market opportunity by Type ($ million)
Data Table on Market opportunity by Type ($ million)

9. Market Segmentation by End-user

9.1 Market segments

Chart on End-user - Market share 2025-2030 (%)
Data Table on End-user - Market share 2025-2030 (%)

9.2 Comparison by End-user

Chart on Comparison by End-user
Data Table on Comparison by End-user

9.3 Commercial - Market size and forecast 2025-2030

Chart on Commercial - Market size and forecast 2025-2030 ($ million)
Data Table on Commercial - Market size and forecast 2025-2030 ($ million)
Chart on Commercial - Year-over-year growth 2025-2030 (%)
Data Table on Commercial - Year-over-year growth 2025-2030 (%)

9.4 Residential - Market size and forecast 2025-2030

Chart on Residential - Market size and forecast 2025-2030 ($ million)
Data Table on Residential - Market size and forecast 2025-2030 ($ million)
Chart on Residential - Year-over-year growth 2025-2030 (%)
Data Table on Residential - Year-over-year growth 2025-2030 (%)

9.5 Market opportunity by End-user

Market opportunity by End-user ($ million)
Data Table on Market opportunity by End-user ($ million)

10. Market Segmentation by Technology

10.1 Market segments

Chart on Technology - Market share 2025-2030 (%)
Data Table on Technology - Market share 2025-2030 (%)

10.2 Comparison by Technology

Chart on Comparison by Technology
Data Table on Comparison by Technology

10.3 LCD - Market size and forecast 2025-2030

Chart on LCD - Market size and forecast 2025-2030 ($ million)
Data Table on LCD - Market size and forecast 2025-2030 ($ million)
Chart on LCD - Year-over-year growth 2025-2030 (%)
Data Table on LCD - Year-over-year growth 2025-2030 (%)

10.4 OLED - Market size and forecast 2025-2030

Chart on OLED - Market size and forecast 2025-2030 ($ million)
Data Table on OLED - Market size and forecast 2025-2030 ($ million)
Chart on OLED - Year-over-year growth 2025-2030 (%)
Data Table on OLED - Year-over-year growth 2025-2030 (%)

10.5 LED - Market size and forecast 2025-2030

Chart on LED - Market size and forecast 2025-2030 ($ million)
Data Table on LED - Market size and forecast 2025-2030 ($ million)
Chart on LED - Year-over-year growth 2025-2030 (%)
Data Table on LED - Year-over-year growth 2025-2030 (%)

10.6 Others - Market size and forecast 2025-2030

Chart on Others - Market size and forecast 2025-2030 ($ million)
Data Table on Others - Market size and forecast 2025-2030 ($ million)
Chart on Others - Year-over-year growth 2025-2030 (%)
Data Table on Others - Year-over-year growth 2025-2030 (%)

10.7 Market opportunity by Technology

Market opportunity by Technology ($ million)
Data Table on Market opportunity by Technology ($ million)

11. Customer Landscape

11.1 Customer landscape overview

Analysis of price sensitivity, lifecycle, customer purchase basket, adoption rates, and purchase criteria

12. Geographic Landscape

12.1 Geographic segmentation

Chart on Market share by geography 2025-2030 (%)
Data Table on Market share by geography 2025-2030 (%)

12.2 Geographic comparison

Chart on Geographic comparison
Data Table on Geographic comparison

12.3 APAC - Market size and forecast 2025-2030

Chart on APAC - Market size and forecast 2025-2030 ($ million)
Data Table on APAC - Market size and forecast 2025-2030 ($ million)
Chart on APAC - Year-over-year growth 2025-2030 (%)
Data Table on APAC - Year-over-year growth 2025-2030 (%)
Chart on Regional Comparison - APAC
Data Table on Regional Comparison - APAC

12.3.1 China - Market size and forecast 2025-2030

Chart on China - Market size and forecast 2025-2030 ($ million)
Data Table on China - Market size and forecast 2025-2030 ($ million)
Chart on China - Year-over-year growth 2025-2030 (%)
Data Table on China - Year-over-year growth 2025-2030 (%)

12.3.2 Japan - Market size and forecast 2025-2030

Chart on Japan - Market size and forecast 2025-2030 ($ million)
Data Table on Japan - Market size and forecast 2025-2030 ($ million)
Chart on Japan - Year-over-year growth 2025-2030 (%)
Data Table on Japan - Year-over-year growth 2025-2030 (%)

12.3.3 India - Market size and forecast 2025-2030

Chart on India - Market size and forecast 2025-2030 ($ million)
Data Table on India - Market size and forecast 2025-2030 ($ million)
Chart on India - Year-over-year growth 2025-2030 (%)
Data Table on India - Year-over-year growth 2025-2030 (%)

12.3.4 South Korea - Market size and forecast 2025-2030

Chart on South Korea - Market size and forecast 2025-2030 ($ million)
Data Table on South Korea - Market size and forecast 2025-2030 ($ million)
Chart on South Korea - Year-over-year growth 2025-2030 (%)
Data Table on South Korea - Year-over-year growth 2025-2030 (%)

12.3.5 Australia - Market size and forecast 2025-2030

Chart on Australia - Market size and forecast 2025-2030 ($ million)
Data Table on Australia - Market size and forecast 2025-2030 ($ million)
Chart on Australia - Year-over-year growth 2025-2030 (%)
Data Table on Australia - Year-over-year growth 2025-2030 (%)

12.3.6 Indonesia - Market size and forecast 2025-2030

Chart on Indonesia - Market size and forecast 2025-2030 ($ million)
Data Table on Indonesia - Market size and forecast 2025-2030 ($ million)
Chart on Indonesia - Year-over-year growth 2025-2030 (%)
Data Table on Indonesia - Year-over-year growth 2025-2030 (%)

12.4 North America - Market size and forecast 2025-2030

Chart on North America - Market size and forecast 2025-2030 ($ million)
Data Table on North America - Market size and forecast 2025-2030 ($ million)
Chart on North America - Year-over-year growth 2025-2030 (%)
Data Table on North America - Year-over-year growth 2025-2030 (%)
Chart on Regional Comparison - North America
Data Table on Regional Comparison - North America

12.4.1 US - Market size and forecast 2025-2030

Chart on US - Market size and forecast 2025-2030 ($ million)
Data Table on US - Market size and forecast 2025-2030 ($ million)
Chart on US - Year-over-year growth 2025-2030 (%)
Data Table on US - Year-over-year growth 2025-2030 (%)

12.4.2 Canada - Market size and forecast 2025-2030

Chart on Canada - Market size and forecast 2025-2030 ($ million)
Data Table on Canada - Market size and forecast 2025-2030 ($ million)
Chart on Canada - Year-over-year growth 2025-2030 (%)
Data Table on Canada - Year-over-year growth 2025-2030 (%)

12.4.3 Mexico - Market size and forecast 2025-2030

Chart on Mexico - Market size and forecast 2025-2030 ($ million)
Data Table on Mexico - Market size and forecast 2025-2030 ($ million)
Chart on Mexico - Year-over-year growth 2025-2030 (%)
Data Table on Mexico - Year-over-year growth 2025-2030 (%)

12.5 Europe - Market size and forecast 2025-2030

Chart on Europe - Market size and forecast 2025-2030 ($ million)
Data Table on Europe - Market size and forecast 2025-2030 ($ million)
Chart on Europe - Year-over-year growth 2025-2030 (%)
Data Table on Europe - Year-over-year growth 2025-2030 (%)
Chart on Regional Comparison - Europe
Data Table on Regional Comparison - Europe

12.5.1 Germany - Market size and forecast 2025-2030

Chart on Germany - Market size and forecast 2025-2030 ($ million)
Data Table on Germany - Market size and forecast 2025-2030 ($ million)
Chart on Germany - Year-over-year growth 2025-2030 (%)
Data Table on Germany - Year-over-year growth 2025-2030 (%)

12.5.2 UK - Market size and forecast 2025-2030

Chart on UK - Market size and forecast 2025-2030 ($ million)
Data Table on UK - Market size and forecast 2025-2030 ($ million)
Chart on UK - Year-over-year growth 2025-2030 (%)
Data Table on UK - Year-over-year growth 2025-2030 (%)

12.5.3 France - Market size and forecast 2025-2030

Chart on France - Market size and forecast 2025-2030 ($ million)
Data Table on France - Market size and forecast 2025-2030 ($ million)
Chart on France - Year-over-year growth 2025-2030 (%)
Data Table on France - Year-over-year growth 2025-2030 (%)

12.5.4 Italy - Market size and forecast 2025-2030

Chart on Italy - Market size and forecast 2025-2030 ($ million)
Data Table on Italy - Market size and forecast 2025-2030 ($ million)
Chart on Italy - Year-over-year growth 2025-2030 (%)
Data Table on Italy - Year-over-year growth 2025-2030 (%)

12.5.5 Spain - Market size and forecast 2025-2030

Chart on Spain - Market size and forecast 2025-2030 ($ million)
Data Table on Spain - Market size and forecast 2025-2030 ($ million)
Chart on Spain - Year-over-year growth 2025-2030 (%)
Data Table on Spain - Year-over-year growth 2025-2030 (%)

12.5.6 The Netherlands - Market size and forecast 2025-2030

Chart on The Netherlands - Market size and forecast 2025-2030 ($ million)
Data Table on The Netherlands - Market size and forecast 2025-2030 ($ million)
Chart on The Netherlands - Year-over-year growth 2025-2030 (%)
Data Table on The Netherlands - Year-over-year growth 2025-2030 (%)

12.6 South America - Market size and forecast 2025-2030

Chart on South America - Market size and forecast 2025-2030 ($ million)
Data Table on South America - Market size and forecast 2025-2030 ($ million)
Chart on South America - Year-over-year growth 2025-2030 (%)
Data Table on South America - Year-over-year growth 2025-2030 (%)
Chart on Regional Comparison - South America
Data Table on Regional Comparison - South America

12.6.1 Brazil - Market size and forecast 2025-2030

Chart on Brazil - Market size and forecast 2025-2030 ($ million)
Data Table on Brazil - Market size and forecast 2025-2030 ($ million)
Chart on Brazil - Year-over-year growth 2025-2030 (%)
Data Table on Brazil - Year-over-year growth 2025-2030 (%)

12.6.2 Argentina - Market size and forecast 2025-2030

Chart on Argentina - Market size and forecast 2025-2030 ($ million)
Data Table on Argentina - Market size and forecast 2025-2030 ($ million)
Chart on Argentina - Year-over-year growth 2025-2030 (%)
Data Table on Argentina - Year-over-year growth 2025-2030 (%)

12.6.3 Chile - Market size and forecast 2025-2030

Chart on Chile - Market size and forecast 2025-2030 ($ million)
Data Table on Chile - Market size and forecast 2025-2030 ($ million)
Chart on Chile - Year-over-year growth 2025-2030 (%)
Data Table on Chile - Year-over-year growth 2025-2030 (%)

12.7 Middle East and Africa - Market size and forecast 2025-2030

Chart on Middle East and Africa - Market size and forecast 2025-2030 ($ million)
Data Table on Middle East and Africa - Market size and forecast 2025-2030 ($ million)
Chart on Middle East and Africa - Year-over-year growth 2025-2030 (%)
Data Table on Middle East and Africa - Year-over-year growth 2025-2030 (%)
Chart on Regional Comparison - Middle East and Africa
Data Table on Regional Comparison - Middle East and Africa

12.7.1 Saudi Arabia - Market size and forecast 2025-2030

Chart on Saudi Arabia - Market size and forecast 2025-2030 ($ million)
Data Table on Saudi Arabia - Market size and forecast 2025-2030 ($ million)
Chart on Saudi Arabia - Year-over-year growth 2025-2030 (%)
Data Table on Saudi Arabia - Year-over-year growth 2025-2030 (%)

12.7.2 UAE - Market size and forecast 2025-2030

Chart on UAE - Market size and forecast 2025-2030 ($ million)
Data Table on UAE - Market size and forecast 2025-2030 ($ million)
Chart on UAE - Year-over-year growth 2025-2030 (%)
Data Table on UAE - Year-over-year growth 2025-2030 (%)

12.7.3 South Africa - Market size and forecast 2025-2030

Chart on South Africa - Market size and forecast 2025-2030 ($ million)
Data Table on South Africa - Market size and forecast 2025-2030 ($ million)
Chart on South Africa - Year-over-year growth 2025-2030 (%)
Data Table on South Africa - Year-over-year growth 2025-2030 (%)

12.7.4 Israel - Market size and forecast 2025-2030

Chart on Israel - Market size and forecast 2025-2030 ($ million)
Data Table on Israel - Market size and forecast 2025-2030 ($ million)
Chart on Israel - Year-over-year growth 2025-2030 (%)
Data Table on Israel - Year-over-year growth 2025-2030 (%)

12.7.5 Turkey - Market size and forecast 2025-2030

Chart on Turkey - Market size and forecast 2025-2030 ($ million)
Data Table on Turkey - Market size and forecast 2025-2030 ($ million)
Chart on Turkey - Year-over-year growth 2025-2030 (%)
Data Table on Turkey - Year-over-year growth 2025-2030 (%)

12.8 Market opportunity by geography

Market opportunity by geography ($ million)
Data Tables on Market opportunity by geography ($ million)

13. Drivers, Challenges, and Opportunity

13.1 Market drivers

Increasing proliferation of smart devices and IoT integration
Surging demand from automotive sector for digital cockpits and in-vehicle infotainment
Continuous technological innovation and consumer demand for premium visual experiences

13.2 Market challenges

Intense price competition and sustained margin pressure
High capital intensity and complex supply chain dependencies
Growing environmental regulations and sustainability pressures

13.3 Impact of drivers and challenges

Impact of drivers and challenges in 2025 and 2030

13.4 Market opportunities

Proliferation of mini LED and emergence of micro LED technologies
Adoption of novel and flexible form factors
Increasing adoption of high refresh rates and gaming-specific features

14. Competitive Landscape

14.1 Overview

14.2

Overview on criticality of inputs and factors of differentiation

14.3 Landscape disruption

Overview on factors of disruption

14.4 Industry risks

Impact of key risks on business

15. Competitive Analysis

15.1 Companies profiled

Companies covered

15.2 Company ranking index

15.3 Market positioning of companies

Matrix on companies position and classification

15.4 Apple Inc.

Apple Inc. - Overview
Apple Inc. - Business segments
Apple Inc. - Key news
Apple Inc. - Key offerings
Apple Inc. - Segment focus
SWOT

15.5 BOE Technology Group Co. Ltd.

BOE Technology Group Co. Ltd. - Overview
BOE Technology Group Co. Ltd. - Business segments
BOE Technology Group Co. Ltd. - Key offerings
BOE Technology Group Co. Ltd. - Segment focus
SWOT

15.6 Corning Inc.

Corning Inc. - Overview
Corning Inc. - Business segments
Corning Inc. - Key offerings
Corning Inc. - Segment focus
SWOT

15.7 DuPont de Nemours Inc.

DuPont de Nemours Inc. - Overview
DuPont de Nemours Inc. - Business segments
DuPont de Nemours Inc. - Key news
DuPont de Nemours Inc. - Key offerings
DuPont de Nemours Inc. - Segment focus
SWOT

15.8 E Ink Holdings Inc.

E Ink Holdings Inc. - Overview
E Ink Holdings Inc. - Business segments
E Ink Holdings Inc. - Key news
E Ink Holdings Inc. - Key offerings
E Ink Holdings Inc. - Segment focus
SWOT

15.9 Fujitsu Ltd.

Fujitsu Ltd. - Overview
Fujitsu Ltd. - Business segments
Fujitsu Ltd. - Key news
Fujitsu Ltd. - Key offerings
Fujitsu Ltd. - Segment focus
SWOT

15.10 HP Inc.

HP Inc. - Overview
HP Inc. - Business segments
HP Inc. - Key news
HP Inc. - Key offerings
HP Inc. - Segment focus
SWOT

15.11 Innolux Corp.

Innolux Corp. - Overview
Innolux Corp. - Product / Service
Innolux Corp. - Key offerings
SWOT

15.12 LG Display Co. Ltd.

LG Display Co. Ltd. - Overview
LG Display Co. Ltd. - Product / Service
LG Display Co. Ltd. - Key offerings
SWOT

15.13 NEC Corp.

NEC Corp. - Overview
NEC Corp. - Business segments
NEC Corp. - Key news
NEC Corp. - Key offerings
NEC Corp. - Segment focus
SWOT

15.14 Panasonic Holdings Corp.

Panasonic Holdings Corp. - Overview
Panasonic Holdings Corp. - Business segments
Panasonic Holdings Corp. - Key news
Panasonic Holdings Corp. - Key offerings
Panasonic Holdings Corp. - Segment focus
SWOT

15.15 Samsung Electronics Co. Ltd.

Samsung Electronics Co. Ltd. - Overview
Samsung Electronics Co. Ltd. - Business segments
Samsung Electronics Co. Ltd. - Key news
Samsung Electronics Co. Ltd. - Key offerings
Samsung Electronics Co. Ltd. - Segment focus
SWOT

15.16 Sharp Corp.

Sharp Corp. - Overview
Sharp Corp. - Business segments
Sharp Corp. - Key news
Sharp Corp. - Key offerings
Sharp Corp. - Segment focus
SWOT

15.17 Sony Group Corp.

Sony Group Corp. - Overview
Sony Group Corp. - Business segments
Sony Group Corp. - Key offerings
Sony Group Corp. - Segment focus
SWOT

15.18 TCL Industries Holdings Ltd.

TCL Industries Holdings Ltd. - Overview
TCL Industries Holdings Ltd. - Business segments
TCL Industries Holdings Ltd. - Key offerings
TCL Industries Holdings Ltd. - Segment focus
SWOT

16. Appendix

16.1 Scope of the report

Market definition
Objectives
Notes and caveats

16.2 Inclusions and exclusions checklist

Inclusions checklist
Exclusions checklist

16.3 Currency conversion rates for US$

16.4 Research methodology

16.5 Data procurement

Information sources

16.6 Data validation

16.7 Validation techniques employed for market sizing

16.8 Data synthesis

16.9 360 degree market analysis

16.10 List of abbreviations

Research Methodology

Technavio presents a detailed picture of the market by way of study, synthesis, and summation of data from multiple sources. The analysts have presented the various facets of the market with a particular focus on identifying the key industry influencers. The data thus presented is comprehensive, reliable, and the result of extensive research, both primary and secondary.

INFORMATION SOURCES

Primary sources

  • Manufacturers and suppliers
  • Channel partners
  • Industry experts
  • Strategic decision makers

Secondary sources

  • Industry journals and periodicals
  • Government data
  • Financial reports of key industry players
  • Historical data
  • Press releases

DATA ANALYSIS

Data Synthesis

  • Collation of data
  • Estimation of key figures
  • Analysis of derived insights

Data Validation

  • Triangulation with data models
  • Reference against proprietary databases
  • Corroboration with industry experts

REPORT WRITING

Qualitative

  • Market drivers
  • Market challenges
  • Market trends
  • Five forces analysis

Quantitative

  • Market size and forecast
  • Market segmentation
  • Geographical insights
  • Competitive landscape

Interested in this report?

Get your sample now to see our research methodology and insights!

Download Now

Frequently Asked Questions

Electronic Display Devices market growth will increase by USD 54791.3 million during 2026-2030 .

The Electronic Display Devices market is expected to grow at a CAGR of 5.3% during 2026-2030 .

Electronic Display Devices market is segmented by Type (Televisions, Smartphones and tablets, Smart wearables, PC and laptop, Others) End-user (Commercial, Residential) Technology (LCD, OLED, LED, Others)

Apple Inc., BOE Technology Group Co. Ltd., Corning Inc., DuPont de Nemours Inc., E Ink Holdings Inc., Fujitsu Ltd., HP Inc., Innolux Corp., LG Display Co. Ltd., Mitsubishi Electric, NEC Corp., Panasonic Holdings Corp., Powertip Technology Corp, Royole Corp, Samsung Electronics Co. Ltd., Sharp Corp., Sony Group Corp., TCL Industries Holdings Ltd., Universal Display Corp. are a few of the key vendors in the Electronic Display Devices market.

APAC will register the highest growth rate of 40.6% among the other regions. Therefore, the Electronic Display Devices market in APAC is expected to garner significant business opportunities for the vendors during the forecast period.

China, Japan, India, South Korea, Australia, Indonesia, US, Canada, Mexico, Germany, UK, France, Italy, Spain, The Netherlands, Brazil, Argentina, Chile, Saudi Arabia, UAE, South Africa, Israel, Turkey

  • Increasing proliferation of smart devices and IoT integration is the driving factor this market.

The Electronic Display Devices market vendors should focus on grabbing business opportunities from the Type segment as it accounted for the largest market share in the base year.