Europe Breastfeeding Supplies Market Size 2025-2029
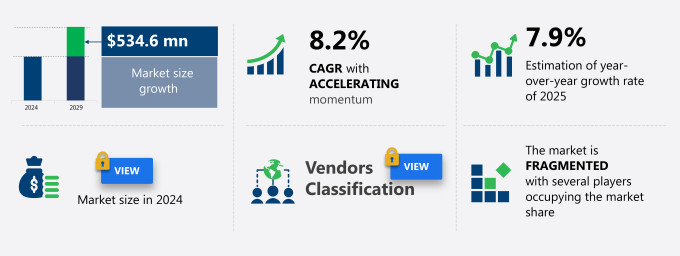
The Europe breastfeeding supplies market size is forecast to increase by USD 534.6 million at a CAGR of 8.2% between 2024 and 2029.
-
The market is experiencing significant growth due to several key factors. The rise in women's employment, increasing awareness of the health benefits of breastfeeding, and the growing adoption of electric breast pumps are driving market expansion. Market companies are responding to this trend by launching innovative products, such as electric breast pumps, to cater to the evolving needs of consumers. Furthermore, education on the advantages of breastfeeding continues to play a crucial role in encouraging more women to choose breastfeeding as their preferred method of feeding their newborns. However, high prices of breastfeeding accessories remain a challenge for some consumers, potentially limiting market penetration. Despite this, the market is expected to continue growing as more women opt for breastfeeding, aided by technological advancements and better educational resources. The market analysis report provides a comprehensive overview of these trends and the challenges impacting the breastfeeding supplies market.
What will be the Size of the Market During the Forecast Period?
-
The breastfeeding supplies market in Europe is experiencing significant growth, driven by a rise in awareness around breastfeeding and its benefits for both mothers and infants. As more women embrace breastfeeding and self-care, breastfeeding products like wearable breast pumps, breast milk collectors, and silicone breast milk collectors have gained popularity, providing convenience and discretion for mothers. The market is also shaped by the increasing need for breastfeeding support, including breastfeeding counseling, breastfeeding education, and breastfeeding support groups. Additionally, the push for breastfeeding-friendly workplaces and breastfeeding-friendly hospitals has led to greater breastfeeding advocacy and breastfeeding policies in Europe.
-
Breastfeeding and technology play an essential role, with innovations improving breastfeeding efficiency and milk production. Breastfeeding and pumping solutions continue to evolve with new breastfeeding tools and accessories, making the breastfeeding journey more manageable. Alongside these advancements, breastfeeding awareness campaigns and breastfeeding research are crucial for breastfeeding success. More mothers are also integrating breastfeeding and exercise into their routines, balancing breastfeeding and weight loss while maintaining breastfeeding nutrition for their babies. Breastfeeding and bonding remain central to the experience, supported by a growing breastfeeding community and breastfeeding initiatives.
How is this market segmented and which is the largest segment?
The market research report provides comprehensive data (region-wise segment analysis), with forecasts and estimates in "USD million" for the period 2025-2029, as well as historical data from 2019-2023 for the following segments.
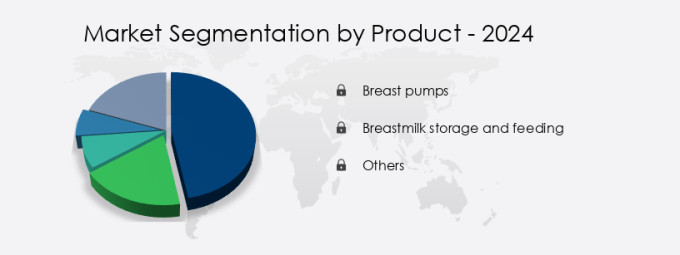
- Product
- Breast pumps
- Breastmilk storage and feeding
- Others
- Application
- 0-6 months babies
- 7-12 months babies
- Geography
- Europe
- Germany
- UK
- France
- Spain
- Europe
By Product Insights
- The breast pumps segment is estimated to witness significant growth during the forecast period.
The market is witnessing significant expansion, driven by the heightened understanding of the advantages of breastfeeding and the increasing number of working mothers. Among the various market offerings, breast pumps represent a significant segment, catering to the needs of contemporary mothers who value convenience and productivity. These devices enable mothers to express and preserve breast milk, ensuring their newborns obtain the nutritional merits of breastfeeding even when direct feeding is impracticable. The market encompasses a diverse array of products, spanning from manual pumps for occasional use by stay-at-home mothers to sophisticated electric and hands-free models. Breast pumps are essential tools for mothers who must balance work and motherhood.
Furthermore, the market for breastfeeding supplies includes other offerings such as formula milk and milk banks. Formula milk is an alternative source of nutrition for infants when breastfeeding is not possible. Milk banks provide donor milk for premature or sick infants who cannot receive their mother's milk. These offerings expand the market's scope and cater to the diverse needs of mothers and their infants. In conclusion, the European breastfeeding supplies market is thriving due to the increasing awareness of breastfeeding benefits and the growing number of working mothers. Breast pumps represent a significant segment of this market, offering solutions for modern mothers seeking convenience and productivity.
Get a glance at the market report of share of various segments Request Free Sample
Market Dynamics
Our market researchers analyzed the data with 2024 as the base year, along with the key drivers, trends, and challenges. A holistic analysis of drivers will help companies refine their marketing strategies to gain a competitive advantage.
What are the key market drivers leading to the rise in adoption of Europe Breastfeeding Supplies Market?
The rise in women employment is the key driver of the market.
- The European breastfeeding supplies market is experiencing growth due to the increasing female employment rate in Europe. In 2023, the EU reported an employment rate of 75.3%, with women accounting for 70.2% of the workforce. This gender gap highlights the significant presence of women in the European workforce, particularly in sectors such as education and healthcare. Balancing professional and personal responsibilities is a common challenge for working mothers, leading to a high demand for breastfeeding supplies. Patient safety and healthcare providers prioritize breastfeeding as the best source of nutrition for newborns, which further fuels market growth. Smart breast pumps, nursing pillows, breast milk bottles, cooling hydrogel pads, and other breastfeeding accessories are essential supplies for working mothers.
- Milk storage solutions, such as hospital-grade and portable milk storage, are also in demand to ensure the continuity of breastfeeding during work hours. The market dynamics are influenced by factors such as the increasing awareness of breastfeeding benefits, the availability of milk banks and donor milk, and the regulatory scrutiny of breast pump efficacy. Developing economies are also investing in research and development to improve breastfeeding equipment and provide affordable solutions for lactating mothers. The market is competitive, with consumer preferences playing a significant role in shaping the landscape. Breastfeeding challenges, such as latching difficulties and low milk supply, are addressed through various breastfeeding accessories and biological technologies, such as silicone breastmilk collectors and nipple shields.
- The economic independence of lactating mothers is a crucial factor driving market growth, as they seek to maintain their careers while providing the best possible care for their newborns. Overall, the European breastfeeding supplies market is poised for continued growth as more women enter the workforce and prioritize breastfeeding as a key aspect of maternal health and childcare support.
What are the market trends shaping the Europe Breastfeeding Supplies Market?
Product launches by market players is the upcoming trend in the market.
- The breastfeeding supplies market in the US is witnessing innovation and product launches aimed at enhancing comfort and convenience for lactating mothers. Additionally, it offers a portable milk storage solution, allowing working mothers to store expressed milk conveniently.
- This pump offers childcare support and lactation equipment to ensure effective milk expression, making it a preferred choice for new moms. Furthermore, the market is witnessing the launch of breast milk bottles, milk storage solutions, and donor milk, providing economic independence for lactating mothers. The breastfeeding supplies market is also witnessing regulatory scrutiny to ensure the efficacy and safety of breast pumps and accessories. The market is expected to grow due to the increasing female employment rate, public awareness campaigns, and the need for breast milk storage solutions for working mothers. Additionally, developing economies are witnessing an increase in demand for breastfeeding supplies due to research and development in biological technologies, such as silicone breastmilk collectors and nursing pillows.
What challenges does Europe Breastfeeding Supplies Market face during the growth?
High prices of breastfeeding accessories is a key challenge affecting the market growth.
- The breastfeeding supplies market in the US is witnessing significant growth due to increasing awareness of the importance of breastfeeding for newborns' health and development. Patient safety and healthcare providers' recommendations are driving the demand for breastfeeding supplies, including pumps, nursing pillows, cooling hydrogel pads, and nursing pads. Working women face challenges in balancing their careers and breastfeeding, leading to an increase in demand for portable milk storage solutions and hospital-grade breast pumps. The market is witnessing innovation with the introduction of smart breast pumps that enable remote monitoring and control, enhancing efficacy and convenience for lactating mothers.
- Milk banks and formula milk are alternative options for mothers facing challenges with milk supply or latching difficulties. Milk storage solutions, such as breast milk bottles and portables, are essential for working mothers to maintain their milk supply while away from their infants. The breastfeeding supplies market is subject to regulatory scrutiny, ensuring the safety and efficacy of products. Consumer preferences for eco-friendly and affordable options are driving the demand for reusable nursing pads and silicone breastmilk collectors. Developing economies are witnessing a swell in demand for breastfeeding supplies due to increasing female employment rate and awareness campaigns. Breastfeeding challenges, such as latching difficulties and low milk supply, are driving the demand for lactation equipment and accessories, including nipple shields and breastfeeding accessories.
Exclusive Customer Landscape
The market forecasting report includes the adoption lifecycle of the market, covering from the innovator's stage to the laggard's stage. It focuses on adoption rates in different regions based on penetration. Furthermore, the market report also includes key purchase criteria and drivers of price sensitivity to help companies evaluate and develop their market growth analysis strategies.

Customer Landscape
Key Companies & Market Insights
Companies are implementing various strategies, such as strategic alliances, market forecast , partnerships, mergers and acquisitions, geographical expansion, and product/service launches, to enhance their presence in the market.
Ameda - The company offers breastfeeding supplies such as Ameda Mya Joy Hospital Strength Portable Electric Breast Pump, One-Hand Manual Breast Pump with Flexishield, Ameda Platinum Multi-User Hospital Grade Electric Breast Pump, and others.
The market research and growth report includes detailed analyses of the competitive landscape of the market and information about key companies, including:
- Chicco
- Koninklijke Philips NV
- Lansinoh Laboratories Inc.
- MAM Babyartikel GmbH
- Materni
- Medela
- Nestle SA
- NUK
- Pigeon Corp.
- Tommee Tippee
Qualitative and quantitative analysis of companies has been conducted to help clients understand the wider business environment as well as the strengths and weaknesses of key market players. Data is qualitatively analyzed to categorize companies as pure play, category-focused, industry-focused, and diversified; it is quantitatively analyzed to categorize companies as dominant, leading, strong, tentative, and weak.
Research Analyst Overview
Breastfeeding is a natural process that plays a crucial role in the health and development of newborns. The breastfeeding supplies market caters to the needs of lactating mothers, offering a range of products designed to ensure an effective and convenient breastfeeding experience. This market analysis explores the key market dynamics that influence the demand for breastfeeding supplies. Patient Safety and Healthcare Providers: The emphasis on patient safety and the role of healthcare providers in promoting optimal maternal and infant health has led to increased demand for breastfeeding supplies. Hospitals and healthcare facilities prioritize breastfeeding as the ideal source of nutrition for newborns, and the availability of breastfeeding equipment, such as breast pumps, diapers, and nursing pillows, is essential for the successful implementation of breastfeeding programs.
However, maternity Breaks and Female Employment: The growing number of working women has led to a surge in demand for breastfeeding supplies, particularly portable milk storage solutions and breast pumps. Maternity breaks and flexible work arrangements enable women to balance their professional and personal lives while ensuring their infants receive breast milk. This trend is particularly prevalent in developed economies, where the female employment rate is high. Feeding Patterns and Postpartum Challenges: Breastfeeding challenges, such as latching difficulties and low milk supply, can impact the duration and success of breastfeeding. Breastfeeding supplies, including nipple shields, nursing pads, and lactation equipment, help address these challenges and promote the continuation of breastfeeding.
Additionally, the availability of donor milk and milk banks ensures that mothers with less milk can still provide their infants with breast milk. Regulatory Scrutiny and Research & Development: Regulatory scrutiny and advancements in biological technologies have driven innovation in the breastfeeding supplies market. The development of smart breast pumps, cooling hydrogel pads, and silicone breastmilk collectors have improved the efficiency and convenience of breastfeeding equipment. These advancements cater to the evolving needs of lactating mothers and contribute to the growth of the market. Consumer Preferences and Competitive Advantage: Consumer preferences for eco-friendly and cost-effective breastfeeding supplies have driven the demand for disposable gowns and reusable breast milk bottles.
Further, companies that offer a competitive advantage through innovative products, affordable pricing, and effective marketing campaigns are likely to capture a significant share of the market. Government Initiatives and Public Awareness: Government initiatives and public awareness campaigns aimed at promoting breastfeeding and supporting lactating mothers contribute to the growth of the breastfeeding supplies market. These initiatives include providing breastfeeding facilities in workplaces, offering subsidies for breastfeeding equipment, and increasing public awareness about the benefits of breastfeeding. In conclusion, the breastfeeding supplies market is driven by various factors, including patient safety, healthcare providers, maternity breaks, feeding patterns, regulatory scrutiny, consumer preferences, and government initiatives.
|
Market Scope |
|
|
Report Coverage |
Details |
|
Page number |
166 |
|
Base year |
2024 |
|
Historic period |
2019-2023 |
|
Forecast period |
2025-2029 |
|
Growth momentum & CAGR |
Accelerate at a CAGR of 8.2% |
|
Market growth 2025-2029 |
USD 534.6 million |
|
Market structure |
Fragmented |
|
YoY growth 2024-2025(%) |
7.9 |
|
Key countries |
UK, Germany, France, Spain, and Rest of Europe |
|
Competitive landscape |
Leading Companies, Market Positioning of Companies, Competitive Strategies, and Industry Risks |
What are the Key Data Covered in this Market Research and Growth Report?
- CAGR of the market during the forecast period
- Detailed information on factors that will drive the market growth and forecasting between 2025 and 2029
- Precise estimation of the size of the market and its contribution of the market in focus to the parent market
- Accurate predictions about upcoming market growth and trends and changes in consumer behaviour
- Growth of the market across Europe
- Thorough analysis of the market's competitive landscape and detailed information about companies
- Comprehensive analysis of factors that will challenge the growth of market companies
We can help! Our analysts can customize this market research report to meet your requirements. Get in touch