Human Immunodeficiency Virus (HIV) Rapid Test Kits Market Size 2025-2029
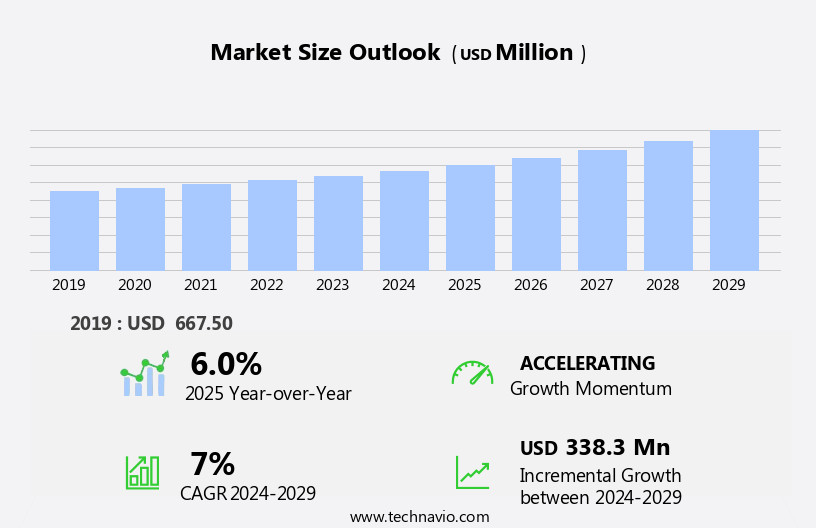
The human immunodeficiency virus (hiv) rapid test kits market size is forecast to increase by USD 338.3 million at a CAGR of 7% between 2024 and 2029.
- The market is experiencing significant growth due to increasing awareness programs for HIV testing and the push for pre-marital screenings in various regions. The World Health Organization (WHO) and other health organizations have been advocating for widespread HIV testing to reduce the spread of the virus and improve patient outcomes. This trend is particularly prominent in developed regions, where access to healthcare and testing facilities is more readily available. However, challenges persist in limited-resource settings, where the non-availability of rapid HIV test kits hinders effective screening and diagnosis. This presents a significant opportunity for market participants to address this unmet need and expand their reach in emerging markets.
- Companies seeking to capitalize on this opportunity must navigate regulatory complexities and collaborate with local health authorities to ensure the successful implementation of their products. Additionally, ongoing research and development efforts to improve test accuracy and reduce costs will continue to drive innovation in the market.
What will be the Size of the Human Immunodeficiency Virus (HIV) Rapid Test Kits Market during the forecast period?
- The market is experiencing significant growth due to the increasing emphasis on HIV stigma reduction and the implementation of prevention programs. Self-testing kits are gaining popularity as they offer convenience and confidentiality, contributing to the market's expansion. HIV screening programs in various settings, including healthcare facilities and community centers, also drive demand for these kits. Discrimination against individuals living with HIV remains a challenge, fueling the need for rapid and accurate diagnosis to mitigate potential health risks and promote early treatment.
- HIV advocacy organizations continue to play a vital role in raising awareness and increasing access to testing facilities. Rapid HIV diagnosis through these kits enables early intervention and effective management of the disease, ultimately improving patient outcomes.
How is this Human Immunodeficiency Virus (HIV) Rapid Test Kits Industry segmented?
The human immunodeficiency virus (hiv) rapid test kits industry research report provides comprehensive data (region-wise segment analysis), with forecasts and estimates in "USD million" for the period 2025-2029, as well as historical data from 2019-2023 for the following segments.
- Distribution Channel
- Offline
- Online
- Type
- HIV rapid immunoassay test
- HIV rapid molecular diagnostic test
- End-user
- Diagnostic centers
- Hospitals and clinics
- Source
- Blood
- Oral fluids
- Urine
- Geography
- North America
- US
- Canada
- Europe
- France
- Germany
- Italy
- UK
- Middle East and Africa
- APAC
- China
- India
- Japan
- South Korea
- South America
- Rest of World (ROW)
- North America
By Distribution Channel Insights
The offline segment is estimated to witness significant growth during the forecast period.
The offline distribution segment plays a pivotal role in the HIV rapid test kits market, providing easy access to these essential health products. This segment caters to consumers through traditional retail outlets, pharmacies, clinics, and hospitals, enabling direct purchase without the need for internet access. The convenience of physical retail locations and healthcare facilities is particularly valuable in areas with limited internet connectivity. Healthcare professionals at these outlets offer valuable guidance to consumers, ensuring accurate test kit selection and usage. The offline distribution channel's personal interactions contribute significantly to the overall market's growth. Additionally, this segment adheres to regulatory approvals, such as CE Marking and WHO Guidelines, ensuring the highest quality and diagnostic accuracy.
Price sensitivity is a crucial factor in the HIV rapid test kits market, with consumers seeking affordable options. The offline segment's competitive pricing, coupled with the convenience of immediate access, makes it a preferred choice for many consumers. Furthermore, the offline distribution channel's supply chain management ensures a consistent and reliable supply of test kits, addressing the demand for early detection and disease management. Incorporating advanced technologies, such as Machine Learning and Artificial Intelligence (AI), into the offline distribution channel enhances its efficiency and effectiveness. Digital health solutions, like Mobile Health Apps and Remote Monitoring, complement the offline segment, offering additional resources for HIV education, test results interpretation, and treatment access.
The offline distribution channel's role in the HIV rapid test kits market is multifaceted, catering to various stakeholders, including HIV prevention campaigns, community health centers, and public health infrastructure. The channel's ability to adapt to evolving market trends, such as the emergence of oral fluid tests and point-of-care testing, ensures its continued relevance and growth.

Get a glance at the market report of share of various segments Request Free Sample
The Offline segment was valued at USD 443.20 million in 2019 and showed a gradual increase during the forecast period.
Regional Analysis
North America is estimated to contribute 41% to the growth of the global market during the forecast period.Technavio’s analysts have elaborately explained the regional trends and drivers that shape the market during the forecast period.
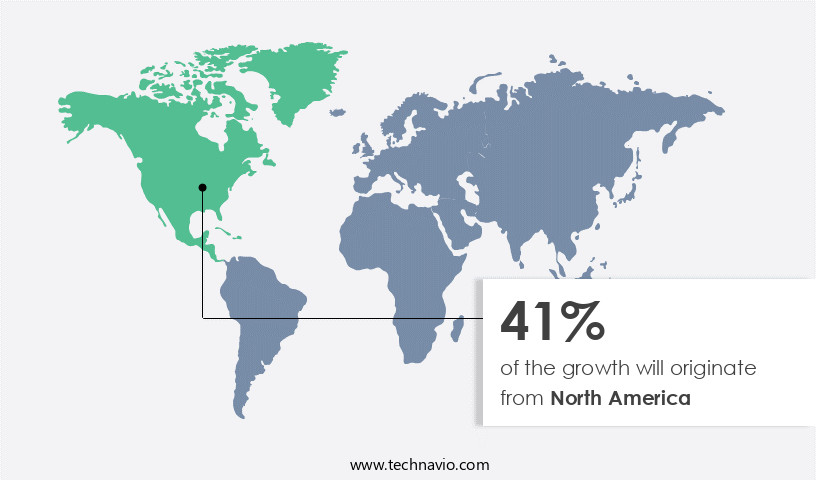
For more insights on the market size of various regions, Request Free Sample
The HIV rapid test market in North America is experiencing significant growth due to the increasing incidence and prevalence of HIV diseases. According to the Centers for Disease Control and Prevention (CDC), there were approximately 1.2 million people living with HIV in the US by the end of 2023. This rising number of HIV cases necessitates immediate diagnosis for effective medical intervention, leading to increased demand for HIV rapid test kits. Moreover, the CDC recommends HIV tests for individuals between the ages of 13 and 64 years, further expanding the market for these tests. The role of healthcare providers in offering STD testing services is also expanding, contributing to market growth.
The use of HIV rapid tests at the point-of-care (POC) allows for quick and accurate diagnosis, ensuring timely treatment and disease management. The adoption of POC testing is further boosted by the availability of mobile health apps, which facilitate remote monitoring and data analytics. The market for HIV rapid tests is subject to various factors, including regulatory approvals, test accuracy, and supply chain management. CE Marking, a mandatory conformity mark for products sold within the European Economic Area (EEA), is essential for companies looking to expand their reach. Test accuracy is a crucial factor in the market, with false positives and false negatives impacting the reliability of test results.
Price sensitivity is another significant factor influencing market growth, with many companies focusing on cost-effective solutions to cater to a wider customer base. Machine learning and artificial intelligence (AI) are being integrated into HIV rapid tests to improve diagnostic accuracy and reduce human error. Additionally, market competition is intense, with numerous players vying for market share through clinical trials, collaborations, and partnerships. In the realm of HIV testing, various guidelines and initiatives are being implemented to improve access to testing and treatment. For instance, the World Health Organization (WHO) guidelines recommend routine HIV testing for all pregnant women and their partners, while the use of antiretroviral therapy (ART) is essential for HIV management.
The availability of pre-exposure prophylaxis (PrEP) and post-exposure prophylaxis (PEP) further emphasizes the importance of early detection and treatment. The HIV rapid test market is a complex ecosystem, involving various stakeholders such as healthcare professionals, community health centers, distribution channels, and public health infrastructure. Ensuring the quality and shelf life of test kits, as well as test validation and regulatory approvals, are crucial for market success. The market is also influenced by factors such as disease progression, treatment access, and viral load monitoring. In conclusion, the HIV rapid test market in North America is driven by the increasing demand for immediate HIV diagnosis, expanding healthcare provider networks, and the integration of technology into HIV testing.
The market is subject to various factors, including regulatory approvals, test accuracy, and price sensitivity, and is influenced by numerous stakeholders. The importance of early detection and effective treatment, as well as ongoing research and innovation, will continue to shape the market's growth and evolution.
Market Dynamics
Our researchers analyzed the data with 2024 as the base year, along with the key drivers, trends, and challenges. A holistic analysis of drivers will help companies refine their marketing strategies to gain a competitive advantage.
What are the key market drivers leading to the rise in the adoption of Human Immunodeficiency Virus (HIV) Rapid Test Kits Industry?
- Rise in awareness programs for HIV testing is the key driver of the market.
- The HIV rapid test kits market plays a significant role in the global health sector, facilitating early detection and diagnosis of Human Immunodeficiency Virus (HIV) infections. The American Institutes for Research (AIR), a not-for-profit organization, is a key player in this domain, collaborating with the Centers for Disease Control and Prevention (CDC) to enhance HIV prevention efforts. AIR supports the CDC's Division of HIV/AIDS Prevention by providing strategic guidance and communicating with partners and stakeholders regarding effective HIV prevention methods, policies, and programs.
- The organization's commitment to this cause is crucial in increasing HIV awareness and reducing new infection rates. By working together, these organizations aim to ensure accessible and efficient HIV testing services, contributing to the overall goal of preventing the spread of HIV.
What are the market trends shaping the Human Immunodeficiency Virus (HIV) Rapid Test Kits Industry?
- Efforts to increase pre-marital screenings for HIV is the upcoming market trend.
- HIV infection continues to pose a significant global health challenge, with millions of new cases reported annually despite prevention measures. To mitigate this issue, various governments have initiated policies and programs, including pre-marital screening. This health assessment of soon-to-be-married couples aims to identify the presence of infectious diseases, including HIV, and STDs. Pre-marital screening programs have gained traction due to increased awareness of their benefits in preventing disease transmission between couples and their offspring.
- Developed countries like the US and emerging economies, such as the UAE, have observed a rise in the adoption of these screening tests. This trend is expected to persist due to ongoing efforts to control and prevent the spread of HIV.
What challenges does the Human Immunodeficiency Virus (HIV) Rapid Test Kits Industry face during its growth?
- Non-availability of rapid HIV products in limited-resource settings is a key challenge affecting the industry growth.
- HIV remains a significant global health concern, leading to considerable perinatal morbidity and mortality. In making decisions regarding infectious disease diagnostic testing in healthcare systems, cost-effectiveness is a crucial factor. HIV rapid testing, while affordable, leaves many undiagnosed due to limited availability in resource-constrained settings. Factors influencing the overall costs of HIV screening include HIV prevalence, geographical location, costs of conventional and rapid test kits, and post-conventional testing return rates.
- Despite the affordability of rapid HIV tests, their accessibility is a challenge in many areas. Decision-makers must carefully consider these factors to optimize HIV screening programs.
Exclusive Customer Landscape
The human immunodeficiency virus (hiv) rapid test kits market forecasting report includes the adoption lifecycle of the market, covering from the innovator’s stage to the laggard’s stage. It focuses on adoption rates in different regions based on penetration. Furthermore, the human immunodeficiency virus (hiv) rapid test kits market report also includes key purchase criteria and drivers of price sensitivity to help companies evaluate and develop their market growth analysis strategies.

Customer Landscape
Key Companies & Market Insights
Companies are implementing various strategies, such as strategic alliances, human immunodeficiency virus (hiv) rapid test kits market forecast, partnerships, mergers and acquisitions, geographical expansion, and product/service launches, to enhance their presence in the industry.
Abbott Laboratories - The company provides rapid HIV testing solutions, including the DETERMINE HIV 1 by 2 AG/Combo kit. This test detects both HIV 1 by 2 antibodies and free HIV 1 p24 antigen, ensuring accurate results in a short timeframe. Our offerings contribute to the global effort in early HIV detection and disease management.
The industry research and growth report includes detailed analyses of the competitive landscape of the market and information about key companies, including:
- Abbott Laboratories
- AccuQuik Test Kits
- Amkay Products Pvt. Ltd.
- Becton Dickinson and Co.
- Bhat Bio Tech India Pvt Ltd.
- bioLytical Laboratories Inc.
- bioMerieux SA
- Chembio Diagnostics Inc.
- Danaher Corp.
- DrSafeHands
- F. Hoffmann La Roche Ltd.
- Fujirebio Holdings Inc.
- Healgen Scientific, LLC
- Hologic Inc.
- J. Mitra and Co. Pvt. Ltd.
- MP Biomedicals Inc.
- Oragenics Inc.
- OraSure Technologies Inc.
- Pathkits
- SHINE SA
Qualitative and quantitative analysis of companies has been conducted to help clients understand the wider business environment as well as the strengths and weaknesses of key industry players. Data is qualitatively analyzed to categorize companies as pure play, category-focused, industry-focused, and diversified; it is quantitatively analyzed to categorize companies as dominant, leading, strong, tentative, and weak.
Research Analyst Overview
The market encompasses a diverse range of diagnostic solutions designed to facilitate the detection of HIV infection outside of traditional laboratory settings. These tests play a crucial role in global health initiatives aimed at increasing HIV awareness, promoting early detection, and improving access to HIV care. Immunochromatographic assays and lateral flow immunoassays are two common technologies employed in the production of HIV rapid test kits. These tests offer several advantages, including ease of use, rapid turnaround time, and the ability to be administered in non-clinical settings. The use of these tests is not limited to healthcare professionals; they can also be utilized in community health centers and by individuals through home testing.
The market for HIV rapid test kits is influenced by various factors. One significant factor is the ongoing efforts to improve test accuracy and reduce false positives and false negatives. This has led to advancements in test validation, test kit expiration, and regulatory approvals. Another factor driving market growth is the increasing adoption of digital health technologies, such as mobile health apps and remote monitoring. These technologies enable real-time data analytics and predictive analytics, which can aid in early detection and treatment of HIV infection. Price sensitivity is also a critical factor in the market. As the demand for HIV testing increases, there is a growing need for affordable and accessible testing solutions.
This has led to the development of oral fluid tests and the expansion of distribution channels, including community health centers and online sales. The market for HIV rapid test kits is highly competitive, with numerous players vying for market share. Competition is driven by factors such as test accuracy, supply chain management, and regulatory approvals. Clinical trials and research collaborations are common strategies employed by companies to differentiate their products and gain a competitive edge. The role of healthcare professionals in HIV testing and care is essential. They play a critical role in educating at-risk populations about HIV prevention and providing guidance on HIV testing and treatment.
The use of artificial intelligence (AI) and machine learning in HIV testing and management is also gaining momentum, offering potential improvements in diagnostic accuracy and treatment access. The HIV prevention landscape is evolving, with the increasing availability of pre-exposure prophylaxis (PrEP) and post-exposure prophylaxis (PEP). These preventative measures, combined with early detection and timely access to antiretroviral therapy (ART), can significantly reduce the impact of HIV infection. The market for HIV rapid test kits is influenced by various public health initiatives and guidelines, including those set by the World Health Organization (WHO). These guidelines promote the use of point-of-care testing and the expansion of testing campaigns to reach at-risk populations.
The storage and handling of HIV rapid test kits are critical factors in ensuring test accuracy and reliability. Proper storage conditions and quality control measures are essential to maintain the shelf life and effectiveness of the test kits. In conclusion, the HIV rapid test kits market is a dynamic and evolving landscape, driven by a range of factors, including technological advancements, price sensitivity, and public health initiatives. The market is highly competitive, with numerous players vying for market share. Despite the challenges, the market offers significant opportunities for innovation and growth, with the potential to improve HIV testing and care and ultimately reduce the impact of HIV infection.
|
Market Scope |
|
|
Report Coverage |
Details |
|
Page number |
231 |
|
Base year |
2024 |
|
Historic period |
2019-2023 |
|
Forecast period |
2025-2029 |
|
Growth momentum & CAGR |
Accelerate at a CAGR of 7% |
|
Market growth 2025-2029 |
USD 338.3 million |
|
Market structure |
Fragmented |
|
YoY growth 2024-2025(%) |
6.0 |
|
Key countries |
US, Canada, China, UK, Japan, India, Germany, France, South Korea, and Italy |
|
Competitive landscape |
Leading Companies, Market Positioning of Companies, Competitive Strategies, and Industry Risks |
What are the Key Data Covered in this Human Immunodeficiency Virus (HIV) Rapid Test Kits Market Research and Growth Report?
- CAGR of the Human Immunodeficiency Virus (HIV) Rapid Test Kits industry during the forecast period
- Detailed information on factors that will drive the growth and forecasting between 2025 and 2029
- Precise estimation of the size of the market and its contribution of the industry in focus to the parent market
- Accurate predictions about upcoming growth and trends and changes in consumer behaviour
- Growth of the market across North America, Europe, Asia, and Rest of World (ROW)
- Thorough analysis of the market’s competitive landscape and detailed information about companies
- Comprehensive analysis of factors that will challenge the human immunodeficiency virus (hiv) rapid test kits market growth of industry companies
We can help! Our analysts can customize this human immunodeficiency virus (hiv) rapid test kits market research report to meet your requirements.