
Indonesia Retail Market Size 2025-2029
The Indonesia retail market size is forecast to increase by USD 49.9 billion, at a CAGR of 4.7% between 2024 and 2029. The market is experiencing significant expansion, driven by the increasing preference for local brands among consumers.
Major Market Trends & Insights
- Based on the Distribution Channel, the offline segment led the market and was valued at USD 141.30 billion of the global revenue in 2022.
- Based on the Product, the Food and beverages segment accounted for the largest market revenue share in 2022.
Market Size & Forecast
- Market Opportunities: USD 43.20 Billion
- Future Opportunities: USD 49.9 Billion
- CAGR (2024-2029): 4.7%
The trend is fueled by the growing middle class population and their desire for affordable yet quality products. However, the underdeveloped infrastructure poses a significant challenge for retailers. Limited access to reliable logistics and transportation networks, as well as inconsistent electricity supply, can hinder the smooth operation of retail businesses. To navigate these challenges, retailers must explore innovative solutions such as developing robust supply chain management systems and investing in renewable energy sources. By addressing these issues, retailers can effectively capitalize on the market's potential for growth and meet the evolving needs of Indonesian consumers.
What will be the size of the Indonesia Retail Market during the forecast period?

Explore in-depth regional segment analysis with market size data - historical 2019-2023 and forecasts 2025-2029 - in the full report.
Request Free Sample
- In the dynamic retail market of Indonesia, customer journey mapping plays a crucial role in enhancing customer retention. Online reviews management is essential for maintaining brand building and addressing customer feedback. Supply chain visibility is key to optimizing logistics and ensuring store operations run smoothly. Cart abandonment and conversion rates are closely monitored through predictive analytics and marketing automation. RFID technology and sales training are integral to inventory optimization and pricing strategy. Product assortment and merchandise planning are informed by business intelligence (BI) and prescriptive analytics. Store layout and visual merchandising are critical components of market penetration and competitive advantage. The food and beverages segment is the second largest segment of the type and was valued at USD 122.10 billion in 2022.
- Logistics optimization, retail infrastructure, and drone delivery are shaping the future of the industry. Sales forecasting, demand forecasting, and e-commerce infrastructure are essential for staying ahead of the competition. Staff training and customer experience (CX) are continuously improved through blockchain technology and promotional effectiveness analysis. Market penetration and competitive advantage are enhanced through pricing optimization, merchandise planning, and inventory optimization strategies. Brand building and customer retention are interconnected, with online reviews management and customer experience (CX) playing pivotal roles. Predictive analytics and sales training are essential for anticipating trends and optimizing performance. Store operations and supply chain visibility are crucial for ensuring a seamless retail experience.
How is this market segmented?
The market research report provides comprehensive data (region-wise segment analysis), with forecasts and estimates in "USD billion" for the period 2025-2029, as well as historical data from 2019-2023 for the following segments.
- Distribution Channel
- Offline
- Online
- Product
- Food and beverages
- Electrical and electronics
- Apparel and footwear
- Home improvement and household products
- Others
- Ownership Structure
- Local Retailler
- International Retailer
- End-User
- Urban
- Rural
- Payment Type
- Cash
- Digital Payments (Mobile Apps)
- Cards
- BNPL (Buy Now Pay Later)
- Consumer Segment
- Urban
- Rural
- Geography
- APAC
- Indonesia
- APAC
By Distribution Channel Insights
The offline segment is estimated to witness significant growth during the forecast period. The segment was valued at USD 141.30 billion in 2022. It continued to the largest segment at a CAGR of 4.25%.
In Indonesia's dynamic retail market, convenience stores cater to everyday consumer needs with a focus on accessibility. These small retail outlets offer essentials such as groceries, personal care products, and snacks, often co-located with gas stations for added convenience. Digital payments are increasingly popular, streamlining transactions and enhancing customer experience. Department stores, a staple in urban areas, provide a broad range of consumer goods. They have significantly influenced shopping habits and luxury services in cities. Digital marketing and big data play crucial roles in purchase decisions, with retailers utilizing consumer insights and targeted promotional campaigns to drive sales.
Retail chains and direct-to-consumer brands leverage advanced technologies like augmented reality (AR) and artificial intelligence (AI) to enhance the shopping experience. Inventory management, return rates, and fraud prevention are addressed through sophisticated systems like point-of-sale (POS) and retail analytics. Grocery stores and online marketplaces cater to diverse consumer preferences, with the latter experiencing significant growth due to the convenience of mobile commerce. Green initiatives and ethical sourcing are essential considerations for modern retailers, reflecting shifting consumer values. Logistics networks and warehouse automation optimize order fulfillment and last-mile delivery, ensuring efficient and timely service. Omnichannel retailing and social commerce cater to diverse shopping habits, while customer loyalty programs and supply chain management maintain customer satisfaction.
Payment gateways and e-commerce platforms facilitate cashless transactions, enabling seamless shopping experiences. Consumer behavior and shopping habits continue to evolve, with circular economy principles gaining importance. Brands prioritize brand perception, retail technology, and data analytics to stay competitive.
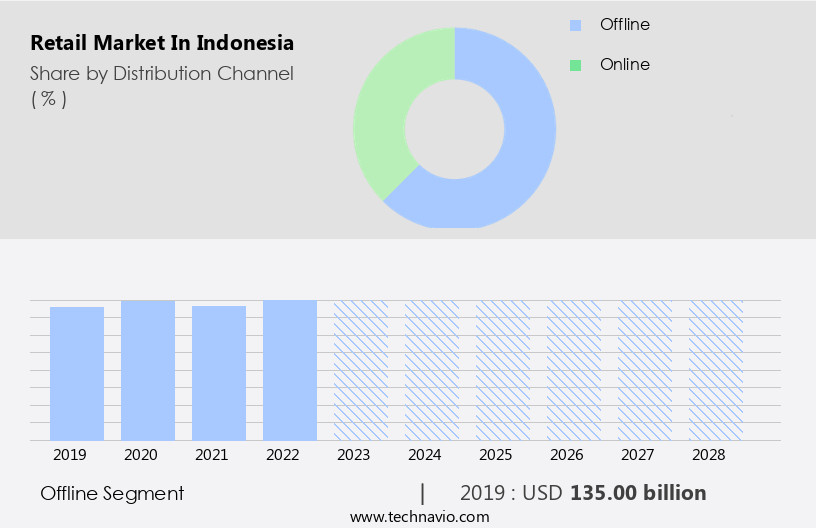
The Offline segment was valued at USD 135.00 billion in 2019 and showed a gradual increase during the forecast period.
Market Dynamics
"The Indonesia retail market is rapidly evolving, driven by the surge in omnichannel strategies that blend online and offline experiences to meet the demands of tech-savvy, price-sensitive consumers, with Greater Jakarta emerging as the leading region for retail growth."
- Rahul Somnath, Assistant Research Manager, Technavio
The Indonesia Retail Market is experiencing significant transformation, driven by strong Indonesia e-commerce growth and evolving consumer behavior Indonesia retail. The rising adoption of mobile wallets Indonesia retail is fundamentally changing payment landscapes, facilitating seamless transactions for both modern retail Indonesia and online channels. Retailers are increasingly focusing on omnichannel retail Indonesia strategies to provide integrated shopping experiences, catering to demands for convenience, including online grocery delivery Indonesia. This vibrant market also sees a growing emphasis on halal retail Indonesia and the rising popularity of private label brands Indonesia. Investments in retail technology Indonesia are crucial for enhancing customer experience retail Indonesia and optimizing retail supply chain Indonesia, especially for efficient last mile delivery Indonesia. The expansion of convenience stores Indonesia reflects urban density and consumer needs, while smartphones retail Indonesia continue to be a key driver for digital engagement. Overall, positive retail investment Indonesia signals strong future prospects within the dynamic retail market trends Indonesia.
What are the Indonesia Retail Market drivers leading to the rise in adoption of the Industry?
- The expansion of the retail landscape serves as the primary catalyst for market growth.
- In Indonesia, the retail market is experiencing significant shifts as traditional unorganized retail gives way to organized retailing. While small roadside stalls and companies will decline during the forecast period, large retail chains, including hypermarkets and supermarkets, will gain prominence. Organized retailing offers consumers the convenience of purchasing a wide range of items under one roof, primarily benefiting upper-middle-class and affluent consumers in urban areas. Cities such as Jakarta, Bandung, and Cirebon see a majority of grocery, food, and personal care product sales taking place in supermarkets. To cater to the diverse consumer base, retailers are adopting various strategies.
- Omnichannel retailing, which integrates online and offline channels, is gaining traction. Online marketplaces, such as e-commerce platforms, are increasingly popular, particularly among younger consumers. Specialty stores focusing on niche products and services are also emerging. Marketing efforts are also evolving, with influencer marketing and email marketing becoming essential tools. Social media marketing is prevalent, with platforms like Instagram and Facebook being widely used. Customer satisfaction is a key priority, leading to an increased focus on customer segmentation and personalized offerings. Payment gateways are being integrated into e-commerce platforms to facilitate seamless transactions. The market is embracing the circular economy, with initiatives to reduce waste and promote sustainable practices gaining momentum.
- In conclusion, the Indonesian retail market is undergoing transformative changes, driven by consumer preferences, technological advancements, and a growing focus on sustainability.
What are the Indonesia Retail Market trends shaping the Industry?
- The increasing popularity of local brands represents a significant market trend. This preference for homegrown products is a noteworthy development in today's business landscape.
- In Indonesia's retail market, consumer loyalty and brand preference play significant roles in purchase decisions. Approximately 75% of the population is aware of their product choices and where to buy them before making a decision. Local brands, such as PT Fujita Indonesia and PT Hino Motors Manufacturing Indonesia, cater to this market with competitive pricing strategies. Foreign companies, including non-premium brands, have also gained traction due to their ability to offer value for money. Digital payments and order fulfillment are increasingly important in the Indonesian retail landscape. Convenience stores and retail chains have adopted digital point-of-sale (POS) systems for inventory management and return handling.
- Direct-to-consumer brands have also emerged, utilizing digital marketing and augmented reality (AR) technology to engage customers. Foreign companies entering the Indonesian market may consider localization or acquisition strategies to penetrate the market effectively. Inventory management and efficient order fulfillment are crucial for maintaining customer satisfaction and reducing return rates. As the Indonesian retail market continues to evolve, digital marketing and AR technology will further influence consumer behavior and purchasing decisions.
How does Indonesia Retail Market face challenges during its growth?
- The underdeveloped infrastructure poses a significant challenge to the growth of the industry. In order to address this issue and foster industry expansion, investments in modernizing and improving infrastructure are essential.
- In Indonesia, the retail market presents significant opportunities for businesses, particularly in the areas of grocery stores and department stores. However, challenges persist due to the country's infrastructure limitations and dispersed population. Traditional warungs and minimarts remain popular among consumers, necessitating an extensive distribution network for companies to gain market traction. Innovations, such as data analytics and artificial intelligence, can help optimize supply chain and logistics networks, enabling more efficient operations. Big data plays a crucial role in understanding consumer behavior and preferences, allowing for targeted promotional campaigns. Mobile apps and mobile commerce are increasingly popular, necessitating fraud prevention measures.
- Green initiatives are gaining importance, with consumers favoring ethical sourcing and sustainable practices. Warehouse automation is another trend, streamlining operations and reducing costs. Despite these opportunities, challenges remain. Limited network connectivity and underdeveloped infrastructure continue to hinder the growth of retail businesses. Companies must navigate these challenges while adhering to ethical sourcing practices and ensuring fraud prevention in the digital space. By focusing on these areas, businesses can successfully penetrate the Indonesian retail market.
Exclusive Indonesia Retail Market Customer Landscape
The market forecasting report includes the adoption lifecycle of the market, covering from the innovator's stage to the laggard's stage. It focuses on adoption rates in different regions based on penetration. Furthermore, the report also includes key purchase criteria and drivers of price sensitivity to help companies evaluate and develop their market growth analysis strategies.

Customer Landscape
Key Companies & Market Insights
Companies are implementing various strategies, such as strategic alliances, market forecast partnerships, mergers and acquisitions, geographical expansion, and product/service launches, to enhance their presence in the market.
The market research and growth report includes detailed analyses of the competitive landscape of the market and information about key companies, including:
- PT Sumber Alfaria Trijaya Tbk
- PT Matahari Department Store Tbk
- PT Indomarco Prismatama
- PT Mitra Adiperkasa Tbk
- PT Erajaya Swasembada Tbk
- PT Ramayana Lestari Sentosa Tbk
- PT Lion Super Indo
- PT Trans Retail Indonesia
- PT Hero Supermarket Tbk
- PT Ace Hardware Indonesia Tbk
- PT MAP Active Adiperkasa Tbk
- PT Global Digital Niaga Tbk (Blibli)
- Shopee Indonesia
- Tokopedia
- PT Bukalapak.com Tbk
- Lazada Indonesia
- PT Informa Furnishings
- PT Catur Sentosa Adiprana Tbk
- PT Kawan Lama Sejahtera
- PT Modern Internasional Tbk
Qualitative and quantitative analysis of companies has been conducted to help clients understand the wider business environment as well as the strengths and weaknesses of key market players. Data is qualitatively analyzed to categorize companies as pure play, category-focused, industry-focused, and diversified; it is quantitatively analyzed to categorize companies as dominant, leading, strong, tentative, and weak.
Recent Development and News in Retail Market In Indonesia
- In January 2024, Indonesian e-commerce giant Tokopedia announced a strategic partnership with Shopee, a leading e-commerce platform in Southeast Asia, to strengthen their market position and enhance customer offerings. The collaboration aimed to provide better services and a wider selection of products to consumers in Indonesia (Tokopedia Press Release, 2024).
- In March 2024, Alibaba Group, the parent company of Lazada, invested an additional USD 1 billion in its Indonesian subsidiary to expand its logistics network and improve its technology infrastructure, further solidifying its presence in the Indonesian retail market (Reuters, 2024).
- In May 2024, the Indonesian government launched the "1 Million Micro, Small, and Medium Enterprises (MSMEs) Digitalization" initiative, providing grants and training programs to help MSMEs adopt digital technologies and sell their products online. This initiative aimed to support the growth of the retail sector and increase the number of digital transactions in the country (Indonesian Ministry of Cooperatives and SMEs, 2024).
- In February 2025, PT Indomaret, a leading convenience store chain in Indonesia, partnered with Grab, the ride-hailing and food delivery company, to expand its food delivery services through the Grab platform. This collaboration aimed to provide customers with a more convenient and accessible way to order food from Indomaret stores (Indomaret Press Release, 2025).
Research Analyst Overview
In the dynamic retail market of Indonesia, various sectors continue to evolve, integrating advanced technologies and strategies to meet evolving consumer demands. Pricing strategies adapt to market fluctuations, with retailers leveraging data analytics and machine learning to optimize offerings. Digital payments gain traction, with mobile apps and cashless transactions becoming the norm. Order fulfillment is streamlined through point-of-sale systems and inventory management, ensuring timely delivery and customer satisfaction. Purchase decisions are influenced by product reviews and direct-to-consumer brands, as well as augmented reality and virtual reality experiences. Convenience stores and grocery stores employ digital marketing tactics, including social media and email campaigns, to reach consumers.
Retail chains implement artificial intelligence and warehouse automation to enhance logistics networks and supply chain management. Consumer behavior is shaped by brand perception and loyalty programs, with retailers utilizing big data to gain insights into shopping habits and preferences. Last-mile delivery and omnichannel retailing are becoming essential, as consumers demand seamless shopping experiences across channels. Return rates are minimized through advanced fraud prevention measures and ethical sourcing practices. Retail technology continues to advance, with applications in retail analytics, promotional campaigns, and social commerce. Green initiatives and circular economy principles are gaining importance, as consumers become more environmentally conscious. The retail landscape in Indonesia remains vibrant and ever-changing, with retailers continuously adapting to meet consumer needs and expectations.
Dive into Technavio's robust research methodology, blending expert interviews, extensive data synthesis, and validated models for unparalleled Retail Market in Indonesia insights. See full methodology.
|
Market Scope |
|
|
Report Coverage |
Details |
|
Page number |
160 |
|
Base year |
2024 |
|
Historic period |
2019-2023 |
|
Forecast period |
2025-2029 |
|
Growth momentum & CAGR |
Accelerate at a CAGR of 4.7% |
|
Market growth 2025-2029 |
USD 49.9 billion |
|
Market structure |
Fragmented |
|
YoY growth 2024-2025(%) |
4.5 |
|
Competitive landscape |
Leading Companies, Market Positioning of Companies, Competitive Strategies, and Industry Risks |
What are the Key Data Covered in this Market Research Report?
- CAGR of the market during the forecast period
- Detailed information on factors that will drive the market growth and forecasting between 2025 and 2029
- Precise estimation of the size of the market and its contribution of the market in focus to the parent market
- Accurate predictions about upcoming market growth and trends and changes in consumer behaviour
- Growth of the market across Indonesia
- Thorough analysis of the market's competitive landscape and detailed information about companies
- Comprehensive analysis of factors that will challenge the growth of market companies
We can help! Our analysts can customize this market research report to meet your requirements Get in touch