Interventional Radiology Products Market Analysis, Size, and Forecast 2026-2030: North America (US, Canada, and Mexico), Europe (Germany, UK, and France), APAC (China, India, and Japan), South America (Brazil, Argentina, and Colombia), Middle East and Africa (Saudi Arabia, UAE, and Turkey), Asia, Rest of World (ROW)

Interventional Radiology Products Market Analysis, Size, and Forecast 2026-2030:
North America (US, Canada, and Mexico), Europe (Germany, UK, and France), APAC (China, India, and Japan), South America (Brazil, Argentina, and Colombia), Middle East and Africa (Saudi Arabia, UAE, and Turkey), Asia, Rest of World (ROW)

Published: Dec 2025 329 Pages SKU: IRTNTR80163

Market Overview at a Glance

$6.72 B
Market Opportunity
7.6%
CAGR 2025 - 2030
32.6%
North America Growth
$5.68 B
Stents segment 2024

Interventional Radiology Products Market Size 2026-2030

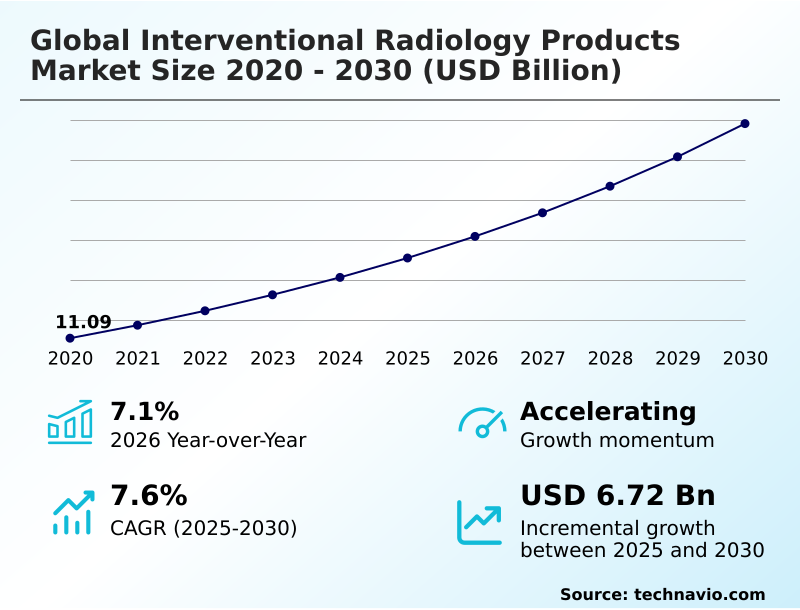
The interventional radiology products market size is valued to increase by USD 6.72 billion, at a CAGR of 7.6% from 2025 to 2030. Increasing global burden of chronic diseases and aging demographics will drive the interventional radiology products market.

Major Market Trends & Insights

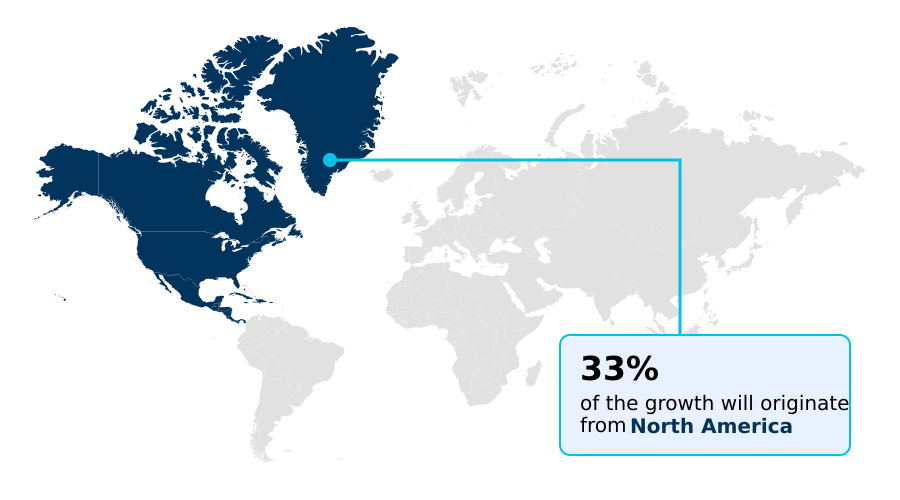
  • North America dominated the market and accounted for a 32.6% growth during the forecast period.
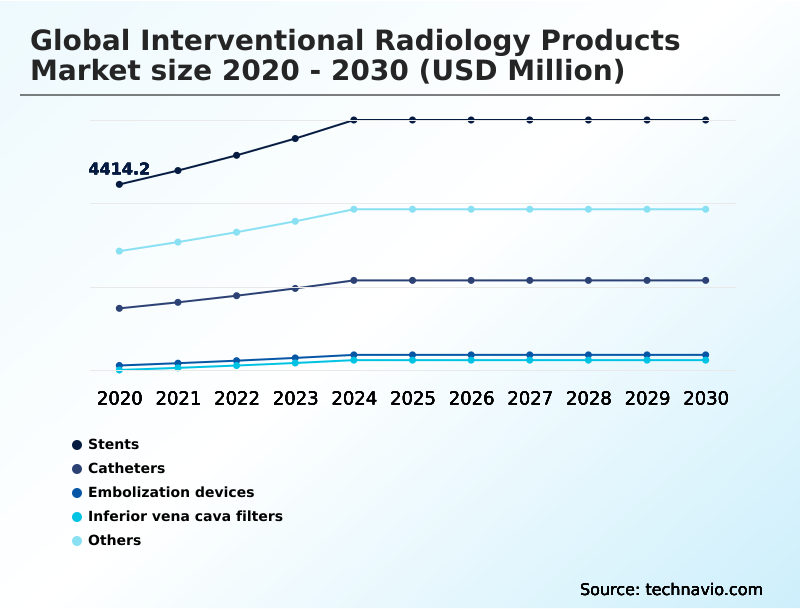
  • By Type - Stents segment was valued at USD 5.68 billion in 2024
  • By Application - Cardiology segment accounted for the largest market revenue share in 2024

Market Size & Forecast

  • Market Opportunities: USD 10.73 billion
  • Market Future Opportunities: USD 6.72 billion
  • CAGR from 2025 to 2030 : 7.6%

Market Summary

  • The interventional radiology products market is undergoing substantial expansion, driven by a clinical paradigm shift toward minimally invasive, image-guided procedures. This growth is fundamentally supported by the rising global incidence of chronic diseases and an aging population, creating a sustained demand for advanced diagnostic and therapeutic tools.
  • Technologies such as drug-eluting stents and mechanical thrombectomy devices have revolutionized treatment for cardiovascular and neurological conditions. Simultaneously, the ascendancy of interventional oncology, utilizing techniques like transarterial chemoembolization and percutaneous tumor ablation, has established a new pillar in cancer care. A key business scenario involves optimizing hospital supply chains for high-volume procedures.
  • By implementing just-in-time inventory systems for catheter-based systems and steerable guiding sheaths, facilities can reduce holding costs by over 20% while ensuring critical device availability. However, the market is constrained by high product costs, stringent regulatory pathways, and a scarcity of trained interventionalists.
  • The integration of robotics and AI-powered imaging promises to enhance precision and efficiency, but navigating intense pricing pressures from group purchasing organizations remains a critical strategic focus for manufacturers aiming for sustainable operations.

What will be the Size of the Interventional Radiology Products Market during the forecast period?

Get Key Insights on Market Forecast (PDF) Request Free Sample

How is the Interventional Radiology Products Market Segmented?

The interventional radiology products industry research report provides comprehensive data (region-wise segment analysis), with forecasts and estimates in "USD million" for the period 2026-2030, as well as historical data from 2020-2024 for the following segments.

  • Type
    • Stents
    • Catheters
    • Embolization devices
    • Inferior vena cava filters
    • Others
  • Application
    • Cardiology
    • Urology and nephrology
    • Oncology
    • Gastroenterology
    • Others
  • End-user
    • Hospitals
    • ASCs
    • Diagnostic imaging centers
  • Geography
    • North America
      • US
      • Canada
      • Mexico
    • Europe
      • Germany
      • UK
      • France
    • Asia
    • Rest of World (ROW)

By Type Insights

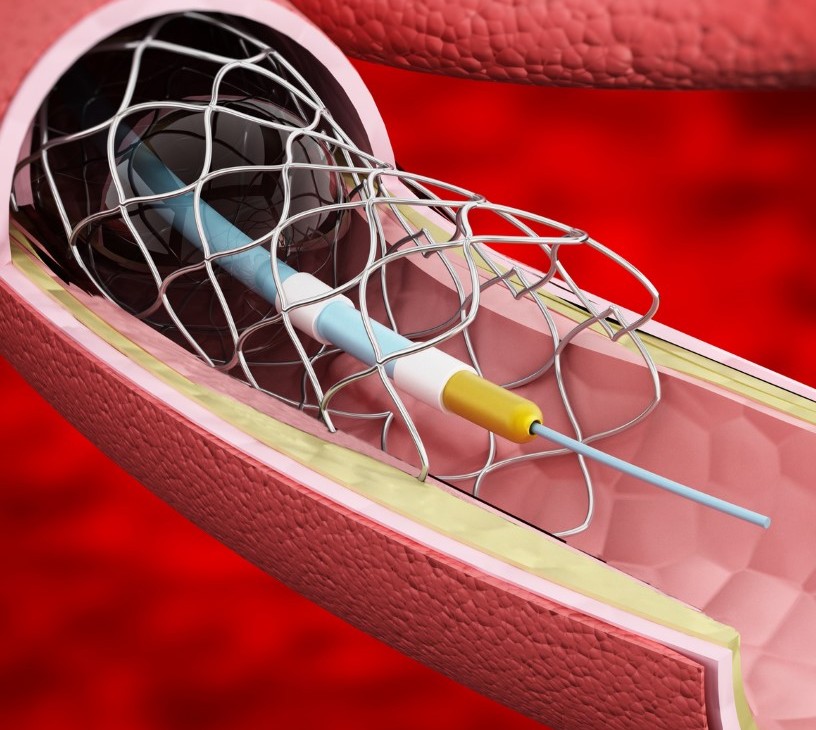
The stents segment is estimated to witness significant growth during the forecast period.

Stents are a cornerstone of modern practice, indispensable for maintaining patency in various anatomical structures, most notably blood vessels.

This segment includes a wide array of products tailored for specific clinical scenarios in cardiovascular disease treatment and peripheral artery disease interventions. The evolution from bare-metal devices to advanced drug-eluting stents and bioresorbable vascular scaffolds has significantly improved long-term outcomes.

Innovation continues with the development of specialized products such as flow-diverting stents for complex neurovascular intervention and the peripheral self-expanding stent.

Expanding applications now include ureteral stents and devices for endovascular aneurysm repair, driven by a clinical focus on enhancing patient quality of life.

This alignment with value-based healthcare models, where procedures using atherectomy devices improve efficiency by 15%, solidifies their role in both hospital and outpatient procedure settings.

Request Free Sample

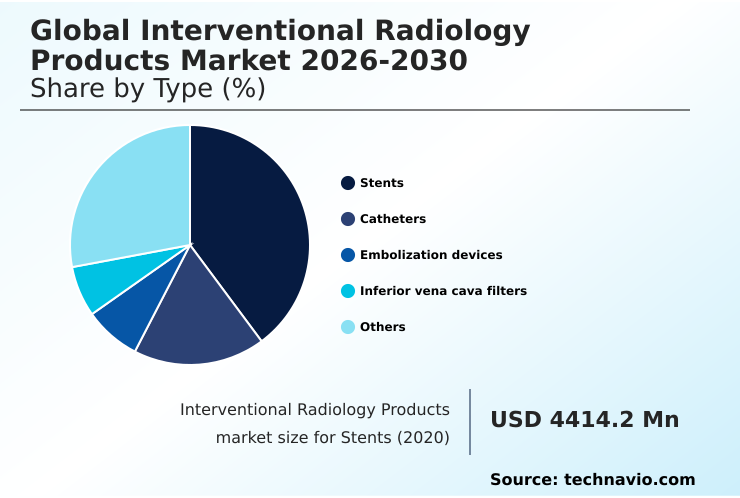
The Stents segment was valued at USD 5.68 billion in 2024 and showed a gradual increase during the forecast period.

Request Free Sample

Regional Analysis

North America is estimated to contribute 32.6% to the growth of the global market during the forecast period.Technavio’s analysts have elaborately explained the regional trends and drivers that shape the market during the forecast period.

See How Interventional Radiology Products Market Demand is Rising in North America Request Free Sample

North America is the largest regional market, distinguished by high healthcare expenditure and rapid adoption of advanced technologies like mechanical thrombectomy devices and catheter-based systems.

The region's sophisticated infrastructure supports a high volume of procedures in hospitals and a growing number of ambulatory surgical centers. In contrast, Asia is the fastest-growing market, led by expanding healthcare access in China and India.

This growth is fueling demand for interventional oncology therapies, including transarterial chemoembolization and radioembolization microspheres for locoregional tumor treatment. Europe represents a mature market, with strong demand for cryoablation systems and hemostatic devices.

However, it faces stringent regulations and pricing pressures that influence technology adoption. Implementing centralized inventory management across multiple office-based labs can decrease supply waste by 18%.

The Rest of World (ROW) region, encompassing South America and the Middle East, shows significant potential for trauma care embolization but is constrained by infrastructure gaps and complex volume-based procurement policies.

Market Dynamics

Our researchers analyzed the data with 2025 as the base year, along with the key drivers, trends, and challenges. A holistic analysis of drivers will help companies refine their marketing strategies to gain a competitive advantage.

  • The strategic focus for manufacturers in the interventional radiology products market is increasingly on demonstrating clear clinical differentiation and economic value. For instance, the debate over drug-eluting stents vs bioresorbable scaffolds continues, with decisions often hinging on long-term patient outcomes and cost-effectiveness analyses. Similarly, data on microwave vs radiofrequency ablation efficacy is critical for oncology departments making capital investment decisions.
  • In neurology, the use of liquid embolic agents in neurovascular procedures is expanding, but it requires extensive physician training, impacting adoption rates. The specific catheter design for chronic total occlusions is a key competitive advantage, as it directly relates to procedural success rates.
  • In stroke care, stent retriever thrombectomy success rates are a primary metric, influencing hospital purchasing protocols for advanced thrombectomy systems. The development of a drug-coated balloon for in-stent restenosis addresses a significant unmet clinical need. In oncology, the choice of embolic microspheres for liver tumors depends on precise calibration and delivery.
  • The growth of robotic catheter systems for peripheral intervention is tied to demonstrating improved navigability, while fusion imaging for complex aortic repair must prove it reduces procedure time and radiation exposure. Compliance teams closely monitor vena cava filter retrieval complication rates, which have become a focus of regulatory scrutiny.
  • The hemostatic device access site closure time is a key efficiency metric in high-volume catheterization labs. Finally, analyzing the regulatory pathways for novel embolization devices is a critical business function, with proactive planning reducing approval timelines by several months compared to reactive strategies.

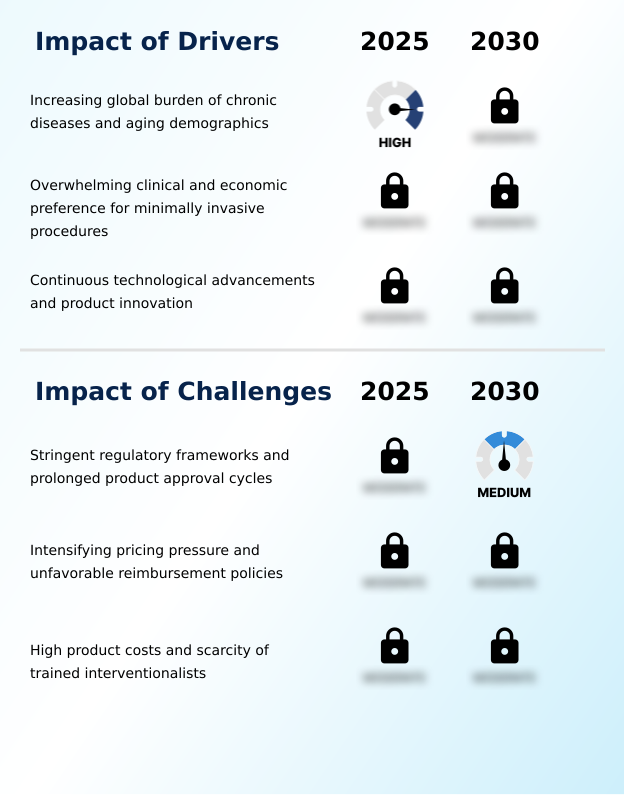
What are the key market drivers leading to the rise in the adoption of Interventional Radiology Products Industry?

  • The increasing global burden of chronic diseases, coupled with aging demographics, is a fundamental driver creating an expanding patient base for minimally invasive procedures.

  • The overwhelming preference for minimally invasive procedures is a primary market driver, embraced by clinicians and healthcare systems for its clinical and economic benefits.
  • This shift fuels continuous innovation in device engineering, evident in technologies like the steerable guiding sheath and radiopaque liquid embolic agent, which enhance safety in complex endovascular therapy.
  • Advances in microcatheter technology and hydrophilic guidewires enable physicians to perform intricate neurovascular intervention and prostate artery embolization with greater precision. For example, the latest aspiration catheters have improved first-pass clot removal rates by up to 15%.
  • This preference extends to routine procedures such as percutaneous nephrostomy and the placement of tunneled central venous catheters for vascular access management, driving procedural volumes and incentivizing investment in efficient, high-performance tools, despite pricing pressures from group purchasing organizations.

What are the market trends shaping the Interventional Radiology Products Industry?

  • A procedural shift toward outpatient settings, including ambulatory surgical centers, represents a significant market trend. This migration is driven by economic, clinical, and patient-centric incentives.

  • The market is being reshaped by the convergence of devices with digital technologies. The integration of AI-powered imaging and fusion imaging software into image-guided therapy systems is enhancing precision and enabling clinical decision support, with some platforms improving lesion targeting accuracy by over 20%.
  • A key trend is the development of robotics-ready devices and robotic-assisted catheters, which promise to improve procedural stability and reduce operator radiation exposure. Innovations like interventional MRI technologies are opening new frontiers for real-time guidance. This digital shift influences device design for technologies like microwave ablation systems and stent retrievers.
  • The trend is also impacted by evolving medical device regulation, which now requires more rigorous post-market surveillance for both novel and established products, including simple biopsy needles, adding a layer of complexity to innovation.

What challenges does the Interventional Radiology Products Industry face during its growth?

  • Stringent regulatory frameworks and prolonged product approval cycles present a significant challenge, creating high barriers to entry and potentially slowing the pace of innovation.

  • High product costs and intensifying pricing pressures present significant market challenges. The sophisticated engineering behind devices for structural heart disease repair, such as those for transcatheter aortic valve replacement, results in high prices that can be a barrier to adoption, particularly in systems with tight budgets.
  • Healthcare systems increasingly use health technology assessment and volume-based procurement to negotiate lower prices, impacting margins on products like atherectomy balloons and inferior vena cava filters. This pressure is also felt in ambulatory surgical centers, where procedures like vertebroplasty and kyphoplasty must demonstrate clear cost-effectiveness.
  • In some value-based healthcare models, bundled payments for procedures using drainage catheters or embolic plug systems have led to a 10% reduction in overall reimbursement, forcing providers to scrutinize device costs more closely.

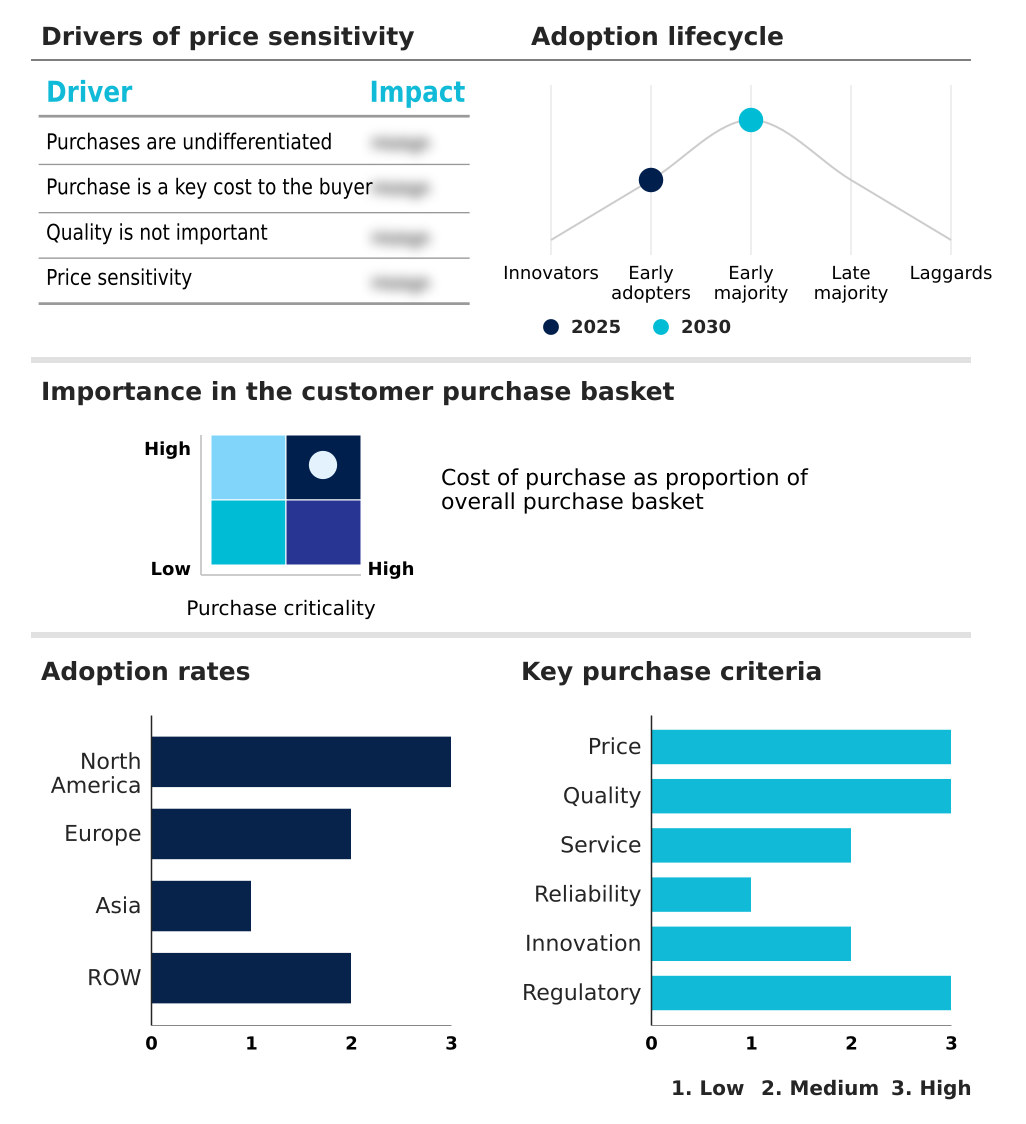
Exclusive Technavio Analysis on Customer Landscape

The interventional radiology products market forecasting report includes the adoption lifecycle of the market, covering from the innovator’s stage to the laggard’s stage. It focuses on adoption rates in different regions based on penetration. Furthermore, the interventional radiology products market report also includes key purchase criteria and drivers of price sensitivity to help companies evaluate and develop their market growth analysis strategies.

Customer Landscape of Interventional Radiology Products Industry

Competitive Landscape

Companies are implementing various strategies, such as strategic alliances, interventional radiology products market forecast, partnerships, mergers and acquisitions, geographical expansion, and product/service launches, to enhance their presence in the industry.

Abbott Laboratories - A research analyst viewpoint indicates the offerings include advanced vascular closure devices, flexible stent systems with chronic outward force, and catheters designed for superior procedural visualization.

The industry research and growth report includes detailed analyses of the competitive landscape of the market and information about key companies, including:

  • Abbott Laboratories
  • Adept Medical Ltd.
  • ASAHI INTECC CO. LTD.
  • Blueneem Medical Devices
  • Boston Scientific Corp.
  • Cardinal Health Inc.
  • Cook Group Inc.
  • GE Healthcare Technologies
  • Guerbet
  • ILUMARK GmbH
  • INRAD Inc.
  • Koninklijke Philips NV
  • Merit Medical Systems Inc.
  • Seda SpA
  • Siemens Healthineers AG
  • Teleflex Inc.
  • Terumo Corp.
  • Tokai Medical Products Inc.
  • Uresil LLC

Qualitative and quantitative analysis of companies has been conducted to help clients understand the wider business environment as well as the strengths and weaknesses of key industry players. Data is qualitatively analyzed to categorize companies as pure play, category-focused, industry-focused, and diversified; it is quantitatively analyzed to categorize companies as dominant, leading, strong, tentative, and weak.

Recent Development and News in Interventional radiology products market

  • In November 2024, CILBA announced it received ANVISA regulatory approval to market its DIALEV-247 long-term hemodialysis catheter in Brazil, marking a strategic entry into the South American market.
  • In January 2025, Argon Medical expanded its interventional oncology portfolio through the acquisition of the SeQure and DraKon microcatheters from Accurate Medical Therapeutics, enhancing its capabilities in targeted therapeutic delivery.
  • In January 2025, Siemens Healthineers unveiled its Optiq AI, an AI-powered imaging pipeline integrated into its advanced systems to deliver real-time noise reduction and automated exposure optimization for complex procedures.
  • In May 2025, Merit Medical Systems acquired Biolife Delaware, LLC for approximately $120 million, gaining access to specialized hemostatic devices like StatSeal and WoundSeal to strengthen its access site closure offerings.

Dive into Technavio’s robust research methodology, blending expert interviews, extensive data synthesis, and validated models for unparalleled Interventional Radiology Products Market insights. See full methodology.

Market Scope
Page number 329
Base year 2025
Historic period 2020-2024
Forecast period 2026-2030
Growth momentum & CAGR Accelerate at a CAGR of 7.6%
Market growth 2026-2030 USD 6717.6 million
Market structure Fragmented
YoY growth 2025-2026(%) 7.1%
Key countries US, Canada, Mexico, Germany, UK, France, Italy, Spain, The Netherlands, China, India, Japan, South Korea, Indonesia, Thailand, Brazil, Saudi Arabia, UAE, Turkey, Argentina, Colombia, South Africa and Israel
Competitive landscape Leading Companies, Market Positioning of Companies, Competitive Strategies, and Industry Risks

Request Free Sample

Research Analyst Overview

  • The interventional radiology products market is characterized by relentless technological advancement, fundamentally expanding the scope of minimally invasive care. The continuous evolution from basic instruments to sophisticated catheter-based systems, including drug-eluting stents and bioresorbable vascular scaffolds, addresses complex clinical needs.
  • Key sub-fields like interventional oncology are propelled by innovations in transarterial chemoembolization and percutaneous tumor ablation, while neurology benefits from advanced mechanical thrombectomy devices and flow-diverting stents. A critical boardroom consideration is aligning R&D investment with evolving regulatory landscapes.
  • For example, developing a new radiopaque liquid embolic agent or steerable guiding sheath now requires navigating stricter post-market surveillance protocols, impacting long-term compliance budgets. The integration of fusion imaging software and AI-powered imaging into image-guided therapy systems is enhancing procedural precision, with some centers reporting a 25% reduction in radiation exposure.
  • The development of atherectomy balloons, drug-coated balloons, and robotic-assisted catheters further underscores the industry's focus on improving outcomes in endovascular aneurysm repair and beyond.

What are the Key Data Covered in this Interventional Radiology Products Market Research and Growth Report?

  • What is the expected growth of the Interventional Radiology Products Market between 2026 and 2030?

    • USD 6.72 billion, at a CAGR of 7.6%

  • What segmentation does the market report cover?

    • The report is segmented by Type (Stents, Catheters, Embolization devices, Inferior vena cava filters, and Others), Application (Cardiology, Urology and nephrology, Oncology, Gastroenterology, and Others), End-user (Hospitals, ASCs, and Diagnostic imaging centers) and Geography (North America, Europe, Asia, Rest of World (ROW))

  • Which regions are analyzed in the report?

    • North America, Europe, Asia and Rest of World (ROW)

  • What are the key growth drivers and market challenges?

    • Increasing global burden of chronic diseases and aging demographics, Stringent regulatory frameworks and prolonged product approval cycles

  • Who are the major players in the Interventional Radiology Products Market?

    • Abbott Laboratories, Adept Medical Ltd., ASAHI INTECC CO. LTD., Blueneem Medical Devices, Boston Scientific Corp., Cardinal Health Inc., Cook Group Inc., GE Healthcare Technologies, Guerbet, ILUMARK GmbH, INRAD Inc., Koninklijke Philips NV, Merit Medical Systems Inc., Seda SpA, Siemens Healthineers AG, Teleflex Inc., Terumo Corp., Tokai Medical Products Inc. and Uresil LLC

Market Research Insights

  • The market is shaped by a confluence of clinical and economic dynamics driving a preference for minimally invasive procedures. The migration of care to outpatient procedure settings and office-based labs is a key structural change, with facilities reporting a 15% improvement in patient throughput for routine vascular access management.
  • This shift is reinforced by value-based healthcare models that prioritize cost-effective outcomes. The growth of specialized fields like interventional oncology therapies and neurovascular intervention is creating demand for premium technologies. At the same time, health technology assessment bodies and group purchasing organizations exert significant pricing pressure, forcing manufacturers to demonstrate clear economic benefits.
  • Aligning product innovation with these cost-containment goals is critical, as integrated AI-powered imaging platforms have demonstrated the ability to reduce procedural times by up to 12%, directly addressing efficiency demands.

We can help! Our analysts can customize this interventional radiology products market research report to meet your requirements.

Get in touch

1. Executive Summary

1.1 Market overview

Executive Summary - Chart on Market Overview
Executive Summary - Data Table on Market Overview
Executive Summary - Chart on Global Market Characteristics
Executive Summary - Chart on Market by Geography
Executive Summary - Chart on Market Segmentation by Type
Executive Summary - Chart on Market Segmentation by Application
Executive Summary - Chart on Market Segmentation by End-user
Executive Summary - Chart on Incremental Growth
Executive Summary - Data Table on Incremental Growth
Executive Summary - Chart on Company Market Positioning

2. Technavio Analysis

2.1 Analysis of price sensitivity, lifecycle, customer purchase basket, adoption rates, and purchase criteria

2.2 Criticality of inputs and Factors of differentiation

Chart on Overview on criticality of inputs and factors of differentiation

2.3 Factors of disruption

Chart on Overview on factors of disruption

2.4 Impact of drivers and challenges

Chart on Impact of drivers and challenges in 2025 and 2030

3. Market Landscape

3.1 Market ecosystem

Chart on Parent Market
Data Table on - Parent Market

3.2 Market characteristics

Chart on Market characteristics analysis

3.3 Value chain analysis

Chart on Value chain analysis

4. Market Sizing

4.1 Market definition

Data Table on Offerings of companies included in the market definition

4.2 Market segment analysis

Market segments

4.3 Market size 2025

4.4 Market outlook: Forecast for 2025-2030

Chart on Global - Market size and forecast 2025-2030 ($ million)
Data Table on Global - Market size and forecast 2025-2030 ($ million)
Chart on Global Market: Year-over-year growth 2025-2030 (%)
Data Table on Global Market: Year-over-year growth 2025-2030 (%)

5. Historic Market Size

5.1 Global Interventional Radiology Products Market 2020 - 2024

Historic Market Size - Data Table on Global Interventional Radiology Products Market 2020 - 2024 ($ million)

5.2 Type segment analysis 2020 - 2024

Historic Market Size - Type Segment 2020 - 2024 ($ million)

5.3 Application segment analysis 2020 - 2024

Historic Market Size - Application Segment 2020 - 2024 ($ million)

5.4 End-user segment analysis 2020 - 2024

Historic Market Size - End-user Segment 2020 - 2024 ($ million)

5.5 Geography segment analysis 2020 - 2024

Historic Market Size - Geography Segment 2020 - 2024 ($ million)

5.6 Country segment analysis 2020 - 2024

Historic Market Size - Country Segment 2020 - 2024 ($ million)

6. Qualitative Analysis

6.1 The AI impact on global interventional radiology products market

7. Five Forces Analysis

7.1 Five forces summary

Five forces analysis - Comparison between 2025 and 2030

7.2 Bargaining power of buyers

Bargaining power of buyers - Impact of key factors 2025 and 2030

7.3 Bargaining power of suppliers

Bargaining power of suppliers - Impact of key factors in 2025 and 2030

7.4 Threat of new entrants

Threat of new entrants - Impact of key factors in 2025 and 2030

7.5 Threat of substitutes

Threat of substitutes - Impact of key factors in 2025 and 2030

7.6 Threat of rivalry

Threat of rivalry - Impact of key factors in 2025 and 2030

7.7 Market condition

Chart on Market condition - Five forces 2025 and 2030

8. Market Segmentation by Type

8.1 Market segments

Chart on Type - Market share 2025-2030 (%)
Data Table on Type - Market share 2025-2030 (%)

8.2 Comparison by Type

Chart on Comparison by Type
Data Table on Comparison by Type

8.3 Stents - Market size and forecast 2025-2030

Chart on Stents - Market size and forecast 2025-2030 ($ million)
Data Table on Stents - Market size and forecast 2025-2030 ($ million)
Chart on Stents - Year-over-year growth 2025-2030 (%)
Data Table on Stents - Year-over-year growth 2025-2030 (%)

8.4 Catheters - Market size and forecast 2025-2030

Chart on Catheters - Market size and forecast 2025-2030 ($ million)
Data Table on Catheters - Market size and forecast 2025-2030 ($ million)
Chart on Catheters - Year-over-year growth 2025-2030 (%)
Data Table on Catheters - Year-over-year growth 2025-2030 (%)

8.5 Embolization devices - Market size and forecast 2025-2030

Chart on Embolization devices - Market size and forecast 2025-2030 ($ million)
Data Table on Embolization devices - Market size and forecast 2025-2030 ($ million)
Chart on Embolization devices - Year-over-year growth 2025-2030 (%)
Data Table on Embolization devices - Year-over-year growth 2025-2030 (%)

8.6 Inferior vena cava filters - Market size and forecast 2025-2030

Chart on Inferior vena cava filters - Market size and forecast 2025-2030 ($ million)
Data Table on Inferior vena cava filters - Market size and forecast 2025-2030 ($ million)
Chart on Inferior vena cava filters - Year-over-year growth 2025-2030 (%)
Data Table on Inferior vena cava filters - Year-over-year growth 2025-2030 (%)

8.7 Others - Market size and forecast 2025-2030

Chart on Others - Market size and forecast 2025-2030 ($ million)
Data Table on Others - Market size and forecast 2025-2030 ($ million)
Chart on Others - Year-over-year growth 2025-2030 (%)
Data Table on Others - Year-over-year growth 2025-2030 (%)

8.8 Market opportunity by Type

Market opportunity by Type ($ million)
Data Table on Market opportunity by Type ($ million)

9. Market Segmentation by Application

9.1 Market segments

Chart on Application - Market share 2025-2030 (%)
Data Table on Application - Market share 2025-2030 (%)

9.2 Comparison by Application

Chart on Comparison by Application
Data Table on Comparison by Application

9.3 Cardiology - Market size and forecast 2025-2030

Chart on Cardiology - Market size and forecast 2025-2030 ($ million)
Data Table on Cardiology - Market size and forecast 2025-2030 ($ million)
Chart on Cardiology - Year-over-year growth 2025-2030 (%)
Data Table on Cardiology - Year-over-year growth 2025-2030 (%)

9.4 Urology and nephrology - Market size and forecast 2025-2030

Chart on Urology and nephrology - Market size and forecast 2025-2030 ($ million)
Data Table on Urology and nephrology - Market size and forecast 2025-2030 ($ million)
Chart on Urology and nephrology - Year-over-year growth 2025-2030 (%)
Data Table on Urology and nephrology - Year-over-year growth 2025-2030 (%)

9.5 Oncology - Market size and forecast 2025-2030

Chart on Oncology - Market size and forecast 2025-2030 ($ million)
Data Table on Oncology - Market size and forecast 2025-2030 ($ million)
Chart on Oncology - Year-over-year growth 2025-2030 (%)
Data Table on Oncology - Year-over-year growth 2025-2030 (%)

9.6 Gastroenterology - Market size and forecast 2025-2030

Chart on Gastroenterology - Market size and forecast 2025-2030 ($ million)
Data Table on Gastroenterology - Market size and forecast 2025-2030 ($ million)
Chart on Gastroenterology - Year-over-year growth 2025-2030 (%)
Data Table on Gastroenterology - Year-over-year growth 2025-2030 (%)

9.7 Others - Market size and forecast 2025-2030

Chart on Others - Market size and forecast 2025-2030 ($ million)
Data Table on Others - Market size and forecast 2025-2030 ($ million)
Chart on Others - Year-over-year growth 2025-2030 (%)
Data Table on Others - Year-over-year growth 2025-2030 (%)

9.8 Market opportunity by Application

Market opportunity by Application ($ million)
Data Table on Market opportunity by Application ($ million)

10. Market Segmentation by End-user

10.1 Market segments

Chart on End-user - Market share 2025-2030 (%)
Data Table on End-user - Market share 2025-2030 (%)

10.2 Comparison by End-user

Chart on Comparison by End-user
Data Table on Comparison by End-user

10.3 Hospitals - Market size and forecast 2025-2030

Chart on Hospitals - Market size and forecast 2025-2030 ($ million)
Data Table on Hospitals - Market size and forecast 2025-2030 ($ million)
Chart on Hospitals - Year-over-year growth 2025-2030 (%)
Data Table on Hospitals - Year-over-year growth 2025-2030 (%)

10.4 ASCs - Market size and forecast 2025-2030

Chart on ASCs - Market size and forecast 2025-2030 ($ million)
Data Table on ASCs - Market size and forecast 2025-2030 ($ million)
Chart on ASCs - Year-over-year growth 2025-2030 (%)
Data Table on ASCs - Year-over-year growth 2025-2030 (%)

10.5 Diagnostic imaging centers - Market size and forecast 2025-2030

Chart on Diagnostic imaging centers - Market size and forecast 2025-2030 ($ million)
Data Table on Diagnostic imaging centers - Market size and forecast 2025-2030 ($ million)
Chart on Diagnostic imaging centers - Year-over-year growth 2025-2030 (%)
Data Table on Diagnostic imaging centers - Year-over-year growth 2025-2030 (%)

10.6 Market opportunity by End-user

Market opportunity by End-user ($ million)
Data Table on Market opportunity by End-user ($ million)

11. Customer Landscape

11.1 Customer landscape overview

Analysis of price sensitivity, lifecycle, customer purchase basket, adoption rates, and purchase criteria

12. Geographic Landscape

12.1 Geographic segmentation

Chart on Market share by geography 2025-2030 (%)
Data Table on Market share by geography 2025-2030 (%)

12.2 Geographic comparison

Chart on Geographic comparison
Data Table on Geographic comparison

12.3 North America - Market size and forecast 2025-2030

Chart on North America - Market size and forecast 2025-2030 ($ million)
Data Table on North America - Market size and forecast 2025-2030 ($ million)
Chart on North America - Year-over-year growth 2025-2030 (%)
Data Table on North America - Year-over-year growth 2025-2030 (%)
Chart on Regional Comparison - North America
Data Table on Regional Comparison - North America

12.3.1 US - Market size and forecast 2025-2030

Chart on US - Market size and forecast 2025-2030 ($ million)
Data Table on US - Market size and forecast 2025-2030 ($ million)
Chart on US - Year-over-year growth 2025-2030 (%)
Data Table on US - Year-over-year growth 2025-2030 (%)

12.3.2 Canada - Market size and forecast 2025-2030

Chart on Canada - Market size and forecast 2025-2030 ($ million)
Data Table on Canada - Market size and forecast 2025-2030 ($ million)
Chart on Canada - Year-over-year growth 2025-2030 (%)
Data Table on Canada - Year-over-year growth 2025-2030 (%)

12.3.3 Mexico - Market size and forecast 2025-2030

Chart on Mexico - Market size and forecast 2025-2030 ($ million)
Data Table on Mexico - Market size and forecast 2025-2030 ($ million)
Chart on Mexico - Year-over-year growth 2025-2030 (%)
Data Table on Mexico - Year-over-year growth 2025-2030 (%)

12.4 Europe - Market size and forecast 2025-2030

Chart on Europe - Market size and forecast 2025-2030 ($ million)
Data Table on Europe - Market size and forecast 2025-2030 ($ million)
Chart on Europe - Year-over-year growth 2025-2030 (%)
Data Table on Europe - Year-over-year growth 2025-2030 (%)
Chart on Regional Comparison - Europe
Data Table on Regional Comparison - Europe

12.4.1 Germany - Market size and forecast 2025-2030

Chart on Germany - Market size and forecast 2025-2030 ($ million)
Data Table on Germany - Market size and forecast 2025-2030 ($ million)
Chart on Germany - Year-over-year growth 2025-2030 (%)
Data Table on Germany - Year-over-year growth 2025-2030 (%)

12.4.2 UK - Market size and forecast 2025-2030

Chart on UK - Market size and forecast 2025-2030 ($ million)
Data Table on UK - Market size and forecast 2025-2030 ($ million)
Chart on UK - Year-over-year growth 2025-2030 (%)
Data Table on UK - Year-over-year growth 2025-2030 (%)

12.4.3 France - Market size and forecast 2025-2030

Chart on France - Market size and forecast 2025-2030 ($ million)
Data Table on France - Market size and forecast 2025-2030 ($ million)
Chart on France - Year-over-year growth 2025-2030 (%)
Data Table on France - Year-over-year growth 2025-2030 (%)

12.4.4 Italy - Market size and forecast 2025-2030

Chart on Italy - Market size and forecast 2025-2030 ($ million)
Data Table on Italy - Market size and forecast 2025-2030 ($ million)
Chart on Italy - Year-over-year growth 2025-2030 (%)
Data Table on Italy - Year-over-year growth 2025-2030 (%)

12.4.5 Spain - Market size and forecast 2025-2030

Chart on Spain - Market size and forecast 2025-2030 ($ million)
Data Table on Spain - Market size and forecast 2025-2030 ($ million)
Chart on Spain - Year-over-year growth 2025-2030 (%)
Data Table on Spain - Year-over-year growth 2025-2030 (%)

12.4.6 The Netherlands - Market size and forecast 2025-2030

Chart on The Netherlands - Market size and forecast 2025-2030 ($ million)
Data Table on The Netherlands - Market size and forecast 2025-2030 ($ million)
Chart on The Netherlands - Year-over-year growth 2025-2030 (%)
Data Table on The Netherlands - Year-over-year growth 2025-2030 (%)

12.5 Asia - Market size and forecast 2025-2030

Chart on Asia - Market size and forecast 2025-2030 ($ million)
Data Table on Asia - Market size and forecast 2025-2030 ($ million)
Chart on Asia - Year-over-year growth 2025-2030 (%)
Data Table on Asia - Year-over-year growth 2025-2030 (%)
Chart on Regional Comparison - Asia
Data Table on Regional Comparison - Asia

12.5.1 China - Market size and forecast 2025-2030

Chart on China - Market size and forecast 2025-2030 ($ million)
Data Table on China - Market size and forecast 2025-2030 ($ million)
Chart on China - Year-over-year growth 2025-2030 (%)
Data Table on China - Year-over-year growth 2025-2030 (%)

12.5.2 India - Market size and forecast 2025-2030

Chart on India - Market size and forecast 2025-2030 ($ million)
Data Table on India - Market size and forecast 2025-2030 ($ million)
Chart on India - Year-over-year growth 2025-2030 (%)
Data Table on India - Year-over-year growth 2025-2030 (%)

12.5.3 Japan - Market size and forecast 2025-2030

Chart on Japan - Market size and forecast 2025-2030 ($ million)
Data Table on Japan - Market size and forecast 2025-2030 ($ million)
Chart on Japan - Year-over-year growth 2025-2030 (%)
Data Table on Japan - Year-over-year growth 2025-2030 (%)

12.5.4 South Korea - Market size and forecast 2025-2030

Chart on South Korea - Market size and forecast 2025-2030 ($ million)
Data Table on South Korea - Market size and forecast 2025-2030 ($ million)
Chart on South Korea - Year-over-year growth 2025-2030 (%)
Data Table on South Korea - Year-over-year growth 2025-2030 (%)

12.5.5 Indonesia - Market size and forecast 2025-2030

Chart on Indonesia - Market size and forecast 2025-2030 ($ million)
Data Table on Indonesia - Market size and forecast 2025-2030 ($ million)
Chart on Indonesia - Year-over-year growth 2025-2030 (%)
Data Table on Indonesia - Year-over-year growth 2025-2030 (%)

12.5.6 Thailand - Market size and forecast 2025-2030

Chart on Thailand - Market size and forecast 2025-2030 ($ million)
Data Table on Thailand - Market size and forecast 2025-2030 ($ million)
Chart on Thailand - Year-over-year growth 2025-2030 (%)
Data Table on Thailand - Year-over-year growth 2025-2030 (%)

12.6 Rest of World (ROW) - Market size and forecast 2025-2030

Chart on Rest of World (ROW) - Market size and forecast 2025-2030 ($ million)
Data Table on Rest of World (ROW) - Market size and forecast 2025-2030 ($ million)
Chart on Rest of World (ROW) - Year-over-year growth 2025-2030 (%)
Data Table on Rest of World (ROW) - Year-over-year growth 2025-2030 (%)
Chart on Regional Comparison - Rest of World (ROW)
Data Table on Regional Comparison - Rest of World (ROW)

12.6.1 Brazil - Market size and forecast 2025-2030

Chart on Brazil - Market size and forecast 2025-2030 ($ million)
Data Table on Brazil - Market size and forecast 2025-2030 ($ million)
Chart on Brazil - Year-over-year growth 2025-2030 (%)
Data Table on Brazil - Year-over-year growth 2025-2030 (%)

12.6.2 Saudi Arabia - Market size and forecast 2025-2030

Chart on Saudi Arabia - Market size and forecast 2025-2030 ($ million)
Data Table on Saudi Arabia - Market size and forecast 2025-2030 ($ million)
Chart on Saudi Arabia - Year-over-year growth 2025-2030 (%)
Data Table on Saudi Arabia - Year-over-year growth 2025-2030 (%)

12.6.3 UAE - Market size and forecast 2025-2030

Chart on UAE - Market size and forecast 2025-2030 ($ million)
Data Table on UAE - Market size and forecast 2025-2030 ($ million)
Chart on UAE - Year-over-year growth 2025-2030 (%)
Data Table on UAE - Year-over-year growth 2025-2030 (%)

12.6.4 Turkey - Market size and forecast 2025-2030

Chart on Turkey - Market size and forecast 2025-2030 ($ million)
Data Table on Turkey - Market size and forecast 2025-2030 ($ million)
Chart on Turkey - Year-over-year growth 2025-2030 (%)
Data Table on Turkey - Year-over-year growth 2025-2030 (%)

12.6.5 Argentina - Market size and forecast 2025-2030

Chart on Argentina - Market size and forecast 2025-2030 ($ million)
Data Table on Argentina - Market size and forecast 2025-2030 ($ million)
Chart on Argentina - Year-over-year growth 2025-2030 (%)
Data Table on Argentina - Year-over-year growth 2025-2030 (%)

12.6.6 Colombia - Market size and forecast 2025-2030

Chart on Colombia - Market size and forecast 2025-2030 ($ million)
Data Table on Colombia - Market size and forecast 2025-2030 ($ million)
Chart on Colombia - Year-over-year growth 2025-2030 (%)
Data Table on Colombia - Year-over-year growth 2025-2030 (%)

12.6.7 South Africa - Market size and forecast 2025-2030

Chart on South Africa - Market size and forecast 2025-2030 ($ million)
Data Table on South Africa - Market size and forecast 2025-2030 ($ million)
Chart on South Africa - Year-over-year growth 2025-2030 (%)
Data Table on South Africa - Year-over-year growth 2025-2030 (%)

12.6.8 Israel - Market size and forecast 2025-2030

Chart on Israel - Market size and forecast 2025-2030 ($ million)
Data Table on Israel - Market size and forecast 2025-2030 ($ million)
Chart on Israel - Year-over-year growth 2025-2030 (%)
Data Table on Israel - Year-over-year growth 2025-2030 (%)

12.7 Market opportunity by geography

Market opportunity by geography ($ million)
Data Tables on Market opportunity by geography ($ million)

13. Drivers, Challenges, and Opportunity

13.1 Market drivers

Increasing global burden of chronic diseases and aging demographics
Overwhelming clinical and economic preference for minimally invasive procedures
Continuous technological advancements and product innovation

13.2 Market challenges

Stringent regulatory frameworks and prolonged product approval cycles
Intensifying pricing pressure and unfavorable reimbursement policies
High product costs and scarcity of trained interventionalists

13.3 Impact of drivers and challenges

Impact of drivers and challenges in 2025 and 2030

13.4 Market opportunities

Procedural shift to outpatient and ambulatory surgical center settings
Ascendancy of interventional oncology and hyper-specialized therapies
Integration of advanced imaging, robotics, and artificial intelligence

14. Competitive Landscape

14.1 Overview

14.2

Overview on criticality of inputs and factors of differentiation

14.3 Landscape disruption

Overview on factors of disruption

14.4 Industry risks

Impact of key risks on business

15. Competitive Analysis

15.1 Companies profiled

Companies covered

15.2 Company ranking index

15.3 Market positioning of companies

Matrix on companies position and classification

15.4 Abbott Laboratories

Abbott Laboratories - Overview
Abbott Laboratories - Business segments
Abbott Laboratories - Key news
Abbott Laboratories - Key offerings
Abbott Laboratories - Segment focus
SWOT

15.5 Adept Medical Ltd.

Adept Medical Ltd. - Overview
Adept Medical Ltd. - Product / Service
Adept Medical Ltd. - Key offerings
SWOT

15.6 Blueneem Medical Devices

Blueneem Medical Devices - Overview
Blueneem Medical Devices - Product / Service
Blueneem Medical Devices - Key offerings
SWOT

15.7 Boston Scientific Corp.

Boston Scientific Corp. - Overview
Boston Scientific Corp. - Business segments
Boston Scientific Corp. - Key news
Boston Scientific Corp. - Key offerings
Boston Scientific Corp. - Segment focus
SWOT

15.8 Cardinal Health Inc.

Cardinal Health Inc. - Overview
Cardinal Health Inc. - Business segments
Cardinal Health Inc. - Key news
Cardinal Health Inc. - Key offerings
Cardinal Health Inc. - Segment focus
SWOT

15.9 Cook Group Inc.

Cook Group Inc. - Overview
Cook Group Inc. - Product / Service
Cook Group Inc. - Key offerings
SWOT

15.10 GE Healthcare Technologies

GE Healthcare Technologies - Overview
GE Healthcare Technologies - Business segments
GE Healthcare Technologies - Key news
GE Healthcare Technologies - Key offerings
GE Healthcare Technologies - Segment focus
SWOT

15.11 Guerbet

Guerbet - Overview
Guerbet - Product / Service
Guerbet - Key offerings
SWOT

15.12 ILUMARK GmbH

ILUMARK GmbH - Overview
ILUMARK GmbH - Product / Service
ILUMARK GmbH - Key offerings
SWOT

15.13 Koninklijke Philips NV

Koninklijke Philips NV - Overview
Koninklijke Philips NV - Business segments
Koninklijke Philips NV - Key news
Koninklijke Philips NV - Key offerings
Koninklijke Philips NV - Segment focus
SWOT

15.14 Merit Medical Systems Inc.

Merit Medical Systems Inc. - Overview
Merit Medical Systems Inc. - Business segments
Merit Medical Systems Inc. - Key news
Merit Medical Systems Inc. - Key offerings
Merit Medical Systems Inc. - Segment focus
SWOT

15.15 Siemens Healthineers AG

Siemens Healthineers AG - Overview
Siemens Healthineers AG - Business segments
Siemens Healthineers AG - Key news
Siemens Healthineers AG - Key offerings
Siemens Healthineers AG - Segment focus
SWOT

15.16 Teleflex Inc.

Teleflex Inc. - Overview
Teleflex Inc. - Business segments
Teleflex Inc. - Key news
Teleflex Inc. - Key offerings
Teleflex Inc. - Segment focus
SWOT

15.17 Terumo Corp.

Terumo Corp. - Overview
Terumo Corp. - Business segments
Terumo Corp. - Key news
Terumo Corp. - Key offerings
Terumo Corp. - Segment focus
SWOT

15.18 Tokai Medical Products Inc.

Tokai Medical Products Inc. - Overview
Tokai Medical Products Inc. - Product / Service
Tokai Medical Products Inc. - Key offerings
SWOT

16. Appendix

16.1 Scope of the report

Market definition
Objectives
Notes and caveats

16.2 Inclusions and exclusions checklist

Inclusions checklist
Exclusions checklist

16.3 Currency conversion rates for US$

16.4 Research methodology

16.5 Data procurement

Information sources

16.6 Data validation

16.7 Validation techniques employed for market sizing

16.8 Data synthesis

16.9 360 degree market analysis

16.10 List of abbreviations

Research Methodology

Technavio presents a detailed picture of the market by way of study, synthesis, and summation of data from multiple sources. The analysts have presented the various facets of the market with a particular focus on identifying the key industry influencers. The data thus presented is comprehensive, reliable, and the result of extensive research, both primary and secondary.

INFORMATION SOURCES

Primary sources

  • Manufacturers and suppliers
  • Channel partners
  • Industry experts
  • Strategic decision makers

Secondary sources

  • Industry journals and periodicals
  • Government data
  • Financial reports of key industry players
  • Historical data
  • Press releases

DATA ANALYSIS

Data Synthesis

  • Collation of data
  • Estimation of key figures
  • Analysis of derived insights

Data Validation

  • Triangulation with data models
  • Reference against proprietary databases
  • Corroboration with industry experts

REPORT WRITING

Qualitative

  • Market drivers
  • Market challenges
  • Market trends
  • Five forces analysis

Quantitative

  • Market size and forecast
  • Market segmentation
  • Geographical insights
  • Competitive landscape

Interested in this report?

Get your sample now to see our research methodology and insights!

Download Now

Frequently Asked Questions

Interventional Radiology Products market growth will increase by USD 6717.6 million during 2026-2030.

The Interventional Radiology Products market is expected to grow at a CAGR of 7.6% during 2026-2030.

Interventional Radiology Products market is segmented by Type (Stents, Catheters, Embolization devices, Inferior vena cava filters, Others) Application (Cardiology, Urology and nephrology, Oncology, Gastroenterology, Others) End-user (Hospitals, ASCs, Diagnostic imaging centers)

Abbott Laboratories, Adept Medical Ltd., ASAHI INTECC CO. LTD., Blueneem Medical Devices, Boston Scientific Corp., Cardinal Health Inc., Cook Group Inc., GE Healthcare Technologies, Guerbet, ILUMARK GmbH, INRAD Inc., Koninklijke Philips NV, Merit Medical Systems Inc., Seda SpA, Siemens Healthineers AG, Teleflex Inc., Terumo Corp., Tokai Medical Products Inc., Uresil LLC are a few of the key vendors in the Interventional Radiology Products market.

North America will register the highest growth rate of 32.6% among the other regions. Therefore, the Interventional Radiology Products market in North America is expected to garner significant business opportunities for the vendors during the forecast period.

US, Canada, Mexico, Germany, UK, France, Italy, Spain, The Netherlands, China, India, Japan, South Korea, Indonesia, Thailand, Brazil, Saudi Arabia, UAE, Turkey, Argentina, Colombia, South Africa, Israel

  • Increasing global burden of chronic diseases and aging demographics is the driving factor this market.

The Interventional Radiology Products market vendors should focus on grabbing business opportunities from the Type segment as it accounted for the largest market share in the base year.