Metal Material Based 3D Printing Market Analysis, Size, and Forecast 2025-2029: North America (US and Canada), Europe (France, Germany, Italy, and UK), Middle East and Africa (Egypt, KSA, Oman, and UAE), APAC (China, India, and Japan), South America (Argentina and Brazil), and Rest of World (ROW)

Metal Material Based 3D Printing Market Analysis, Size, and Forecast 2025-2029:
North America (US and Canada), Europe (France, Germany, Italy, and UK), Middle East and Africa (Egypt, KSA, Oman, and UAE), APAC (China, India, and Japan), South America (Argentina and Brazil), and Rest of World (ROW)

Published: Feb 2025 219 Pages SKU: IRTNTR76675

Market Overview at a Glance

$3095.5 B
Market Opportunity
27.9%
CAGR
26.2
YoY growth 2024-2025(%)

Metal Material Based 3D Printing Market Size 2025-2029

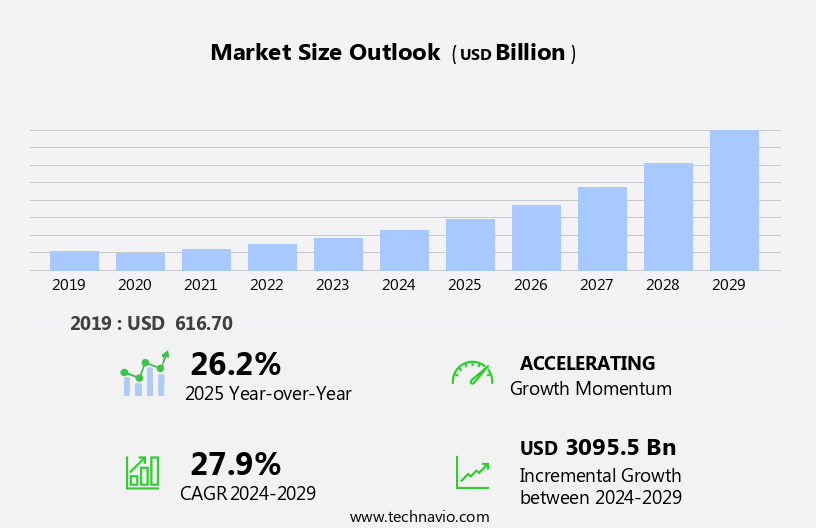
The metal material based 3D printing market size is forecast to increase by USD 3095.5 billion, at a CAGR of 27.9% between 2024 and 2029.

  • The Metal Material-Based 3D Printing Market is experiencing significant growth due to the increasing demand for customized and personalized metal products. This trend is driven by advancements in 3D printing technologies that enable the production of complex metal components with high precision and accuracy. These advancements have expanded the capabilities of metal additive manufacturing in various industries, including defense and aerospace. Metal 3D printers are transforming manufacturing expenditure by providing accurate and efficient solutions for various industries, including the dental, education, food, automotive, and consumer electronics segments. However, the high initial investment costs associated with metal 3D printing systems pose a considerable challenge for market entrants.
  • Despite this, the potential for producing lightweight, strong, and intricately designed metal parts on-demand offers substantial opportunities for companies in various industries, including automotive, aerospace, and healthcare. To capitalize on these opportunities, businesses must navigate the high upfront costs and continuously innovate to improve efficiency and reduce production costs.

What will be the Size of the Metal Material Based 3D Printing Market during the forecast period?

Metal Material Based 3D Printing Market Size

Explore in-depth regional segment analysis with market size data - historical 2019-2023 and forecasts 2025-2029 - in the full report.  
Request Free Sample

The metal material-based 3D printing market continues to evolve, driven by advancements in technology and increasing applications across various sectors. Cobalt alloys, nickel alloys, and titanium alloys are among the metals gaining popularity due to their superior mechanical properties. Binder jetting and powder recycling are transforming the manufacturing process, enabling cost savings and reduced environmental impact. Artificial intelligence (AI) and machine learning are being integrated into the workflow for quality control and process optimization. In the aerospace industry, 3D printing is revolutionizing the production of complex components, while the automotive sector is leveraging the technology for rapid prototyping and custom parts.

The medical field is benefiting from 3D printing for producing implants and dental applications. Industrial machinery, jigs, and fixtures are also being manufactured using additive manufacturing, leading to improved dimensional accuracy and reduced material cost. Print speed, generative design, surface roughness, and topology optimization are critical factors influencing the market dynamics. Support structures and supply chain management are also undergoing significant changes to accommodate the unique requirements of metal 3D printing. Energy consumption and material extrusion are areas of ongoing research to improve the sustainability and efficiency of the manufacturing process. Simulation software, process monitoring, and digital twin technology are essential tools for optimizing the manufacturing process and ensuring consistent quality.

Heat treatment, surface finishing, and non-destructive testing are crucial post-processing steps to enhance the final properties of the printed parts. The market is expected to continue unfolding with new innovations and applications, making it an exciting space to watch.

How is this Metal Material Based 3D Printing Industry segmented?

The metal material based 3d printing industry research report provides comprehensive data (region-wise segment analysis), with forecasts and estimates in "USD billion" for the period 2025-2029, as well as historical data from 2019-2023 for the following segments.

  • Type
    • Iron-based
    • Titanium
    • Nickel
    • Aluminum
  • End-user
    • Healthcare
    • Automotive
    • Aerospace and defense
    • Tool and mold making
    • Others
  • Technology
    • PBF
    • DED
    • Binder jetting
    • Metal extrusion
  • Application
    • Prototyping
    • Functional Parts
    • Tooling
    • Repair & Overhaul
  • Geography
    • North America
      • US
      • Canada
    • Europe
      • France
      • Germany
      • Italy
      • UK
    • Middle East and Africa
      • Egypt
      • KSA
      • Oman
      • UAE
    • APAC
      • China
      • India
      • Japan
    • South America
      • Argentina
      • Brazil
    • Rest of World (ROW)

By Type Insights

The iron-based segment is estimated to witness significant growth during the forecast period.

The market encompasses various metal alloys, including nickel, titanium, stainless steel, aluminum, and iron, among others. Binder jetting and powder recycling are prominent technologies driving the market's growth. Artificial intelligence and machine learning are revolutionizing quality control, enabling real-time process monitoring and predictive maintenance. Nickel alloys, known for their high mechanical properties and corrosion resistance, are increasingly used in aerospace components and industrial machinery. Environmental concerns have led to the development of eco-friendly 3D printing resins, reducing the industry's carbon footprint. The market caters to diverse applications, from automotive parts and jigs and fixtures to medical implants and dental applications.

3D printing technologies, such as stereolithography, selective laser melting, and multi jet fusion, offer unique benefits, including high dimensional accuracy, surface finishing, and material extrusion. The market's dynamics are influenced by factors like material cost, energy consumption, build volume, and production cost. Digital twin technology and simulation software enable optimized design, reducing the need for support structures and enhancing yield strength. CAD software, heat treatment, and non-destructive testing ensure the production of high-quality components with desirable mechanical properties, such as tensile strength and fatigue resistance. The supply chain is streamlined through rapid prototyping and custom parts production, ensuring timely delivery and cost savings.

Metal Material Based 3D Printing Market Size

Request Free Sample

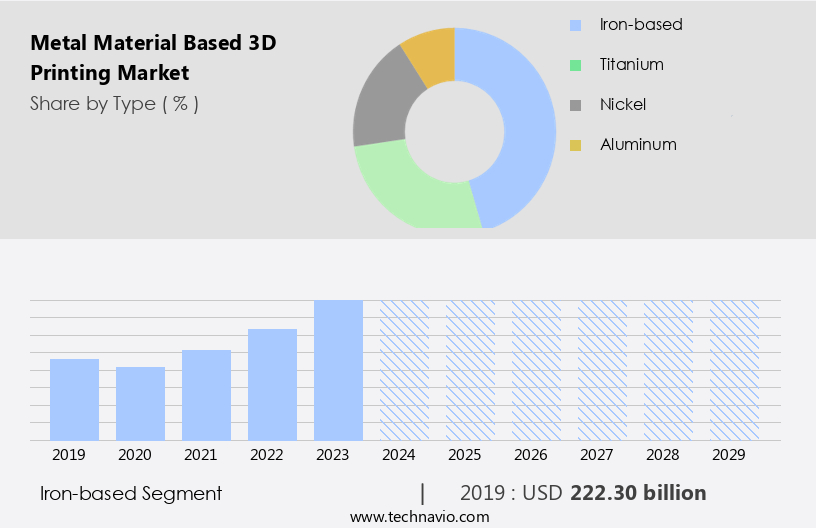
The Iron-based segment was valued at USD 222.30 billion in 2019 and showed a gradual increase during the forecast period.

Regional Analysis

North America is estimated to contribute 40% to the growth of the global market during the forecast period.Technavio's analysts have elaborately explained the regional trends and drivers that shape the market during the forecast period.

Metal Material Based 3D Printing Market Share by Geography

 Request Free Sample

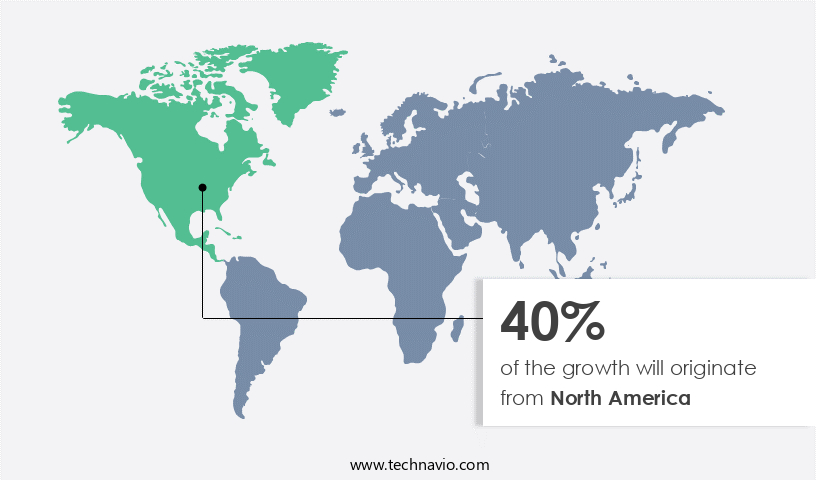
In 2024, the North American region significantly contributed to The market. The US government's investment in metal material production and adoption of 3D printers drove this growth. For instance, in February 2025, the University of Waterloo's Multi-Scale Additive Manufacturing (MSAM) Lab secured a USD5 million USD grant from the Federal Economic Development Agency for Southern Ontario. This initiative, aimed at strengthening Waterloo's leadership in additive manufacturing, fostered collaboration between academic institutions and industry partners. Metal alloys, including nickel, titanium, stainless steel, and aluminum, are increasingly used in 3D printing for their mechanical properties and corrosion resistance.

Binder jetting and powder recycling are popular 3D printing technologies for metal materials. Artificial intelligence and machine learning improve quality control, process monitoring, and generative design. Environmental impact is a concern, with energy consumption and material cost being key considerations. Digital twin technology and simulation software help optimize build volume and reduce waste. Aerospace components, automotive parts, industrial machinery, jigs and fixtures, and medical implants are common applications. Additive manufacturing processes, such as stereolithography and multi jet fusion, offer high dimensional accuracy and surface finishing. Heat treatment, non-destructive testing, and post-processing techniques ensure the desired material properties, such as yield strength and tensile strength.

CAD software and cam software streamline the manufacturing process, while topology optimization and support structures enable the production of complex geometries. Supply chain optimization and rapid prototyping reduce lead times and production cost. In conclusion, the market is evolving, with advancements in technology, materials, and applications. The integration of AI, machine learning, and digital twin technology is transforming the manufacturing landscape, offering improved efficiency, cost savings, and customization.

Market Dynamics

The Metal Material Based 3D Printing Market is surging, driven by demand for metal 3D printing powders, titanium alloys, and aluminum alloys in aerospace 3D printing and automotive 3D printing. Technologies like Direct Metal Laser Sintering (DMLS) and Selective Laser Melting (SLM) enable high-precision metal 3D printing for medical 3D printing applications. Sustainable metal 3D printing aligns with eco-conscious trends, while metal 3D printing powders for aerospace, titanium alloys for medical 3D printing, Direct Metal Laser Sintering for automotive parts, Selective Laser Melting for jet engine components, sustainable metal 3D printing for lightweight parts, AI-driven 3D printing optimization for tooling, high-precision metal 3D printing for dental implants, cost-effective metal AM for industrial applications, scalable metal 3D printing for defense sector, and lightweight metal AM solutions for aerospace 2025 shape the industry's innovative future.

Our researchers analyzed the data with 2024 as the base year, along with the key drivers, trends, and challenges. A holistic analysis of drivers will help companies refine their marketing strategies to gain a competitive advantage.

What are the key market drivers leading to the rise in the adoption of Metal Material Based 3D Printing Industry?

  • The significant rise in the adoption of customized and personalized metal products is the primary driving force behind the market's growth. 
  • The market is experiencing notable growth due to the increasing demand for customized and intricately designed metal components. This trend is fueled by the advantages of additive manufacturing, which enables the production of unique metal parts with optimized design and functionality. In industries such as medical, automotive, and industrial machinery, metal additive manufacturing is revolutionizing the production of complex components, including stainless steel implants, aluminum alloy automotive parts, and industrial jigs and fixtures. Processes like stereolithography (SLA) allow for the creation of highly detailed metal structures, leading to improved functionality and performance. Moreover, digital twin technology and process monitoring with simulation software facilitate efficient design and optimization, reducing material costs and energy consumption.
  • For instance, in the medical sector, customized implants can be 3D printed using metal additive manufacturing to fit perfectly with a patient's anatomy, ensuring better implant performance and patient outcomes. Similarly, in the automotive industry, metal additive manufacturing enables the production of lightweight and durable parts, reducing energy consumption and improving overall vehicle efficiency. In summary, The market is witnessing significant growth due to the advantages of additive manufacturing, including optimized design, reduced material costs, and improved performance. Industries such as medical, automotive, and industrial machinery are capitalizing on these benefits to produce customized and intricately designed metal components.

What are the market trends shaping the Metal Material Based 3D Printing Industry?

  • Metal material-based 3D printing technologies are experiencing significant advancements, making them the current market trend in the additive manufacturing industry. This innovative technology offers numerous benefits, including the production of complex and lightweight components, increased design freedom, and reduced material waste.
  • The market has experienced significant growth due to technological advancements in additive manufacturing techniques. Two notable advancements are the enhancement of laser-based metal 3D printing methods, specifically Laser Powder Bed Fusion (LPBF) and Directed Energy Deposition (DED). LPBF uses a high-powered laser to melt layers of metal powder, producing intricate and precise parts with excellent surface finish. DED, which involves feeding metal wire or powder into a melt pool created by a laser or electron beam, enables the deposition of material layer by layer. These improvements have expanded the capabilities and applications of metal additive manufacturing. For instance, yield strength of cobalt alloys has increased, making them suitable for producing custom parts in industries such as aerospace and automotive.
  • Additionally, print speed has been enhanced, reducing production time for complex parts. Moreover, generative design and topology optimization have become more prevalent, allowing for the creation of lightweight yet strong structures. Support structures have also been optimized, reducing the need for post-processing and improving overall efficiency. The supply chain has been transformed as well, with rapid prototyping becoming a more viable option for manufacturing custom parts. Material extrusion and layer thickness have also seen advancements, broadening the range of materials that can be used in metal 3D printing. Despite these advancements, challenges remain, including the high cost of metal powders and the need for further research on material properties and post-processing techniques.
  • Nevertheless, the future of metal material based 3D printing looks promising, with continued innovation and investment in research and development.

What challenges does the Metal Material Based 3D Printing Industry face during its growth?

  • The high initial investment costs represent a significant challenge impeding the growth of the industry. 
  • The market faces a significant hurdle in the form of high initial investment costs, which have hindered widespread adoption among businesses. The expense of acquiring metal 3D printers is a major concern, as these advanced machines can cost anywhere from USD1,500 to USD1 million, depending on the intended use by the end-user. This high cost presents a challenge for small and medium-sized enterprises (SMEs), limiting their access to this innovative technology. Despite these challenges, the benefits of metal material based 3D printing are substantial. This additive manufacturing process offers dimensional accuracy, surface finishing, heat treatment, non-destructive testing, and improved material properties such as corrosion resistance, fatigue resistance, and tensile strength.
  • These advantages make metal material based 3D printing an attractive option for various industries, including dental applications. To optimize the manufacturing process, users often employ Computer-Aided Design (CAD) software to create digital models for 3D printing. Post-production processes, such as heat treatment and surface finishing, further enhance the final product's quality and durability. By investing in these advanced technologies, businesses can create complex geometries and intricate designs that would be difficult or impossible to achieve using traditional manufacturing methods. In conclusion, while the high cost of metal material based 3D printers presents a significant barrier to entry, the benefits of this manufacturing process, such as dimensional accuracy, improved material properties, and design flexibility, make it a valuable investment for businesses seeking to innovate and stay competitive in their industries.

Exclusive Customer Landscape

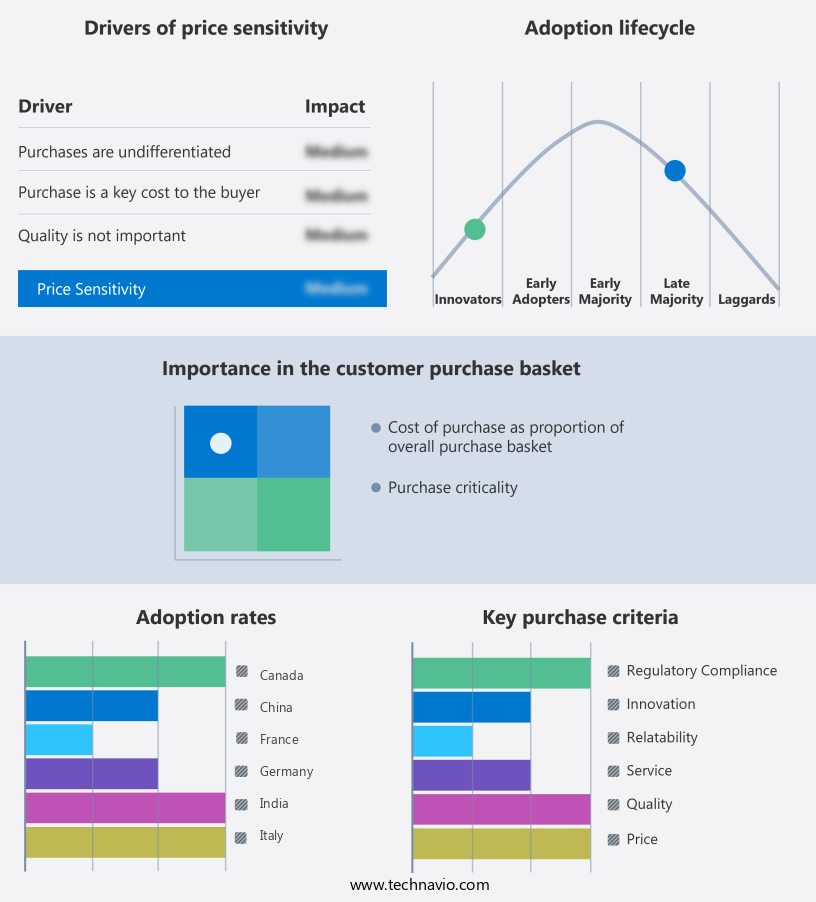
The metal material based 3d printing market forecasting report includes the adoption lifecycle of the market, covering from the innovator's stage to the laggard's stage. It focuses on adoption rates in different regions based on penetration. Furthermore, the metal material based 3d printing market report also includes key purchase criteria and drivers of price sensitivity to help companies evaluate and develop their market growth analysis strategies.

Metal Material Based 3D Printing Market Share by Geography

 Customer Landscape

Key Companies & Market Insights

Companies are implementing various strategies, such as strategic alliances, metal material based 3d printing market forecast, partnerships, mergers and acquisitions, geographical expansion, and product/service launches, to enhance their presence in the industry.

3D Systems Corp. - This company specializes in advanced 3D printing technology, focusing on direct metal printing with titanium alloys, stainless steel alloys, and maraging steel alloys. Their innovative solution revolutionizes the manufacturing industry by enabling the production of complex metal components with unparalleled precision and efficiency.

The industry research and growth report includes detailed analyses of the competitive landscape of the market and information about key companies, including:

  • 3D Systems Corp.
  • BASF SE
  • Carpenter Technology Corp.
  • Desktop Metal Inc.
  • EOS GmbH
  • Equispheres Inc.
  • General Electric Co.
  • Markforged Holding Corp.
  • MATERIALISE NV
  • Ponoko Inc.
  • Proto Labs Inc.
  • Renishaw Plc
  • Sandvik AB
  • SHAPEWAYS HOLDINGS INC.
  • Sisma SpA
  • SLM Solutions Group AG
  • Stratasys Ltd.
  • Titomic Ltd.
  • TRUMPF SE Co. KG
  • Velo3D Inc.

Qualitative and quantitative analysis of companies has been conducted to help clients understand the wider business environment as well as the strengths and weaknesses of key industry players. Data is qualitatively analyzed to categorize companies as pure play, category-focused, industry-focused, and diversified; it is quantitatively analyzed to categorize companies as dominant, leading, strong, tentative, and weak.

Recent Development and News in Metal Material Based 3D Printing Market

  • In January 2024, GE Additive, a leading provider of metal 3D printing solutions, announced the launch of its new Arcam EBM System, the EBM Q10plus, which offers increased build volume and improved productivity for the aerospace and automotive industries (GE Additive Press Release).
  • In March 2024, 3D Systems and Desktop Metal entered into a strategic partnership to expand their metal 3D printing offerings, combining Desktop Metal's innovative metal binder jetting technology with 3D Systems' expertise in production-grade 3D printing solutions (3D Systems Press Release).
  • In May 2024, HP Inc. Raised the bar in metal 3D printing with the introduction of their new Multi Jet Fusion 3D Metal Jet platform, capable of producing high-quality, mass-produced metal parts at an unprecedented speed and scale (HP Inc. Press Release).
  • In April 2025, SLM Solutions, a global leader in selective laser melting technology, secured a significant investment of €20 million from Siemens AG to strengthen their market position and accelerate the development of new metal 3D printing applications (Reuters).

Research Analyst Overview

  • The 3D printing market for metal materials is experiencing significant advancements, with various technologies gaining traction. Precision machining and CNC machining continue to dominate traditional manufacturing processes, but ultrasonic welding, VAT polymerization, electron beam, and direct energy deposition are disrupting the industry. Quality assurance is a critical concern, with design validation, sand casting, and investment casting undergoing innovation through software simulation and 3D scanning. Production planning and inventory management are essential elements in metal 3D printing, with build plates, part orientation, print heads, and production planning software optimizing the manufacturing process. Powder bed fusion, powder bed, and sheet lamination are popular techniques, while reverse engineering, laser cladding, high-pressure die casting, and support structures offer unique advantages.
  • Design software, file formats, and design for manufacturing are crucial aspects of the metal 3D printing value chain. Laser cutting, waterjet cutting, material jetting, cold spray, and electrochemical machining (ECM) are additional techniques expanding the market's scope. Overall, the metal 3D printing market is dynamic, with continuous innovation in technology and processes shaping its future.

Dive into Technavio's robust research methodology, blending expert interviews, extensive data synthesis, and validated models for unparalleled Metal Material Based 3D Printing Market insights. See full methodology.

Market Scope

Report Coverage

Details

Page number

219

Base year

2024

Historic period

2019-2023

Forecast period

2025-2029

Growth momentum & CAGR

Accelerate at a CAGR of 27.9%

Market growth 2025-2029

USD 3095.5 billion

Market structure

Fragmented

YoY growth 2024-2025(%)

26.2

Key countries

US, Canada, Germany, UK, Italy, France, China, India, Japan, Brazil, Egypt, UAE, Oman, Argentina, KSA, UAE, Brazil, and Rest of World (ROW)

Competitive landscape

Leading Companies, Market Positioning of Companies, Competitive Strategies, and Industry Risks

Request Free Sample

What are the Key Data Covered in this Metal Material Based 3D Printing Market Research and Growth Report?

  • CAGR of the Metal Material Based 3D Printing industry during the forecast period
  • Detailed information on factors that will drive the growth and forecasting between 2025 and 2029
  • Precise estimation of the size of the market and its contribution of the industry in focus to the parent market
  • Accurate predictions about upcoming growth and trends and changes in consumer behaviour
  • Growth of the market across North America, Europe, APAC, South America, and Middle East and Africa
  • Thorough analysis of the market's competitive landscape and detailed information about companies
  • Comprehensive analysis of factors that will challenge the metal material based 3d printing market growth of industry companies

We can help! Our analysts can customize this metal material based 3d printing market research report to meet your requirements.

Get in touch

1 Executive Summary

  • 1.1 Market overview
    • Executive Summary - Chart on Market Overview
    • Executive Summary - Data Table on Market Overview
    • Executive Summary - Chart on Global Market Characteristics
    • Executive Summary - Chart on Market by Geography
    • Executive Summary - Chart on Market Segmentation by Type
    • Executive Summary - Chart on Market Segmentation by End-user
    • Executive Summary - Chart on Market Segmentation by Technology
    • Executive Summary - Chart on Incremental Growth
    • Executive Summary - Data Table on Incremental Growth
    • Executive Summary - Chart on Company Market Positioning

2 Technavio Analysis

  • 2.1 Analysis of price sensitivity, lifecycle, customer purchase basket, adoption rates, and purchase criteria
    • Analysis of price sensitivity, lifecycle, customer purchase basket, adoption rates, and purchase criteria
  • 2.2 Criticality of inputs and Factors of differentiation
    • Overview on criticality of inputs and factors of differentiation
  • 2.3 Factors of disruption
    • Overview on factors of disruption
  • 2.4 Impact of drivers and challenges
    • Impact of drivers and challenges in 2024 and 2029

3 Market Landscape

  • 3.1 Market ecosystem
    • Parent Market
    • Data Table on - Parent Market
  • 3.2 Market characteristics
    • Market characteristics analysis
  • 3.3 Value chain analysis
    • Value chain analysis

4 Market Sizing

  • 4.1 Market definition
    • Offerings of companies included in the market definition
  • 4.2 Market segment analysis
    • Market segments
  • 4.3 Market size 2024
    • 4.4 Market outlook: Forecast for 2024-2029
      • Chart on Global - Market size and forecast 2024-2029 ($ billion)
      • Data Table on Global - Market size and forecast 2024-2029 ($ billion)
      • Chart on Global Market: Year-over-year growth 2024-2029 (%)
      • Data Table on Global Market: Year-over-year growth 2024-2029 (%)

    5 Historic Market Size

    • 5.1 Global Metal Material Based 3D Printing Market 2019 - 2023
      • Historic Market Size - Data Table on Global Metal Material Based 3D Printing Market 2019 - 2023 ($ billion)
    • 5.2 Type segment analysis 2019 - 2023
      • Historic Market Size - Type Segment 2019 - 2023 ($ billion)
    • 5.3 End-user segment analysis 2019 - 2023
      • Historic Market Size - End-user Segment 2019 - 2023 ($ billion)
    • 5.4 Technology segment analysis 2019 - 2023
      • Historic Market Size - Technology Segment 2019 - 2023 ($ billion)
    • 5.5 Geography segment analysis 2019 - 2023
      • Historic Market Size - Geography Segment 2019 - 2023 ($ billion)
    • 5.6 Country segment analysis 2019 - 2023
      • Historic Market Size - Country Segment 2019 - 2023 ($ billion)

    6 Qualitative Analysis

    • 6.1 Impact of AI on global metal material based 3D printing market

      7 Five Forces Analysis

      • 7.1 Five forces summary
        • Five forces analysis - Comparison between 2024 and 2029
      • 7.2 Bargaining power of buyers
        • Bargaining power of buyers - Impact of key factors 2024 and 2029
      • 7.3 Bargaining power of suppliers
        • Bargaining power of suppliers - Impact of key factors in 2024 and 2029
      • 7.4 Threat of new entrants
        • Threat of new entrants - Impact of key factors in 2024 and 2029
      • 7.5 Threat of substitutes
        • Threat of substitutes - Impact of key factors in 2024 and 2029
      • 7.6 Threat of rivalry
        • Threat of rivalry - Impact of key factors in 2024 and 2029
      • 7.7 Market condition
        • Chart on Market condition - Five forces 2024 and 2029

      8 Market Segmentation by Type

      • 8.1 Market segments
        • Chart on Type - Market share (2024-2029) (%)
        • Data Table on Type - Market share (2024-2029) (%)
      • 8.2 Comparison by Type
        • Chart on Comparison by Type
        • Data Table on Comparison by Type
      • 8.3 Iron-based - Market size and forecast (2024-2029)
        • Chart on Iron-based - Market size and forecast (2024-2029) ($ billion)
        • Data Table on Iron-based - Market size and forecast (2024-2029) ($ billion)
        • Chart on Iron-based - Year-over-year growth (2024-2029) (%)
        • Data Table on Iron-based - Year-over-year growth (2024-2029) (%)
      • 8.4 Titanium - Market size and forecast (2024-2029)
        • Chart on Titanium - Market size and forecast (2024-2029) ($ billion)
        • Data Table on Titanium - Market size and forecast (2024-2029) ($ billion)
        • Chart on Titanium - Year-over-year growth (2024-2029) (%)
        • Data Table on Titanium - Year-over-year growth (2024-2029) (%)
      • 8.5 Nickel - Market size and forecast (2024-2029)
        • Chart on Nickel - Market size and forecast (2024-2029) ($ billion)
        • Data Table on Nickel - Market size and forecast (2024-2029) ($ billion)
        • Chart on Nickel - Year-over-year growth (2024-2029) (%)
        • Data Table on Nickel - Year-over-year growth (2024-2029) (%)
      • 8.6 Aluminum - Market size and forecast (2024-2029)
        • Chart on Aluminum - Market size and forecast (2024-2029) ($ billion)
        • Data Table on Aluminum - Market size and forecast (2024-2029) ($ billion)
        • Chart on Aluminum - Year-over-year growth (2024-2029) (%)
        • Data Table on Aluminum - Year-over-year growth (2024-2029) (%)
      • 8.7 Market opportunity by Type
        • Market opportunity by Type ($ billion)
        • Data Table on Market opportunity by Type ($ billion)

      9 Market Segmentation by End-user

      • 9.1 Market segments
        • Chart on End-user - Market share (2024-2029) (%)
        • Data Table on End-user - Market share (2024-2029) (%)
      • 9.2 Comparison by End-user
        • Chart on Comparison by End-user
        • Data Table on Comparison by End-user
      • 9.3 Healthcare - Market size and forecast (2024-2029)
        • Chart on Healthcare - Market size and forecast (2024-2029) ($ billion)
        • Data Table on Healthcare - Market size and forecast (2024-2029) ($ billion)
        • Chart on Healthcare - Year-over-year growth (2024-2029) (%)
        • Data Table on Healthcare - Year-over-year growth (2024-2029) (%)
      • 9.4 Automotive - Market size and forecast (2024-2029)
        • Chart on Automotive - Market size and forecast (2024-2029) ($ billion)
        • Data Table on Automotive - Market size and forecast (2024-2029) ($ billion)
        • Chart on Automotive - Year-over-year growth (2024-2029) (%)
        • Data Table on Automotive - Year-over-year growth (2024-2029) (%)
      • 9.5 Aerospace and defense - Market size and forecast (2024-2029)
        • Chart on Aerospace and defense - Market size and forecast (2024-2029) ($ billion)
        • Data Table on Aerospace and defense - Market size and forecast (2024-2029) ($ billion)
        • Chart on Aerospace and defense - Year-over-year growth (2024-2029) (%)
        • Data Table on Aerospace and defense - Year-over-year growth (2024-2029) (%)
      • 9.6 Tool and mold making - Market size and forecast (2024-2029)
        • Chart on Tool and mold making - Market size and forecast (2024-2029) ($ billion)
        • Data Table on Tool and mold making - Market size and forecast (2024-2029) ($ billion)
        • Chart on Tool and mold making - Year-over-year growth (2024-2029) (%)
        • Data Table on Tool and mold making - Year-over-year growth (2024-2029) (%)
      • 9.7 Others - Market size and forecast (2024-2029)
        • Chart on Others - Market size and forecast (2024-2029) ($ billion)
        • Data Table on Others - Market size and forecast (2024-2029) ($ billion)
        • Chart on Others - Year-over-year growth (2024-2029) (%)
        • Data Table on Others - Year-over-year growth (2024-2029) (%)
      • 9.8 Market opportunity by End-user
        • Market opportunity by End-user ($ billion)
        • Data Table on Market opportunity by End-user ($ billion)

      10 Market Segmentation by Technology

      • 10.1 Market segments
        • Chart on Technology - Market share (2024-2029) (%)
        • Data Table on Technology - Market share (2024-2029) (%)
      • 10.2 Comparison by Technology
        • Chart on Comparison by Technology
        • Data Table on Comparison by Technology
      • 10.3 PBF - Market size and forecast (2024-2029)
        • Chart on PBF - Market size and forecast (2024-2029) ($ billion)
        • Data Table on PBF - Market size and forecast (2024-2029) ($ billion)
        • Chart on PBF - Year-over-year growth (2024-2029) (%)
        • Data Table on PBF - Year-over-year growth (2024-2029) (%)
      • 10.4 DED - Market size and forecast (2024-2029)
        • Chart on DED - Market size and forecast (2024-2029) ($ billion)
        • Data Table on DED - Market size and forecast (2024-2029) ($ billion)
        • Chart on DED - Year-over-year growth (2024-2029) (%)
        • Data Table on DED - Year-over-year growth (2024-2029) (%)
      • 10.5 Binder jetting - Market size and forecast (2024-2029)
        • Chart on Binder jetting - Market size and forecast (2024-2029) ($ billion)
        • Data Table on Binder jetting - Market size and forecast (2024-2029) ($ billion)
        • Chart on Binder jetting - Year-over-year growth (2024-2029) (%)
        • Data Table on Binder jetting - Year-over-year growth (2024-2029) (%)
      • 10.6 Metal extrusion - Market size and forecast (2024-2029)
        • Chart on Metal extrusion - Market size and forecast (2024-2029) ($ billion)
        • Data Table on Metal extrusion - Market size and forecast (2024-2029) ($ billion)
        • Chart on Metal extrusion - Year-over-year growth (2024-2029) (%)
        • Data Table on Metal extrusion - Year-over-year growth (2024-2029) (%)
      • 10.7 Market opportunity by Technology
        • Market opportunity by Technology ($ billion)
        • Data Table on Market opportunity by Technology ($ billion)

      11 Market Segmentation by Application

      • 11.1 Market segments
        • Chart on Application - Market share (2024-2029) (%)
        • Data Table on Application - Market share (2024-2029) (%)
      • 11.2 Comparison by Application
        • Chart on Comparison by Application
        • Data Table on Comparison by Application
      • 11.3 Prototyping - Market size and forecast (2024-2029)
        • Chart on Prototyping - Market size and forecast (2024-2029) ($ billion)
        • Data Table on Prototyping - Market size and forecast (2024-2029) ($ billion)
        • Chart on Prototyping - Year-over-year growth (2024-2029) (%)
        • Data Table on Prototyping - Year-over-year growth (2024-2029) (%)
      • 11.4 Functional Parts - Market size and forecast (2024-2029)
        • Chart on Functional Parts - Market size and forecast (2024-2029) ($ billion)
        • Data Table on Functional Parts - Market size and forecast (2024-2029) ($ billion)
        • Chart on Functional Parts - Year-over-year growth (2024-2029) (%)
        • Data Table on Functional Parts - Year-over-year growth (2024-2029) (%)
      • 11.5 Tooling - Market size and forecast (2024-2029)
        • Chart on Tooling - Market size and forecast (2024-2029) ($ billion)
        • Data Table on Tooling - Market size and forecast (2024-2029) ($ billion)
        • Chart on Tooling - Year-over-year growth (2024-2029) (%)
        • Data Table on Tooling - Year-over-year growth (2024-2029) (%)
      • 11.6 Repair & Overhaul - Market size and forecast (2024-2029)
        • Chart on Repair & Overhaul - Market size and forecast (2024-2029) ($ billion)
        • Data Table on Repair & Overhaul - Market size and forecast (2024-2029) ($ billion)
        • Chart on Repair & Overhaul - Year-over-year growth (2024-2029) (%)
        • Data Table on Repair & Overhaul - Year-over-year growth (2024-2029) (%)
      • 11.7 Market opportunity by Application
        • Market opportunity by Application ($ billion)
        • Data Table on Market opportunity by Application ($ billion)

      12 Customer Landscape

      • 12.1 Customer landscape overview
        • Analysis of price sensitivity, lifecycle, customer purchase basket, adoption rates, and purchase criteria

      13 Geographic Landscape

      • 13.1 Geographic segmentation
        • Chart on Market share by geography 2024-2029 (%)
        • Data Table on Market share by geography 2024-2029 (%)
      • 13.2 Geographic comparison
        • Chart on Geographic comparison
        • Data Table on Geographic comparison
      • 13.3 North America - Market size and forecast 2024-2029
        • Chart on North America - Market size and forecast 2024-2029 ($ billion)
        • Data Table on North America - Market size and forecast 2024-2029 ($ billion)
        • Chart on North America - Year-over-year growth 2024-2029 (%)
        • Data Table on North America - Year-over-year growth 2024-2029 (%)
      • 13.4 Europe - Market size and forecast 2024-2029
        • Chart on Europe - Market size and forecast 2024-2029 ($ billion)
        • Data Table on Europe - Market size and forecast 2024-2029 ($ billion)
        • Chart on Europe - Year-over-year growth 2024-2029 (%)
        • Data Table on Europe - Year-over-year growth 2024-2029 (%)
      • 13.5 APAC - Market size and forecast 2024-2029
        • Chart on APAC - Market size and forecast 2024-2029 ($ billion)
        • Data Table on APAC - Market size and forecast 2024-2029 ($ billion)
        • Chart on APAC - Year-over-year growth 2024-2029 (%)
        • Data Table on APAC - Year-over-year growth 2024-2029 (%)
      • 13.6 South America - Market size and forecast 2024-2029
        • Chart on South America - Market size and forecast 2024-2029 ($ billion)
        • Data Table on South America - Market size and forecast 2024-2029 ($ billion)
        • Chart on South America - Year-over-year growth 2024-2029 (%)
        • Data Table on South America - Year-over-year growth 2024-2029 (%)
      • 13.7 Middle East and Africa - Market size and forecast 2024-2029
        • Chart on Middle East and Africa - Market size and forecast 2024-2029 ($ billion)
        • Data Table on Middle East and Africa - Market size and forecast 2024-2029 ($ billion)
        • Chart on Middle East and Africa - Year-over-year growth 2024-2029 (%)
        • Data Table on Middle East and Africa - Year-over-year growth 2024-2029 (%)
      • 13.8 US - Market size and forecast 2024-2029
        • Chart on US - Market size and forecast 2024-2029 ($ billion)
        • Data Table on US - Market size and forecast 2024-2029 ($ billion)
        • Chart on US - Year-over-year growth 2024-2029 (%)
        • Data Table on US - Year-over-year growth 2024-2029 (%)
      • 13.9 China - Market size and forecast 2024-2029
        • Chart on China - Market size and forecast 2024-2029 ($ billion)
        • Data Table on China - Market size and forecast 2024-2029 ($ billion)
        • Chart on China - Year-over-year growth 2024-2029 (%)
        • Data Table on China - Year-over-year growth 2024-2029 (%)
      • 13.10 Canada - Market size and forecast 2024-2029
        • Chart on Canada - Market size and forecast 2024-2029 ($ billion)
        • Data Table on Canada - Market size and forecast 2024-2029 ($ billion)
        • Chart on Canada - Year-over-year growth 2024-2029 (%)
        • Data Table on Canada - Year-over-year growth 2024-2029 (%)
      • 13.11 UK - Market size and forecast 2024-2029
        • Chart on UK - Market size and forecast 2024-2029 ($ billion)
        • Data Table on UK - Market size and forecast 2024-2029 ($ billion)
        • Chart on UK - Year-over-year growth 2024-2029 (%)
        • Data Table on UK - Year-over-year growth 2024-2029 (%)
      • 13.12 Japan - Market size and forecast 2024-2029
        • Chart on Japan - Market size and forecast 2024-2029 ($ billion)
        • Data Table on Japan - Market size and forecast 2024-2029 ($ billion)
        • Chart on Japan - Year-over-year growth 2024-2029 (%)
        • Data Table on Japan - Year-over-year growth 2024-2029 (%)
      • 13.13 Germany - Market size and forecast 2024-2029
        • Chart on Germany - Market size and forecast 2024-2029 ($ billion)
        • Data Table on Germany - Market size and forecast 2024-2029 ($ billion)
        • Chart on Germany - Year-over-year growth 2024-2029 (%)
        • Data Table on Germany - Year-over-year growth 2024-2029 (%)
      • 13.14 India - Market size and forecast 2024-2029
        • Chart on India - Market size and forecast 2024-2029 ($ billion)
        • Data Table on India - Market size and forecast 2024-2029 ($ billion)
        • Chart on India - Year-over-year growth 2024-2029 (%)
        • Data Table on India - Year-over-year growth 2024-2029 (%)
      • 13.15 France - Market size and forecast 2024-2029
        • Chart on France - Market size and forecast 2024-2029 ($ billion)
        • Data Table on France - Market size and forecast 2024-2029 ($ billion)
        • Chart on France - Year-over-year growth 2024-2029 (%)
        • Data Table on France - Year-over-year growth 2024-2029 (%)
      • 13.16 Italy - Market size and forecast 2024-2029
        • Chart on Italy - Market size and forecast 2024-2029 ($ billion)
        • Data Table on Italy - Market size and forecast 2024-2029 ($ billion)
        • Chart on Italy - Year-over-year growth 2024-2029 (%)
        • Data Table on Italy - Year-over-year growth 2024-2029 (%)
      • 13.17 The Netherlands - Market size and forecast 2024-2029
        • Chart on The Netherlands - Market size and forecast 2024-2029 ($ billion)
        • Data Table on The Netherlands - Market size and forecast 2024-2029 ($ billion)
        • Chart on The Netherlands - Year-over-year growth 2024-2029 (%)
        • Data Table on The Netherlands - Year-over-year growth 2024-2029 (%)
      • 13.18 Market opportunity by geography
        • Market opportunity by geography ($ billion)
        • Data Tables on Market opportunity by geography ($ billion)
      • 13.19 Brazil - Market size and forecast (2024-2029)
        • Chart on Brazil - Market size and forecast (2024-2029) ($ billion)
        • Data Table on Brazil - Market size and forecast (2024-2029) ($ billion)
        • Chart on Brazil - Year-over-year growth (2024-2029) (%)
        • Data Table on Brazil - Year-over-year growth (2024-2029) (%)
      • 13.20 Egypt - Market size and forecast (2024-2029)
        • Chart on Egypt - Market size and forecast (2024-2029) ($ billion)
        • Data Table on Egypt - Market size and forecast (2024-2029) ($ billion)
        • Chart on Egypt - Year-over-year growth (2024-2029) (%)
        • Data Table on Egypt - Year-over-year growth (2024-2029) (%)
      • 13.21 UAE - Market size and forecast (2024-2029)
        • Chart on UAE - Market size and forecast (2024-2029) ($ billion)
        • Data Table on UAE - Market size and forecast (2024-2029) ($ billion)
        • Chart on UAE - Year-over-year growth (2024-2029) (%)
        • Data Table on UAE - Year-over-year growth (2024-2029) (%)
      • 13.22 Oman - Market size and forecast (2024-2029)
        • Chart on Oman - Market size and forecast (2024-2029) ($ billion)
        • Data Table on Oman - Market size and forecast (2024-2029) ($ billion)
        • Chart on Oman - Year-over-year growth (2024-2029) (%)
        • Data Table on Oman - Year-over-year growth (2024-2029) (%)
      • 13.23 Argentina - Market size and forecast (2024-2029)
        • Chart on Argentina - Market size and forecast (2024-2029) ($ billion)
        • Data Table on Argentina - Market size and forecast (2024-2029) ($ billion)
        • Chart on Argentina - Year-over-year growth (2024-2029) (%)
        • Data Table on Argentina - Year-over-year growth (2024-2029) (%)
      • 13.24 KSA - Market size and forecast (2024-2029)
        • Chart on KSA - Market size and forecast (2024-2029) ($ billion)
        • Data Table on KSA - Market size and forecast (2024-2029) ($ billion)
        • Chart on KSA - Year-over-year growth (2024-2029) (%)
        • Data Table on KSA - Year-over-year growth (2024-2029) (%)
      • 13.25 Rest of World (ROW) - Market size and forecast (2024-2029)
        • Chart on Rest of World (ROW) - Market size and forecast (2024-2029) ($ billion)
        • Data Table on Rest of World (ROW) - Market size and forecast (2024-2029) ($ billion)
        • Chart on Rest of World (ROW) - Year-over-year growth (2024-2029) (%)
        • Data Table on Rest of World (ROW) - Year-over-year growth (2024-2029) (%)

      14 Drivers, Challenges, and Opportunity/Restraints

      • 14.1 Market drivers
        • 14.2 Market challenges
          • 14.3 Impact of drivers and challenges
            • Impact of drivers and challenges in 2024 and 2029
          • 14.4 Market opportunities/restraints

            15 Competitive Landscape

            • 15.1 Overview
              • 15.2 Competitive Landscape
                • Overview on criticality of inputs and factors of differentiation
              • 15.3 Landscape disruption
                • Overview on factors of disruption
              • 15.4 Industry risks
                • Impact of key risks on business

              16 Competitive Analysis

              • 16.1 Companies profiled
                • Companies covered
              • 16.2 Company ranking index
                • Company ranking index
              • 16.3 Market positioning of companies
                • Matrix on companies position and classification
              • 3D Systems Corp.
                • 3D Systems Corp. - Overview
                • 3D Systems Corp. - Business segments
                • 3D Systems Corp. - Key news
                • 3D Systems Corp. - Key offerings
                • 3D Systems Corp. - Segment focus
                • SWOT
              • 16.5 BASF
                • BASF - Overview
                • BASF - Business segments
                • BASF - Key news
                • BASF - Key offerings
                • BASF - Segment focus
                • SWOT
              • 16.6 Carpenter Technology Corp.
                • Carpenter Technology Corp. - Overview
                • Carpenter Technology Corp. - Business segments
                • Carpenter Technology Corp. - Key news
                • Carpenter Technology Corp. - Key offerings
                • Carpenter Technology Corp. - Segment focus
                • SWOT
              • 16.7 Desktop Metal Inc.
                • Desktop Metal Inc. - Overview
                • Desktop Metal Inc. - Business segments
                • Desktop Metal Inc. - Key news
                • Desktop Metal Inc. - Key offerings
                • Desktop Metal Inc. - Segment focus
                • SWOT
              • 16.8 EOS GmbH
                • EOS GmbH - Overview
                • EOS GmbH - Product / Service
                • EOS GmbH - Key news
                • EOS GmbH - Key offerings
                • SWOT
              • 16.9 General Electric Co.
                • General Electric Co. - Overview
                • General Electric Co. - Business segments
                • General Electric Co. - Key news
                • General Electric Co. - Key offerings
                • General Electric Co. - Segment focus
                • SWOT
              • 16.10 Markforged Holding Corp.
                • Markforged Holding Corp. - Overview
                • Markforged Holding Corp. - Product / Service
                • Markforged Holding Corp. - Key offerings
                • SWOT
              • 16.11 MATERIALISE NV
                • MATERIALISE NV - Overview
                • MATERIALISE NV - Business segments
                • MATERIALISE NV - Key news
                • MATERIALISE NV - Key offerings
                • MATERIALISE NV - Segment focus
                • SWOT
              • 16.12 Proto Labs Inc.
                • Proto Labs Inc. - Overview
                • Proto Labs Inc. - Business segments
                • Proto Labs Inc. - Key offerings
                • Proto Labs Inc. - Segment focus
                • SWOT
              • 16.13 Renishaw Plc
                • Renishaw Plc - Overview
                • Renishaw Plc - Business segments
                • Renishaw Plc - Key offerings
                • Renishaw Plc - Segment focus
                • SWOT
              • 16.14 SHAPEWAYS HOLDINGS INC.
                • SHAPEWAYS HOLDINGS INC. - Overview
                • SHAPEWAYS HOLDINGS INC. - Product / Service
                • SHAPEWAYS HOLDINGS INC. - Key offerings
                • SWOT
              • 16.15 SLM Solutions Group AG
                • SLM Solutions Group AG - Overview
                • SLM Solutions Group AG - Business segments
                • SLM Solutions Group AG - Key offerings
                • SLM Solutions Group AG - Segment focus
                • SWOT
              • 16.16 Stratasys Ltd.
                • Stratasys Ltd. - Overview
                • Stratasys Ltd. - Product / Service
                • Stratasys Ltd. - Key news
                • Stratasys Ltd. - Key offerings
                • SWOT
              • 16.17 TRUMPF SE Co. KG
                • TRUMPF SE Co. KG - Overview
                • TRUMPF SE Co. KG - Product / Service
                • TRUMPF SE Co. KG - Key offerings
                • SWOT
              • 16.18 Velo3D Inc.
                • Velo3D Inc. - Overview
                • Velo3D Inc. - Product / Service
                • Velo3D Inc. - Key offerings
                • SWOT

              17 Appendix

              • 17.1 Scope of the report
                • 17.2 Inclusions and exclusions checklist
                  • Inclusions checklist
                  • Exclusions checklist
                • 17.3 Currency conversion rates for US$
                  • Currency conversion rates for US$
                • 17.4 Research methodology
                  • Research methodology
                • 17.5 Data procurement
                  • Information sources
                • 17.6 Data validation
                  • Data validation
                • 17.7 Validation techniques employed for market sizing
                  • Validation techniques employed for market sizing
                • 17.8 Data synthesis
                  • Data synthesis
                • 17.9 360 degree market analysis
                  • 360 degree market analysis
                • 17.10 List of abbreviations
                  • List of abbreviations

                Research Methodology

                Technavio presents a detailed picture of the market by way of study, synthesis, and summation of data from multiple sources. The analysts have presented the various facets of the market with a particular focus on identifying the key industry influencers. The data thus presented is comprehensive, reliable, and the result of extensive research, both primary and secondary.

                INFORMATION SOURCES

                Primary sources

                • Manufacturers and suppliers
                • Channel partners
                • Industry experts
                • Strategic decision makers

                Secondary sources

                • Industry journals and periodicals
                • Government data
                • Financial reports of key industry players
                • Historical data
                • Press releases

                DATA ANALYSIS

                Data Synthesis

                • Collation of data
                • Estimation of key figures
                • Analysis of derived insights

                Data Validation

                • Triangulation with data models
                • Reference against proprietary databases
                • Corroboration with industry experts

                REPORT WRITING

                Qualitative

                • Market drivers
                • Market challenges
                • Market trends
                • Five forces analysis

                Quantitative

                • Market size and forecast
                • Market segmentation
                • Geographical insights
                • Competitive landscape

                Interested in this report?

                Get your sample now to see our research methodology and insights!

                Download Now

                Frequently Asked Questions

                Metal Material Based 3D Printing market growth will increase by $ 3095.5 bn during 2025-2029.

                The Metal Material Based 3D Printing market is expected to grow at a CAGR of 27.9% during 2025-2029.

                Metal Material Based 3D Printing market is segmented by Type( Iron-based, Titanium, Nickel, Aluminum) End-user( Healthcare, Automotive, Aerospace and defense, Tool and mold making, Others) Technology( PBF, DED, Binder jetting, Metal extrusion, Middle East and Africa)

                3D Systems Corp., BASF SE, Carpenter Technology Corp., Desktop Metal Inc., EOS GmbH, Equispheres Inc., General Electric Co., Markforged Holding Corp., MATERIALISE NV, Ponoko Inc., Proto Labs Inc., Renishaw Plc, Sandvik AB, SHAPEWAYS HOLDINGS INC., Sisma SpA, SLM Solutions Group AG, Stratasys Ltd., Titomic Ltd., TRUMPF SE Co. KG, Velo3D Inc. are a few of the key vendors in the Metal Material Based 3D Printing market.

                North America will register the highest growth rate of 40% among the other regions. Therefore, the Metal Material Based 3D Printing market in North America is expected to garner significant business opportunities for the vendors during the forecast period.

                US, Canada, Germany, UK, Italy, France, China, India, Japan, Brazil, Egypt, UAE, Oman, Argentina, KSA, UAE, Brazil, Rest of World (ROW)

                • Rise in adoption of customized and personalized metal productsThe global metal material based 3D printing market is witnessing a significant rise in the demand for customized and personalized metal products. This trend is being driven by the numerous benefits offered by metal additive manufacturing is the driving factor this market.
                • which allows for highly tailored and unique metal parts to be created.One of the key drivers behind this rise in customized metal products is the ability to optimize design and functionality. With metal additive manufacturing is the driving factor this market.
                • intricate and complex shapes can be easily produced is the driving factor this market.
                • enabling the creation of highly customized parts that perfectly fit a particular application. For example is the driving factor this market.
                • in the medical industry is the driving factor this market.
                • customized implants can be 3D printed to precisely fit the patient anatomy is the driving factor this market.
                • resulting in better implant functionality and patient outcomes. Furthermore is the driving factor this market.
                • metal material based 3D printing allows for the production of one-off or low-volume custom metal parts cost-effectively. This makes it economically viable to create personalized metal products that cater to individual customer demands. For example is the driving factor this market.
                • in the jewelry industry is the driving factor this market.
                • 3D printing enables the production of custom-designed metal jewelry pieces is the driving factor this market.
                • offering customers the ability to have a unique and personalized product.The rise in adoption of customized and personalized metal products is also driven by the growing consumer demand for products that reflect their individuality. Consumers are increasingly seeking unique and customized items is the driving factor this market.
                • and metal additive manufacturing provides a solution to meet these demands. From customized metal accessories to personalized metal artwork is the driving factor this market.
                • the possibilities are endless with metal material based 3D printing. Additionally is the driving factor this market.
                • industries such as aerospace and automotive are leveraging customized metal components to enhance performance and efficiency. In April 2023 is the driving factor this market.
                • 3D Systems successfully verified the performance of NASA new super alloy GRX-810 using their Direct Metal Printing (DMP) platform. This alloy is the driving factor this market.
                • designed for aerospace applications is the driving factor this market.
                • demonstrated exceptional mechanical properties and resistance to extreme temperatures. In 2024 is the driving factor this market.
                • 3D Systems launched a new powder management system for their DMP Flex 200 metal 3D printer is the driving factor this market.
                • emphasizing efficiency and reduced production times.Metal additive manufacturing enables the production of optimized and lightweight metal parts that can reduce fuel consumption is the driving factor this market.
                • improve overall vehicle performance is the driving factor this market.
                • and enhance aircraft aerodynamics. These customized metal components contribute to the advancement of these industries while catering to specific requirements. Moreover is the driving factor this market.
                • metal material based 3D printing offers the flexibility to easily iterate and modify designs. This enables manufacturers to make design changes on the fly and quickly respond to customer feedback is the driving factor this market.
                • leading to further customization. The ability to iterate designs rapidly helps in fine-tuning products and delivering personalized solutions in a shorter timeframe. Thus is the driving factor this market.
                • such factors are expected to increase the demand for metal material based 3D printing is the driving factor this market.
                • which will propel the growth of the market in focus during the forecast period. is the driving factor this market.

                The Metal Material Based 3D Printing market vendors should focus on grabbing business opportunities from the Iron-based segment as it accounted for the largest market share in the base year.
                RIA - Research AI Assistant
                Ask RIA