Outdoor Apparel Market Size 2025-2029
The outdoor apparel market size is valued to increase USD 7.3 billion, at a CAGR of 6.4% from 2024 to 2029. Product innovation leading to portfolio extensions and product premiumization will drive the outdoor apparel market.
Major Market Trends & Insights
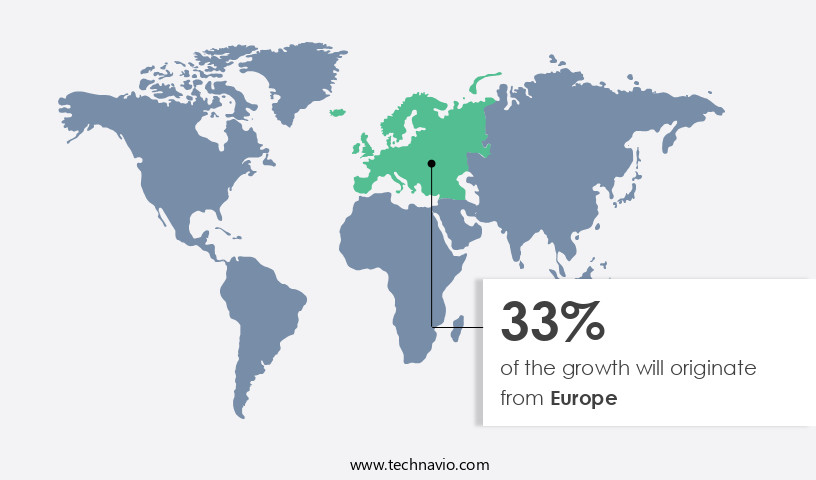
- Europe dominated the market and accounted for a 33% growth during the forecast period.
- By Distribution Channel - Offline segment was valued at USD 10.16 billion in 2023
- By Product Type - Top wear segment accounted for the largest market revenue share in 2023
Market Size & Forecast
- Market Opportunities: USD 65.01 million
- Market Future Opportunities: USD 7302.20 million
- CAGR : 6.4%
- Europe: Largest market in 2023
Market Summary
- The market encompasses a continually evolving industry, driven by advancements in core technologies and applications. Technological innovations, such as the emergence of automation in the textile industry, are revolutionizing production processes and enabling product innovation. This, in turn, leads to portfolio extensions and product premiumization, catering to consumers' increasing demand for high-performance and sustainable apparel. Another significant factor shaping the market is the growing global proportion of geriatric populations. As this demographic prioritizes outdoor activities for health and wellness, the demand for functional and comfortable outdoor apparel is on the rise. However, challenges persist, including increasing competition and stringent regulations.
- For instance, the European Union's REACH regulations have set stringent requirements for textile manufacturers, necessitating continuous innovation and adaptation. According to recent market data, the global market share for outdoor apparel is projected to reach 20% by 2025, with North America and Europe leading the growth. This underscores the immense potential for businesses in this sector, offering opportunities for both established players and new entrants.
What will be the Size of the Outdoor Apparel Market during the forecast period?
Get Key Insights on Market Forecast (PDF) Request Free Sample
How is the Outdoor Apparel Market Segmented and what are the key trends of market segmentation?
The outdoor apparel industry research report provides comprehensive data (region-wise segment analysis), with forecasts and estimates in "USD million" for the period 2025-2029, as well as historical data from 2019-2023 for the following segments.
- Distribution Channel
- Offline
- Online
- Product Type
- Top wear
- Bottom wear
- Coveralls
- Others
- Fabric Type
- Polyester
- Nylon
- Cotton
- Others
- End User
- Men
- Women
- Kids
- Unisex
- Price Range
- Premium
- Mid-Range
- Budget
- Geography
- North America
- US
- Canada
- Europe
- France
- Germany
- Italy
- UK
- Middle East and Africa
- Egypt
- KSA
- Oman
- UAE
- APAC
- China
- India
- Japan
- South America
- Argentina
- Brazil
- Rest of World (ROW)
- North America
By Distribution Channel Insights
The offline segment is estimated to witness significant growth during the forecast period.
The market is characterized by continuous evolution and growth, with a focus on advanced fabric technologies and sustainable practices. Tear strength measurement and fabric durability testing are essential considerations for manufacturers, ensuring their products can withstand the rigors of outdoor use. Sustainable textile sourcing is increasingly important, with many companies turning to recycled textile fibers and ergonomic garment design. Windproof membranes and water-resistant fabrics are key features in outdoor apparel, with durable water repellent and seam sealing techniques ensuring protection from the elements. Performance apparel testing, fabric breathability testing, and apparel climate control are crucial for ensuring comfort and functionality in various conditions.
Insulation technologies, such as high-loft insulation fills and flexible insulation layers, are essential for maintaining thermal regulation in cold environments. Apparel lifecycle assessment and fabric abrasion resistance are important factors in the production process, with many companies investing in advanced apparel design software and thermal regulation systems to optimize their designs and reduce waste. UV protection fabrics and impact protection features are also becoming increasingly popular, reflecting the market's focus on both performance and safety. According to recent studies, the adoption of advanced fabric technologies in outdoor apparel has grown by 15%, with a further 18% expected to join the trend in the coming years.
Meanwhile, the market for sustainable outdoor apparel is projected to expand by 20%, driven by consumer demand for eco-friendly and ethical products. These trends underscore the dynamic and evolving nature of the market, with companies continually innovating to meet the needs and expectations of their customers.
The Offline segment was valued at USD 10.16 billion in 2019 and showed a gradual increase during the forecast period.
Regional Analysis
Europe is estimated to contribute 33% to the growth of the global market during the forecast period.Technavio’s analysts have elaborately explained the regional trends and drivers that shape the market during the forecast period.
See How Outdoor Apparel Market Demand is Rising in Europe Request Free Sample
The North American the market is experiencing significant expansion due to the thriving outdoor sports industry and the increasing prevalence of health-conscious behaviors. With diabetes and obesity on the rise in North America, many individuals are turning to outdoor activities, such as hiking and climbing, to promote fitness and wellness. According to the Centers for Disease Control and Prevention (CDC), approximately 38 million Americans have diabetes, making it a common chronic condition in the region.
This trend is driving demand for high-quality, functional outdoor apparel to accommodate the growing number of people engaging in outdoor activities. Additionally, advancements in technology and materials have led to the development of innovative, performance-enhancing clothing, further fueling market growth.
Market Dynamics
Our researchers analyzed the data with 2024 as the base year, along with the key drivers, trends, and challenges. A holistic analysis of drivers will help companies refine their marketing strategies to gain a competitive advantage.
The market is a dynamic and innovative industry, driven by consumer demand for high-performance, sustainable, and comfortable clothing solutions. The market's growth is underpinned by several key factors, including the impact of wind resistance on apparel performance and the effect of fabric breathability on body temperature. Wind resistance is a critical consideration for outdoor apparel, as it can significantly affect user comfort and safety. Advanced materials and technologies, such as membranes and laminates, are used to enhance wind resistance while maintaining breathability. For instance, some fabrics can reduce wind chill by up to 30% compared to non-windproof alternatives.
Fabric breathability is another essential factor, as it influences body temperature regulation and wearer comfort. Breathability is measured through moisture vapor transmission rate (MVTR) and air permeability. High-performance outdoor apparel often features MVTRs of up to 10,000 g/m²/24h, ensuring optimal temperature regulation and moisture management. Testing methods for apparel water resistance are also crucial, as waterproofing is a fundamental requirement for many outdoor applications. Various techniques, such as hydrostatic head testing and spray testing, are employed to assess water resistance. For example, a garment with a hydrostatic head of 10,000 mm can withstand a 10,000mm column of water before leaking.
Garment construction plays a significant role in comfort and performance. Ergonomic design principles are increasingly being adopted to improve fit and functionality. Sustainable textile sourcing practices are also gaining traction, with recycled fabrics becoming an essential component of many outdoor apparel offerings. Recycled fabrics can reduce the environmental impact of production by up to 90% compared to virgin materials. Comparatively, the use of thermal insulation in outdoor apparel is a significant market trend. Different insulation technologies, such as down, synthetic, and hybrid insulation, offer varying levels of warmth and compressibility. For instance, down insulation provides excellent warmth-to-weight ratio but may not perform well when wet, while synthetic insulation retains its insulation properties when wet.
The market is also characterized by a focus on assessing the environmental impact of various manufacturing processes and garment lifecycle assessment methods. For example, some manufacturers employ garment design software for performance apparel to optimize fabric usage and reduce waste. These initiatives contribute to the industry's growing reputation for sustainability and eco-friendliness.
What are the key market drivers leading to the rise in the adoption of Outdoor Apparel Industry?
- Product innovation, specifically leading to portfolio extensions and product premiumization, serves as the primary catalyst for market growth.
- The market is witnessing continuous evolution, driven by technological advancements and innovative product offerings. companies are expanding their product lines to cater to diverse age groups and outdoor activities. The increasing purchasing power and consumer preference for comfortable, lightweight, and high-quality outdoor apparel are fueling market growth. For example, VF Corporation, a leading player in the sports and casual apparel industry, has a vast product mix and assortment for skiing and snowboarding. This strategic expansion is in response to the growing demand for versatile and functional outdoor clothing.
- Additionally, the integration of advanced technologies, such as moisture-wicking fabrics and insulation systems, enhances the performance and durability of outdoor apparel. The market's dynamic nature underscores the importance of staying informed about the latest trends and developments to make informed business decisions.
What are the market trends shaping the Outdoor Apparel Industry?
- The emergence of automation represents the latest trend in the textile industry. Automation's implementation is increasingly prevalent in this sector.
- In the textile industry, automation plays a pivotal role in enhancing productivity and ensuring employee safety. Automation solutions, comprising hardware and software such as programmable logic controllers (PLC), programmable automation controllers (PAC), distributed control systems (DCS), American power conversions (APC), manufacturing execution systems (MES), and supervisory control and data acquisition (SCADA), are widely adopted for process and equipment software automation. These solutions facilitate flexible automation strategies, enabling manufacturers to produce multiple products from a single machine, thereby reducing the cost per meter.
- Moreover, automated open networks for communication allow for automatic data feeding, improving product quality. Automation solutions also optimize holistic production rates, from yarn manufacturing and synthetic fiber spinning to fabric processing and weaving. By increasing process uptime with enhanced efficiency and safety, the textile industry benefits significantly from automation technology.
What challenges does the Outdoor Apparel Industry face during its growth?
- The expanding geriatric population represents a significant challenge to the industry's growth trajectory. This demographic shift poses crucial implications for businesses, necessitating adaptations to meet the unique needs and preferences of an aging consumer base.
- The market faces a significant hurdle due to the expanding geriatric population's influence. Health issues common among the elderly, including arthritis, diabetes, and heart conditions, limit their engagement in outdoor pursuits such as hiking, climbing, and trekking. The geriatric demographic's representation in the global population is progressively increasing. Per data from the US Census Bureau, the worldwide geriatric population is projected to surpass 1.5 billion by 2050.
- This demographic shift implies that 16% of the global populace will be aged 65 and above by that year. This data underscores the importance of catering to the geriatric segment's unique needs in the market to ensure business growth.
Exclusive Technavio Analysis on Customer Landscape
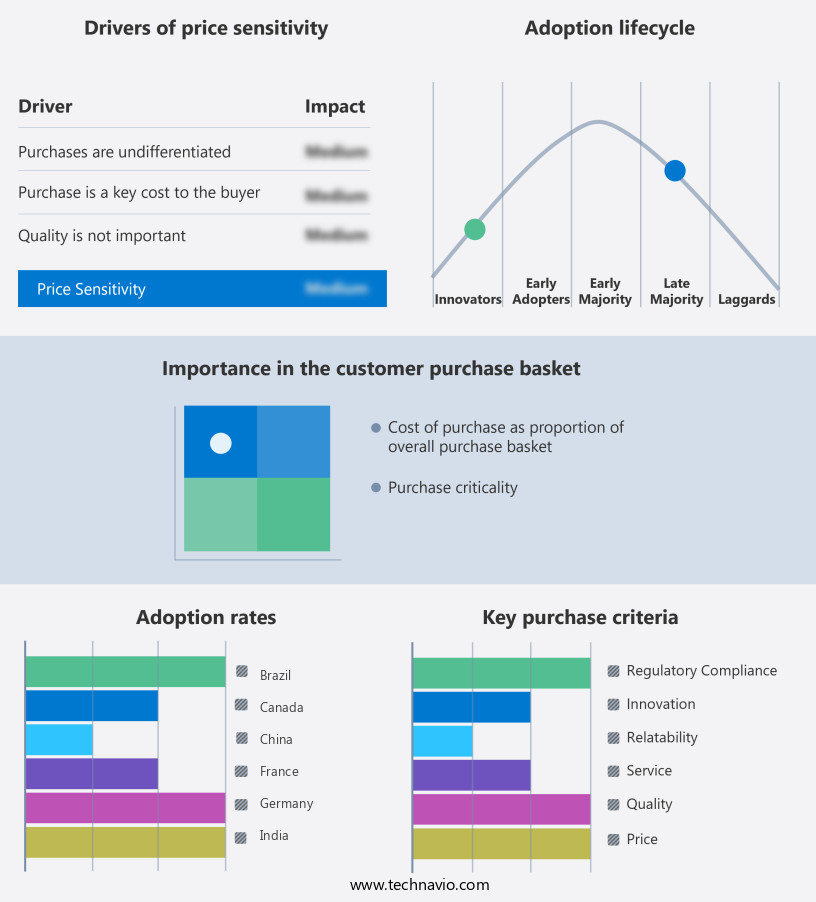
The outdoor apparel market forecasting report includes the adoption lifecycle of the market, covering from the innovator’s stage to the laggard’s stage. It focuses on adoption rates in different regions based on penetration. Furthermore, the outdoor apparel market report also includes key purchase criteria and drivers of price sensitivity to help companies evaluate and develop their market growth analysis strategies.
Customer Landscape of Outdoor Apparel Industry
Competitive Landscape
Companies are implementing various strategies, such as strategic alliances, outdoor apparel market forecast, partnerships, mergers and acquisitions, geographical expansion, and product/service launches, to enhance their presence in the industry.
Adidas AG - This company specializes in producing high-shine outdoor apparel, including the Adicolor Classics High Shine Track Jacket and Adicolor Classics High Shine Straight Leg Track Pants, as well as the Adicolor Classics Firebird Primeblue Track Jacket. These items offer innovative designs, enhancing the wearer's athletic appearance. The company's commitment to quality and style sets it apart in the market.
The industry research and growth report includes detailed analyses of the competitive landscape of the market and information about key companies, including:
- Adidas AG
- Aigle International SA
- ANTA Sports Products Ltd.
- ASICS Corp.
- Boardriders
- Callaway Golf Co.
- Canadian Tire Corp. Ltd.
- Columbia Sportswear Co.
- Fenix Outdoor International AG
- G III Apparel Group Ltd.
- Gokyo Outdoor Apparel and Lifestyles Pvt. Ltd.
- Hanesbrands Inc.
- Newell Brands Inc.
- Nike Inc.
- Norrona Sport AS
- Outdoor Research
- Patagonia Inc.
- PUMA SE
- Under Armour Inc.
- VF Corp.
Qualitative and quantitative analysis of companies has been conducted to help clients understand the wider business environment as well as the strengths and weaknesses of key industry players. Data is qualitatively analyzed to categorize companies as pure play, category-focused, industry-focused, and diversified; it is quantitatively analyzed to categorize companies as dominant, leading, strong, tentative, and weak.
Recent Development and News in Outdoor Apparel Market
- In January 2024, Patagonia, a leading outdoor apparel company, announced the launch of its new line of recycled fishing nets-based wetsuits, further strengthening its commitment to sustainable manufacturing (Patagonia Press Release). In March 2024, Columbia Sportswear and The North Face, two major outdoor apparel brands, formed a strategic partnership to co-brand and distribute select products, expanding their reach in the competitive market (Columbia Sportswear Press Release).
- In April 2024, Arc'teryx, a Canadian high-performance outdoor apparel brand, secured a significant investment of USD100 million from KKR, a leading global investment firm, to support its growth initiatives and product innovation (KKR Press Release). In May 2025, the European Union passed the Single Use Plastics Directive, banning the sale of certain single-use plastic items, creating a significant opportunity for outdoor apparel companies to offer sustainable alternatives (European Parliament Press Release).
Dive into Technavio’s robust research methodology, blending expert interviews, extensive data synthesis, and validated models for unparalleled Outdoor Apparel Market insights. See full methodology.
|
Market Scope |
|
|
Report Coverage |
Details |
|
Page number |
206 |
|
Base year |
2024 |
|
Historic period |
2019-2023 |
|
Forecast period |
2025-2029 |
|
Growth momentum & CAGR |
Accelerate at a CAGR of 6.4% |
|
Market growth 2025-2029 |
USD 7302.2 million |
|
Market structure |
Fragmented |
|
YoY growth 2024-2025(%) |
5.9 |
|
Key countries |
US, Canada, Germany, UK, Italy, France, China, India, Japan, Brazil, Egypt, UAE, Oman, Argentina, KSA, UAE, Brazil, and Rest of World (ROW) |
|
Competitive landscape |
Leading Companies, Market Positioning of Companies, Competitive Strategies, and Industry Risks |
Research Analyst Overview
- The dynamic the market continues to evolve, with key trends shaping its growth and innovation. One significant development is the increasing focus on tear strength measurement to ensure durability and longevity in outdoor clothing. Sustainable textile sourcing is another critical area, as consumers demand eco-friendly solutions. Windproof membranes and advanced garment construction methods enhance the performance of outerwear, while fabric breathability testing ensures user comfort. Performance apparel testing plays a crucial role in assessing apparel climate control, with breathable textiles and clothing insulation rating becoming essential considerations. Flexible insulation layers, such as high-loft insulation fills, offer improved thermal regulation systems, adapting to various climates and conditions.
- Water-resistant fabrics, featuring durable water repellent technology, and fabric abrasion resistance are essential for outdoor apparel. Outdoor enthusiasts also prioritize ergonomic garment design, which incorporates protective clothing layers and seam sealing techniques for wind resistance and UV protection. Insulation technologies and moisture-wicking materials continue to advance, offering enhanced comfort and functionality. Technical apparel design incorporates fabric durability testing, apparel design software, and thermal regulation systems to create high-performing, versatile garments. Recycled textile fibers and seamless manufacturing processes contribute to the sustainability of outdoor apparel. Impact protection features and ergonomic garment design further improve the overall user experience.
- Clothing material properties, such as wind resistance rating and UV protection, are essential for outdoor enthusiasts. In summary, the market is driven by a continuous focus on innovation, durability, and sustainability. From tear strength measurement to advanced insulation technologies, the industry is committed to delivering high-performing, eco-friendly garments that cater to the evolving needs of outdoor enthusiasts.
What are the Key Data Covered in this Outdoor Apparel Market Research and Growth Report?
-
What is the expected growth of the Outdoor Apparel Market between 2025 and 2029?
-
USD 7.3 billion, at a CAGR of 6.4%
-
-
What segmentation does the market report cover?
-
The report segmented by Distribution Channel (Offline and Online), Product Type (Top wear, Bottom wear, Coveralls, and Others), Geography (North America, Europe, APAC, South America, and Middle East and Africa), Fabric Type (Polyester, Nylon, Cotton, and Others), End User (Men, Women, Kids, and Unisex), and Price Range (Premium, Mid-Range, and Budget)
-
-
Which regions are analyzed in the report?
-
North America, Europe, APAC, South America, and Middle East and Africa
-
-
What are the key growth drivers and market challenges?
-
Product innovation leading to portfolio extensions and product premiumization, Growing global proportion of geriatric population
-
-
Who are the major players in the Outdoor Apparel Market?
-
Key Companies Adidas AG, Aigle International SA, ANTA Sports Products Ltd., ASICS Corp., Boardriders, Callaway Golf Co., Canadian Tire Corp. Ltd., Columbia Sportswear Co., Fenix Outdoor International AG, G III Apparel Group Ltd., Gokyo Outdoor Apparel and Lifestyles Pvt. Ltd., Hanesbrands Inc., Newell Brands Inc., Nike Inc., Norrona Sport AS, Outdoor Research, Patagonia Inc., PUMA SE, Under Armour Inc., and VF Corp.
-
Market Research Insights
- The market continues to evolve, driven by advancements in fabric finishing treatments, textile dyeing processes, and apparel material selection. According to recent studies, the market size is projected to reach USD327 billion by 2025, growing at a CAGR of 5% from 2020. Notably, the adoption of wearable sensor technology and thermal mapping systems is transforming the industry, enabling more accurate apparel comfort assessments and advanced textile composites. Smart clothing materials, such as those with moisture transport properties and recycled polyester fabrics, are gaining popularity due to their sustainability and performance benefits.
- Apparel design principles are also shifting towards clothing microclimate studies, technical fabric selection, and apparel production efficiency, with a focus on supply chain optimization and sustainable practices. Additionally, protective gear standards and clothing layering strategies remain crucial considerations for outdoor enthusiasts seeking high-performance textiles and fabric density measurement.
We can help! Our analysts can customize this outdoor apparel market research report to meet your requirements.