Palatants Market Size 2024-2028
The palatants market size is forecast to increase by USD 585.9 million at a CAGR of 6.55% between 2023 and 2028. The market growth is heavily influenced by increasing pet ownership, which drives demand for a broader range of pet-related items. This trend is further supported by the expansion of plant capacity by market vendors, enabling them to scale production and meet growing consumer needs. Additionally, the focus on increasing product offerings by these vendors ensures a diverse selection of high-quality products, catering to the evolving preferences of pet owners. As a result, the combination of rising pet ownership, enhanced manufacturing capabilities, and an expanded product range creates a dynamic environment that propels market growth and fosters continued industry expansion.
What will be the Size of the Market During the Forecast Period?
For More Highlights About this Report, Request Free Sample
Market Dynamic and Customer Landscape
The market is a significant sector within the pet industry, focusing on providing nutritional delivery solutions for pets through various forms of pet food. This market caters to the needs of pet ownerships, prioritizing the health and well-being of cats and dogs. Pet food manufacturers produce a wide range of products, including dry and liquid forms, natural and organic, plant-derived and meat-derived, and nutrient-rich options. Nutritious ingredients, such as proteins and essential nutrients, play a crucial role in ensuring the palatability and overall health benefits of pet food. Compliance processes are essential in maintaining the quality and safety of these products. In recent years, there has been a growing trend towards using natural, plant-based ingredients, upcycled ingredients, and flavors to enhance palatability. Prevention of infections is another crucial aspect of pet food, with manufacturers focusing on incorporating ingredients that support immune system health. The market for palatants is expected to grow due to increasing pet ownerships and the rising awareness of the importance of healthy, nutritious pet food. The market is competitive, with key players including Cat and Dog food manufacturers, focusing on innovation and product development to meet the evolving needs of pet owners.
Key Market Driver
Increasing pet ownership is notably driving market growth. The market encompasses a wide range of products and solutions designed to enhance the nutritional delivery of pet food and animal feed. These include natural products like proteins derived from meat, vegetables, yeasts, phosphates, antioxidants, antimicrobials, aroma compounds, and various animal protein sources. These ingredients play a crucial role in ensuring palatability, which is essential for pet ownership as it encourages pets to consume their food properly. Pet nutrition is a significant concern for many pet owners, particularly for those with pets with sensitive stomachs. Palatants are used to improve the sensorial profile of pet food, making it more appealing to cats, dogs, and even freshwater pets. The e-commerce sector has seen a surge in demand for healthy pet food and nutrient-rich pet food, leading to an increased focus on palatants in the production process. Pet food manufacturers employ various strategies to ensure compliance with nutritional requirements and prevent infections. These include the use of natural ingredients and the addition of supplements to pet food.
Further, the humanizing of pets has also led to an increase in demand for pet treats, which are often made with high-quality palatants to ensure they are irresistible to pets. Palatants are also used in the production of plant-based palatants for vegetarian pet diets. The use of these ingredients ensures that vegetarian pet food maintains a high level of palatability, making it an attractive option for pet owners who prefer to feed their pets plant-based diets. The market for palatants is diverse, with applications ranging from poultry and swine feed to pet food and treats for dogs, cats, and other pets. Thus, such factors are driving the growth of the market during the forecast period.
Signficangt Market Trends
Plant-based and natural palatants gaining traction is the key trend in the market. The market encompasses a wide range of products and solutions designed to enhance the nutritional delivery in pet food and animal feed. These include natural products such as proteins from meat and vegetables, yeasts, phosphates, antioxidants, antimicrobials, and aroma compounds. Compliance with various processes is crucial in this industry to ensure the health and well-being of pets. Pet nutrition caters to various needs, including those with sensitive stomachs, and offers pet treats and supplements. The humanization of pets has led to an increased focus on healthy pet food and nutrient-rich options. Pet food manufacturers prioritize palatability to attract pets, offering a sensorial profile that appeals to their taste and smell.
Moreover, the market serves diverse animal protein sources like poultry and swine, catering to the nutritional requirements of dogs, cats, and freshwater pets. The e-commerce sector's growth has facilitated the availability of a wide range of pet food products, including plant-based palatants and vegetarian pet diets. The prevention of infections and the enhancement of life expectancy are significant factors driving the demand for these solutions. Flavors play a crucial role in pet food, with cat food and dog food each having unique preferences. Thus, such trends will shape the growth of the market during the forecast period.
Major Market Challenge
Stringent regulations on palatants by food regulatory bodies is the major challenge that affects the growth of the market. Palatants play a crucial role in the pet food and animal feed industries, enhancing the sensorial profile and palatability of pet food and ensuring compliance with nutritional delivery solutions. Pet food manufacturers incorporate natural products such as proteins from meat, vegetables, yeasts, phosphates, antioxidants, antimicrobials, and aroma compounds to create nutrient-rich and tasty offerings for dogs, cats, and other pets. Sensitive stomachs require special attention, leading to the development of plant-based palatants and vegetarian pet diets. The e-commerce sector's growth has led to an increase in demand for pet nutrition, with a focus on healthy pet food and infection prevention.
However, natural protein sources like poultry and swine are popular choices for pet food, while cats and dogs often require specific nutrient profiles tailored to their species. Freshwater pets also benefit from palatants to maintain their health and life expectancy. Palatants not only improve the sensory experience for pets but also contribute to the humanization of pets as valued family members. The use of flavors and palatability enhancers in pet treats and supplements further adds to the overall appeal and convenience for pet owners. Hence, the above factors will impede the growth of the market during the forecast period
Customer Landscape
The market forecasting report includes the adoption lifecycle of the market, covering from the innovator’s stage to the laggard’s stage. It focuses on adoption rates in different regions based on penetration. Furthermore, the report also includes key purchase criteria and drivers of price sensitivity to help companies evaluate and develop their market growth analysis strategies.
Customer Landscape
Key Companies & Market Insights
Companies are implementing various strategies, such as strategic alliances, partnerships, mergers and acquisitions, geographical expansion, and product/service launches, to enhance their presence in the market.
Adisseo Co. - The company offers palatants such as liquid and food palatants under the brands Rhodimet, Microvit, SmartLine.
The market research and growth report also includes detailed analyses of the competitive landscape of the market and information about key companies, including:
- Archer Daniels Midland Co.
- BHJ
- Bitek Industries
- BRAIN Biotech AG
- BRF
- Ensign-Bickford Industries Inc.
- Innov Ad NV SA
- Kemin Industries Inc.
- Kent Corp.
- Kerry Group Plc
- Novozymes AS
- Ohly GmbH
- Susheela Group
- Symrise AG
- Trilogy Flavors
- Vetio
Qualitative and quantitative analysis of companies has been conducted to help clients understand the wider business environment as well as the strengths and weaknesses of key market players. Data is qualitatively analyzed to categorize companies as pure play, category-focused, industry-focused, and diversified; it is quantitatively analyzed to categorize companies as dominant, leading, strong, tentative, and weak.
Market Segmentation
By Type
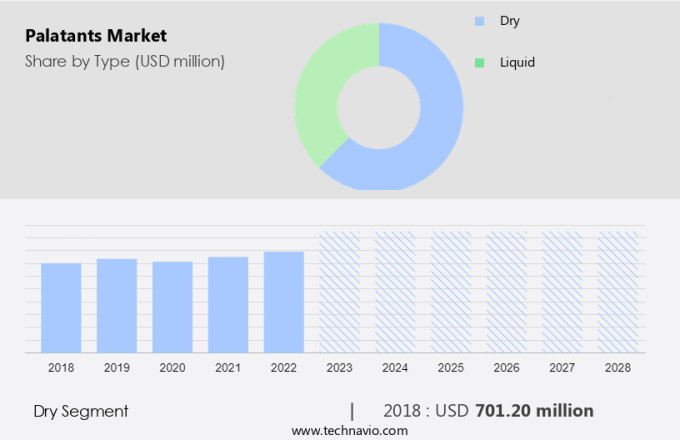
The dry segment is estimated to witness significant growth during the forecast period. Dry palatants play a significant role in the pet food industry, particularly in the production of dry pet food. The popularity of dry kibble among pet owners continues to fuel the demand for these palatants, which are essential in creating appetizing treats for pets. Advanced manufacturing techniques have led to improved performance and a wider range of options for dry palatants. These palatants offer several advantages, including a longer shelf life that minimizes wastage and simplifies logistics. Consumers' increasing preference for natural, minimally processed ingredients in pet food has led to the development of natural dry palatants. These palatants are tailored to meet the specific nutritional needs of various pet breeds, ages, and health conditions, such as sensitive stomachs in dogs and cats, or freshwater pets.
Get a glance at the market share of various regions Download the PDF Sample
The dry was the largest segment was valued at USD 701.20 million in 2018. The sensorial profile of dry palatants is crucial in enhancing the palatability of pet food, ensuring pets consume a healthy and nutrient-rich diet. Pet food manufacturers prioritize the use of dry palatants to create flavorful and appealing pet food, as well as treats, for pets. The e-commerce sector's growth has further increased the importance of dry palatants, as they help maintain the sensorial profile of pet food during transportation and storage. Dry palatants are also used to prevent infections and improve the overall health and life expectancy of pets. Dry palatants are used extensively in the production of cat and dog food, as well as poultry and swine feed. By enhancing the palatability and nutritional value of these products, dry palatants contribute to the overall growth and success of the pet food industry.
Regional Analysis
For more insights on the market share of various regions Download PDF Sample now!
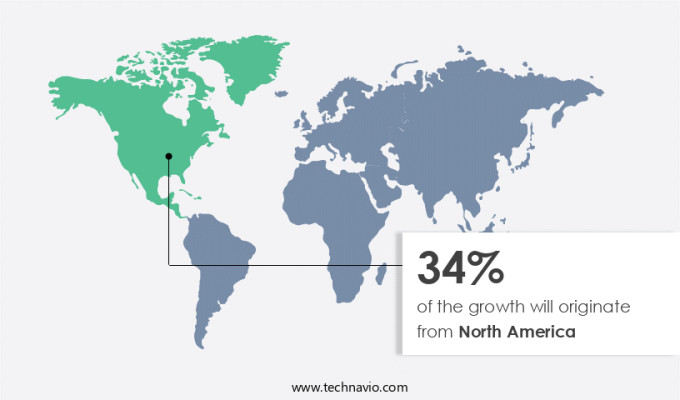
North America is estimated to contribute 34% to the growth of the global market during the forecast period. Technavio’s analysts have elaborately explained the regional trends and drivers that shape the market during the forecast period. The Market caters to the nutritional needs of livestock and pets, offering solutions for various health concerns such as dry skin and obesity. The market is segmented into dry and liquid forms, with the dry segment holding a significant share due to its convenience and sustainability. Personalized pet food, an emerging trend, is customized based on a pet's breed, age, and health conditions, using plant-based and upcycled ingredients. Sustainability concerns and environmentally friendly practices are driving the demand for organic and plant-derived ingredients in pet food. Premium pricing is a common trend in the market, particularly for meat-derived and conventional ingredients. The liquid segment is gaining traction due to its ease of administration and versatility in catering to specific health requirements. Overall, the market prioritizes pet health and well-being while addressing sustainability concerns and consumer preferences.
Segment Overview
The market research report provides comprehensive data (region wise segment analysis), with forecasts and estimates in "USD million" for the period 2024 to 2028, as well as historical data from 2018 to 2022 for the following segments.
- Type Outlook
- Dry
- Liquid
- Source Outlook
- Meat
- Vegetable
- Region Outlook
- North America
- The U.S.
- Canada
- South America
- Chile
- Brazil
- Argentina
- Europe
- U.K.
- Germany
- France
- Rest of Europe
- APAC
- China
- India
- Middle East & Africa
- Saudi Arabia
- South Africa
- Rest of the Middle East & Africa
- North America
You may also interested in below market reports:
- France Pet Food Market by Product and Type - Forecast and Analysis
- Dog Food Market by Product, Distribution Channel, and Geography - Forecast and Analysis
- Pet Food Market Analysis North America, Europe, APAC, South America, Middle East and Africa - US, UK, Japan, Brazil, France - Size and Forecast
Market Analyst Overview
The market is a significant sector that caters to the nutritional needs of pets and livestock. This market focuses on providing nutritional delivery solutions for the Pet Food and Animal Feed industries. Compliance processes are crucial in this market to ensure the safety and quality of products. Natural products, such as Proteins from Meat, Vegetables, Yeasts, Phosphates, Antioxidants, Antimicrobials, Aroma compounds, and various Animal Protein sources, are increasingly used in Palatants. These ingredients not only improve the sensorial profile of Pet Food and Animal Feed but also contribute to the health and well-being of pets and livestock. Pet Nutrition, especially for pets with sensitive stomachs, is a growing trend. Pet Treats and Supplements are popular choices for pet owners seeking to humanize their pets.
Also, the market also caters to Freshwater Pets, Dogs, Cats, and other animals. The E-commerce sector's growth has influenced the market, enabling easy access to a wide range of Pet Food and Animal Feed products. Palatability is a crucial factor in the market, with manufacturers emphasizing the importance of Nutrient-rich pet food and Infection prevention. The market includes various segments, such as Poultry, Swine, and others. The market's growth is driven by the increasing demand for Healthy Pet Food and the desire to enhance the Life Expectancy of pets. Flavors play a significant role in enhancing the appeal of Pet Food and Animal Feed, with Cat Food and Dog Food being the most popular categories.
|
Market Scope |
|
|
Report Coverage |
Details |
|
Page number |
188 |
|
Base year |
2023 |
|
Historic period |
2018-2022 |
|
Forecast period |
2024-2028 |
|
Growth momentum & CAGR |
Accelerate at a CAGR of 6.55% |
|
Market growth 2024-2028 |
USD 585.9 million |
|
Market structure |
Fragmented |
|
YoY growth 2023-2024(%) |
6.11 |
|
Regional analysis |
North America, Europe, APAC, South America, and Middle East and Africa |
|
Performing market contribution |
North America at 34% |
|
Key countries |
US, China, Canada, UK, Germany, and Japan |
|
Competitive landscape |
Leading Companies, Market Positioning of Companies, Competitive Strategies, and Industry Risks |
|
Key companies profiled |
Adisseo Co., Archer Daniels Midland Co., BHJ, Bitek Industries, BRAIN Biotech AG, BRF, Ensign-Bickford Industries Inc., Innov Ad NV SA, Kemin Industries Inc., Kent Corp., Kerry Group Plc, Novozymes AS, Ohly GmbH, Susheela Group, Symrise AG, Trilogy Flavors, and Vetio |
|
Market dynamics |
Parent market analysis, Market growth inducers and obstacles, Fast-growing and slow-growing segment analysis, COVID-19 impact and recovery analysis and future consumer dynamics, Market condition analysis for the market forecast period. |
|
Customization purview |
If our market report has not included the data that you are looking for, you can reach out to our analysts and get segments customized. |
What are the Key Data Covered in this Market Research Report?
- CAGR of the market during the forecast period
- Detailed information on factors that will drive the market growth and forecasting between 2024 and 2028
- Precise estimation of the size of the market and its contribution of the market in focus to the parent market
- Accurate predictions about upcoming market growth and trends and changes in consumer behavior
- Growth of the market across North America, Europe, APAC, South America, and Middle East and Africa
- Thorough analysis of the market’s competitive landscape and detailed information about companies
- Comprehensive analysis of factors that will challenge the growth of market companies


