
APAC Plasterboard Market Size 2025-2029
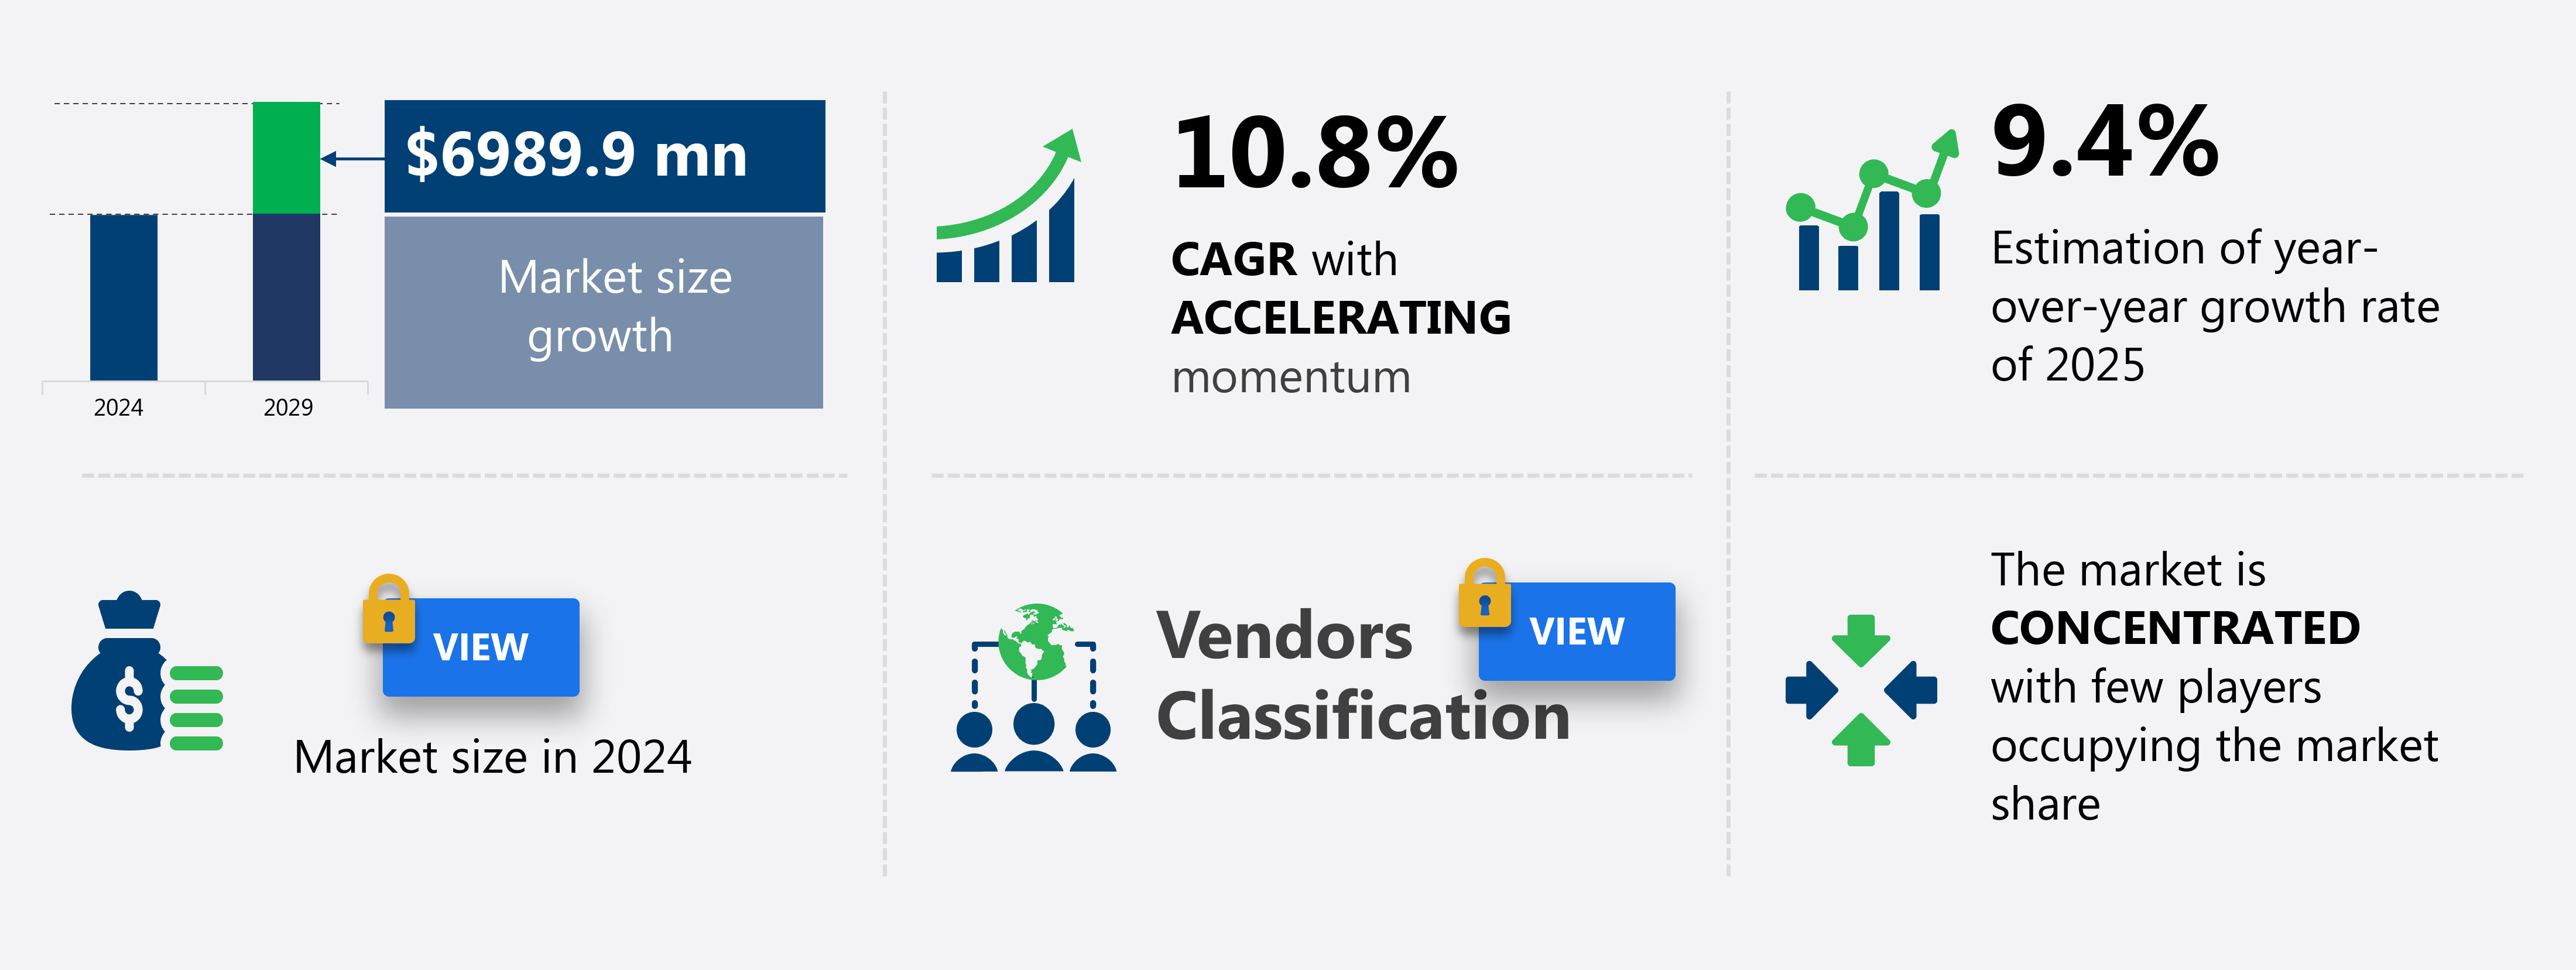
The APAC plasterboard market size is forecast to increase by USD 6.99 billion at a CAGR of 10.8% between 2024 and 2029.
- The plasterboard market is experiencing significant growth due to rapid urbanization and increasing construction activities worldwide. The development of advanced plasterboard materials, such as fire-resistant and moisture-resistant types, is another key growth factor. Waste management is a pressing concern in the plasterboard industry, with efforts underway to reduce waste through the development of lightweight plasterboards and the reuse of waste plasterboard. However, the market is also facing challenges, including the volatility in raw material prices and the presence of numerous local companies, which can impact market competition and pricing. These trends and challenges are shaping the future growth of the global plasterboard market.
What will be the Size of the market During the Forecast Period?
How is this market segmented and which is the largest segment?
The market research report provides comprehensive data (region-wise segment analysis), with forecasts and estimates in "USD billion" for the period 2025-2029, as well as historical data from 2019-2023 for the following segments.
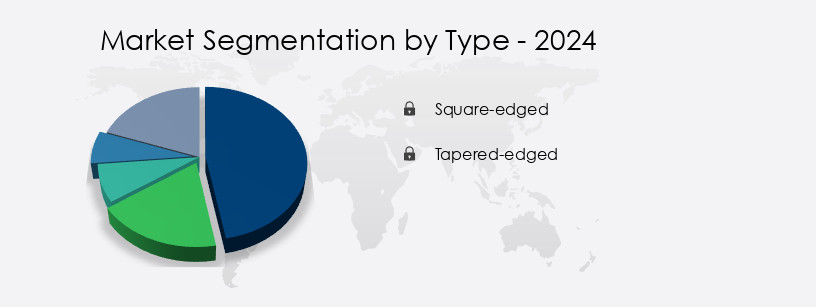
- Type
- Square-edged
- Tapered-edged
- End-user
- Residential
- Non-residential
- Product Type
- Fire-resistant plasterboard
- Fire-resistant plasterboard
- Others
- Geography
- APAC
- China
- Japan
- South Korea
- APAC
By Type Insights
- The square-edged segment is estimated to witness significant growth during the forecast period.
Square-edge plasterboard, a type of gypsum board, features uniform, straight edges and consistent thickness for seamless joint formation, often preferred for ceiling applications due to their flush appearance. Available in decorative and functional options, this building material ensures precision and reliability. In contrast, straight-edge plasterboard boasts a sharp, exact appearance. The plasterboard industry encompasses various raw materials, including gypsum, lining paper, additives, and compounds. Workers utilize these materials to manufacture plasterboards, which are essential for building projects In the residential and construction sectors. Despite the importance of plasterboards in infrastructure and modern retail development, a lack of awareness regarding their benefits persists.
Get a glance at the market report of share of various segments Request Free Sample
Market Dynamics
The plasterboard market encompasses the production and distribution of gypsum-based building materials, including gypsum board, plasterboard, and gypsum panels. This market exhibits significant growth due to the increasing demand for residential and non-residential construction projects. Raw material availability and the workforce are crucial factors influencing market dynamics. However, a lack of awareness regarding the benefits of plasterboard and its alternatives, such as lining paper and plasterboard fluidizers, may hinder market expansion.
The aging population and rebalancing economy are driving infrastructure investments, particularly In the infrastructure sector, which in turn boosts plasterboard demand. Urbanization and social housing initiatives also contribute to market growth. Market trends include the development of acoustic weakening additives to improve sound insulation and the use of lighter, stronger plasterboards for various applications. Building permits and regulations play a crucial role in market direction, with ongoing efforts to streamline the permit process and improve building standards. The construction and infrastructure sectors remain key consumers of plasterboard, with gypsum panel and drywall being the most common forms used.
Our APAC Plasterboard Market researchers analyzed the data with 2024 as the base year, along with the key drivers, trends, and challenges. A holistic analysis of drivers will help companies refine their marketing strategies to gain a competitive advantage.
What are the key market drivers leading to the rise in adoption of APAC Plasterboard Market?
- Rapid urbanization coupled with rise in construction activities is the key driver of the market.
- The Plasterboard market In the Asia-Pacific (APAC) region has experienced notable growth due to urbanization and the construction sector's expansion. The increasing population density has resulted in a heightened demand for plasterboard in both residential and commercial building projects. Governments and developers are investing substantially in housing and infrastructure initiatives to cater to the growing urban populace. For example, India's Pradhan Mantri Awas Yojana (PMAY) scheme, which aims to increase affordable housing, plans to increase subsidies for low-cost housing loans and allocate over 15% more budget to affordable housing, totaling USD1 trillion in 2024. The demand for plasterboard is essential in enhancing interior aesthetics, offering weight reduction, strength, and fire resistance.
- Additionally, the market is witnessing a trend towards environmentally friendly products, including recycled materials, as well as acoustic plasterboards for sound insulation and vapor retarders like Rockwool insulating lamination. The construction sector's investment in sustainable building methods and materials, such as gypsum panels, gypsum board, and drywall, is further driving market growth. Urbanization, infrastructure investments, and the housing shortage are the primary market dynamics fueling the plasterboard market In the APAC region.
What are the market trends shaping the APAC Plasterboard Market?
- Development of advanced plasterboard materials is the upcoming trend In the market.
- Plasterboard, a popular building material for ceiling lining and wall partitions, is witnessing significant advancements due to manufacturers' continuous efforts to enhance its features and technology. The increasing competition among global and regional players is driving the development of innovative and high-quality plasterboards, offering superior strength, crisp edges, and ease of lifting. These improvements aim to cater to the evolving needs of the construction sector, particularly in residential establishments. One notable example is Compagnie de Saint-Gobain's Duo Tech plasterboard, which boasts unique acoustic performance and minimal space requirements. Lightweight plasterboards are also gaining popularity due to their energy efficiency and ease of installation, making them an attractive choice for modern retail and sustainable construction projects.
- Moreover, the rebalancing economy, aging population, and infrastructure investments are fueling the demand for plasterboard in various applications, including urbanization, social housing, and shantytowns. The investment in housing and the housing shortage are further driving the market growth. Environmentally friendly products, such as recycled material and vapor retarders, are gaining traction In the market due to increasing consumer awareness and the real estate industry's focus on sustainable construction practices. Additionally, the use of plasterboard in fire protection, exterior soffits, and structural elements further broadens its applications.
What challenges doesAPAC Plasterboard Market face during the growth?
- Volatility in raw material prices and presence of various local companies is a key challenge affecting the market growth.
- The Plasterboard market experiences volatility due to the unpredictability of raw material prices, particularly gypsum powder and heavy paper sheets, which are essential for manufacturing plasterboards. Global and local companies, such as Knauf Gips, Compagnie de Saint-Gobain, and LafargeHolcim Ltd., face challenges in controlling costs and making investments due to these price fluctuations. End-users, driven by cost considerations, opt for affordable plasterboard options, limiting the sales potential and revenue of major players In the Asia Pacific region.
- Infrastructure investments, urbanization, and the aging population's housing needs contribute to the demand for plasterboard in building projects, including residential construction. However, the lack of awareness regarding environment-friendly products and recycled materials, as well as the prevalence of shantytowns and social housing, hinder the market's growth. The construction and infrastructure sectors' focus on sustainability, soundproof plasterboard, and thermal insulation presents opportunities for innovation and growth.
Exclusive Customer Landscape
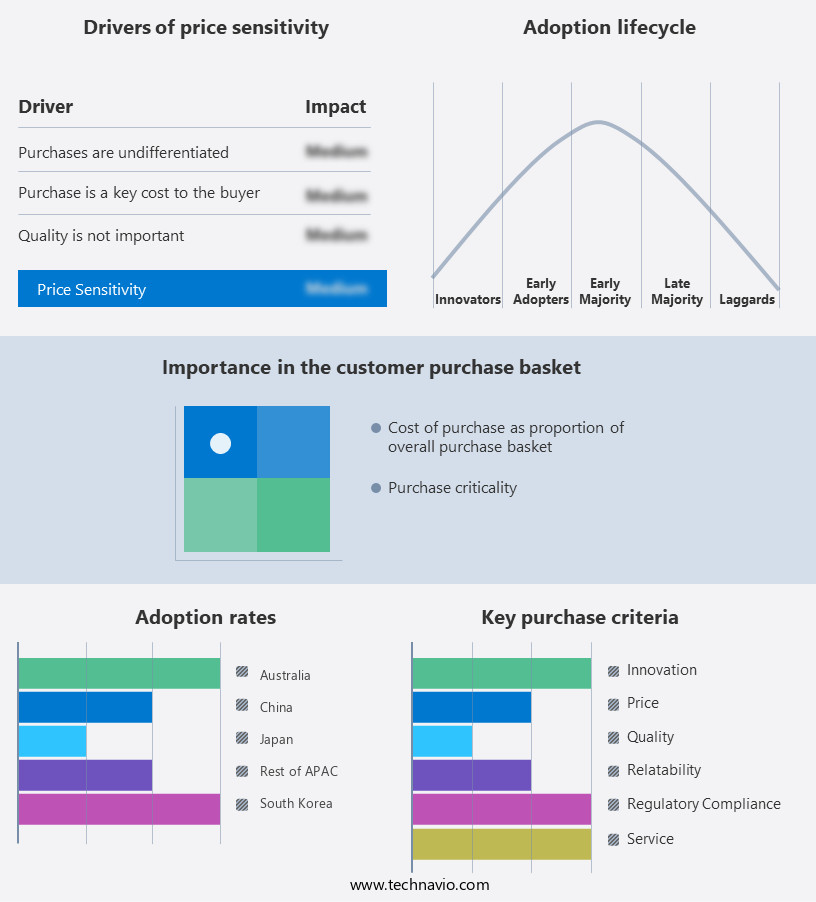
The market forecasting report includes the adoption lifecycle of the market, covering from the innovator’s stage to the laggard’s stage. It focuses on adoption rates in different regions based on penetration. Furthermore, the market report also includes key purchase criteria and drivers of price sensitivity to help companies evaluate and develop their market growth analysis strategies.
Customer Landscape
Key Companies & Market Insights
Companies are implementing various strategies, such as strategic alliances, market forecast , partnerships, mergers and acquisitions, geographical expansion, and product/service launches, to enhance their presence In the market.
BGC Australia PTY Ltd: The company offers plasterboard under the brand name GTEK for walls and ceilings, fire and wet areas, sound and impact installations, or are fulfilling environmental requirements.
The market research and growth report includes detailed analyses of the competitive landscape of the market and information about key companies, including:
- ATISKAN STRUCTURE AND INDUSTRIAL GYPSUM PRODUCTS INDUSTRY. VE TIC
- China National Building Material Co. Ltd.
- Chiyoda Ute Co. Ltd.
- CSR Ltd.
- Compagnie de Saint-Gobain SA
- Eagle Materials Inc.
- Etex NV
- Fletcher Building Ltd.
- Gypelite India Pvt. Ltd.
- India GYPSUM PVT. LTD.
- Knauf Gypsum Pty Ltd.
- Koch Industries Inc.
Qualitative and quantitative analysis of companies has been conducted to help clients understand the wider business environment as well as the strengths and weaknesses of key market players. Data is qualitatively analyzed to categorize companies as pure play, category-focused, industry-focused, and diversified; it is quantitatively analyzed to categorize companies as dominant, leading, strong, tentative, and weak.
Recent News and Developments
- In December 2024, Saint-Gobain launched a new line of eco-friendly plasterboard products in India, emphasizing enhanced fire resistance and sound insulation for residential and commercial applications. This product line incorporates recycled gypsum and energy-efficient manufacturing processes, aligning with India’s push for sustainable construction.
- In October 2024, Knauf Gips KG announced a technological collaboration with a leading Japanese construction technology firm to develop smart plasterboard systems integrated with IoT sensors for real-time monitoring of building health, such as temperature and humidity.
- In September 2024, China National Building Material Co. Ltd. (CNBM) completed the acquisition of a regional plasterboard manufacturer in Southeast Asia, expanding its production capacity by 30 million square meters annually. This strategic move strengthens CNBM’s presence in emerging markets like Indonesia and Vietnam, where infrastructure investments are surging.
- In November 2024, USG Boral expanded its manufacturing footprint by opening a new plasterboard production facility in Thailand, with an annual capacity of 20 million square meters. This geographic expansion targets the growing demand for moisture-resistant and fire-retardant plasterboards in Southeast Asia’s residential and commercial sectors.
Research Analyst Overview
The plasterboard market encompasses a broad range of building materials utilized in both the construction and infrastructure sectors. These materials, also known as gypsum boards or gypsum panels, are essential components in constructing interior walls, ceilings, and partitions. Despite their widespread use, there are several market dynamics that influence the demand for plasterboard. One significant factor is the aging population and the subsequent increase in investment in housing and social infrastructure. As the population grows older, there is a greater need for modifications to existing structures to accommodate accessibility requirements and improve living conditions. This demand translates into an increased focus on renovation projects, which in turn drives the demand for plasterboard.
In addition, another factor impacting the plasterboard market is the rebalancing economy and urbanization. Infrastructure investments and the development of smart cities are creating new opportunities for the use of plasterboards in various applications, such as acoustic plasterboards for sound insulation and fire protection for structural elements. The construction sector's shift towards sustainable construction methods is also influencing the plasterboard market. The use of recycled materials, such as gypsum, In the production of plasterboard is becoming increasingly popular due to its eco-friendly nature. Additionally, the integration of plasterboard with other building materials, such as ceramic tiles, plastic tiles, and metal tiles, is expanding its applications and increasing its market potential.
However, there are challenges facing the plasterboard market. The lack of awareness regarding the benefits of using plasterboard in various applications, particularly in developing countries, presents an obstacle to growth. Furthermore, the high weight and strength requirements of certain projects may limit the use of plasterboard in favor of heavier, more strong materials. Despite these challenges, the plasterboard market is expected to continue growing due to the increasing demand for housing and infrastructure development. The housing shortage, particularly in income levels that cannot afford single family homes or high-density dwellings, is driving demand for affordable housing solutions. Plasterboard's versatility, affordability, and ease of installation make it an attractive option for developers and investors.
Moreover, the plasterboard market is not without its competition. Alternative building materials, such as compounds and lining paper, offer similar benefits but may have different applications or cost structures. Plasterboard manufacturers must remain competitive by continuously innovating and improving their products, such as lightweight plasterboards and plasterboard fluidizers, to meet the evolving needs of the construction sector. As the construction sector continues to evolve, plasterboard's role as a versatile and cost-effective building material is expected to remain strong. However, manufacturers must remain agile and innovative to meet the changing demands of the market and maintain their competitive edge.
|
Market Scope |
|
|
Report Coverage |
Details |
|
Page number |
186 |
|
Base year |
2024 |
|
Historic period |
2019-2023 |
|
Forecast period |
2025-2029 |
|
Growth momentum & CAGR |
Accelerate at a CAGR of 10.8% |
|
Market growth 2025-2029 |
USD 6.99 billion |
|
Market structure |
Concentrated |
|
YoY growth 2024-2025(%) |
9.4 |
|
Competitive landscape |
Leading Companies, Market Positioning of Companies, Competitive Strategies, and Industry Risks |
What are the Key Data Covered in this Market Research and Growth Report?
- CAGR of the market during the forecast period
- Detailed information on factors that will drive the market growth and forecasting between 2025 and 2029
- Precise estimation of the size of the market and its contribution of the market in focus to the parent market
- Accurate predictions about upcoming market growth and trends and changes in consumer behaviour
- Growth of the market across APAC
- Thorough analysis of the market’s competitive landscape and detailed information about companies
- Comprehensive analysis of factors that will challenge the growth of market companies
We can help! Our analysts can customize this market research report to meet your requirements. Get in touch