India Plastic Crates Market Size 2025-2029
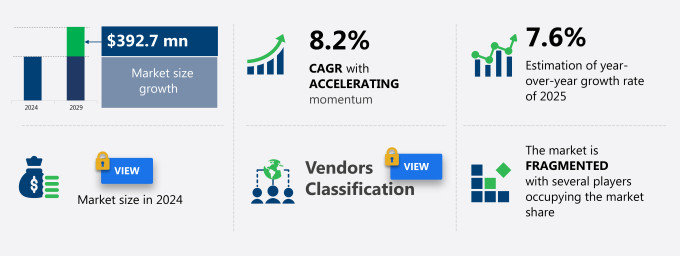
The India plastic crates market size is forecast to increase by USD 392.7 million, at a CAGR of 8.2% between 2024 and 2029.
- The market is experiencing significant growth due to several key trends and factors. Globalization and increasing international trade have expanded the market's reach, allowing businesses to transport goods more efficiently and cost-effectively. Additionally, the advent of plasticulture has led to the widespread use of plastic crates in the agriculture and horticulture industries. The use of sustainable materials, such as high-density polyethylene (HDPE) and polyvinyl chloride (PVC), adds to their appeal. However, the market also faces challenges, such as the growing concern over plastic waste pollution. As the world becomes more environmentally conscious, there is a push for more sustainable packaging solutions. Despite these challenges, the plastic crates market is expected to continue its growth trajectory, driven by its durability, cost-effectiveness, and versatility. The market analysis report provides an in-depth examination of these trends and factors, offering valuable insights for businesses looking to capitalize on the opportunities presented by the plastic crates market.
What will be the size of the market During the Forecast Period?
- The market continues to gain traction in various industries due to their numerous advantages over traditional packaging solutions such as corrugated fibreboard and wooden crates. Plastic crates offer superior weather protection, temperature stability, and durability, making them ideal for transporting and storing a wide range of products, including packaged food and bulk items. With the rise of online shopping and home delivery, the demand for plastic crates has surged, as they ensure the safe and efficient transport of goods. Moreover, plastic crates offer versatility, stackability, and returnability, making them a preferred choice for mass-produced industries.
- Plastic crates are also widely used In the fast food industry for food preservation and in international trade for their strength and flexibility. Customized crates are also gaining popularity, offering businesses a cost-effective solution for transporting and storing their unique products. Overall, the plastic crates market is expected to grow significantly due to these factors and the ongoing shift towards no contact delivery.
How is this market segmented and which is the largest segment?
The market research report provides comprehensive data (region-wise segment analysis), with forecasts and estimates in "USD million" for the period 2025-2029, as well as historical data from 2019-2023 for the following segments.
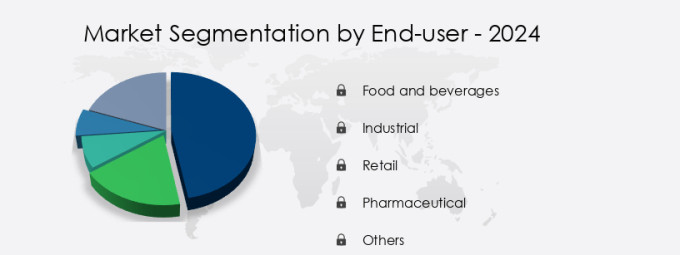
- End-user
- Food and beverages
- Industrial
- Retail
- Pharmaceutical
- Others
- Material
- PE
- PP
- PVC
- Others
- Geography
- India
By End-user Insights
- The food and beverages segment is estimated to witness significant growth during the forecast period.
The Indian food processing industry, comprising approximately 9% of the manufacturing sector, has experienced significant growth in recent years. With increasing personal income and a growing preference for packaged products, the demand for plastic crates in this sector is anticipated to expand at a substantial rate. Plastic crates serve essential functions In the food processing industry, including the secure storage and transportation of packaged food and beverages. For instance, they protect bottles from damage during transit when stacked. The use of plastic crates is particularly prevalent In the processing of meat, fish, vegetables, fruits, and oil, which collectively account for 40% of the industry's output.
Given the industry's fragmented nature, with around 42% of processing occurring In the unorganized sector, the adoption of plastic crates is expected to continue apace due to their cost-effectiveness, durability, and reusability. Additionally, the biodegradable properties of modern high-performance plastic films used In the manufacturing of plastic crates align with evolving environmental concerns, making them a preferred choice for sustainable packaging solutions.
Get a glance at the market report of share of various segments Request Free Sample
Market Dynamics
Our India Plastic Crates Market researchers analyzed the data with 2024 as the base year, along with the key drivers, trends, and challenges. A holistic analysis of drivers will help companies refine their marketing strategies to gain a competitive advantage.
What are the key market drivers leading to the rise in adoption of India's Plastic Crates Market?
Globalization and increasing international trade is the key driver of the market.
- The market has witnessed significant growth in recent years, driven by the rise in international trade activities and the need for safe and efficient goods transportation. Plastic crates offer several advantages over traditional packaging solutions such as Corrugated fibreboard and Wooden crates. They provide superior weather protection and temperature stability and are reusable, making them ideal for industries like Food and Beverage, Agriculture, and Logistics distribution. Online shopping and home delivery have further fueled the demand for plastic crates, as they ensure safe packaging for product preservation during transportation. Customized crates made from High-performance films like High-density polyethylene (HDPE) and Polypropylene (PP) offer versatility, durability, and stackability, making them suitable for mass-produced and bulk packaging.
- Plastic crates are also preferred for their lightweight and corrosion-resistant properties, making them suitable for extreme temperatures and moisture-resistant environments. Reusable crates are a sustainable solution for packaging waste and align with environmental initiatives, making them an attractive option for companies seeking to meet product approval regulations and reduce their carbon footprint. In the context of the food industry, plastic crates offer temperature maintenance and food preservation benefits, ensuring the safe transportation of packaged food items. RFID tags can be integrated into plastic crates, enabling real-time tracking and traceability, which is essential for the fast-food industry and e-commerce businesses.
What are the market trends shaping the India Plastic Crates Market?
The advent of plasticulture is the upcoming trend In the market.
- Plastic crates have gained significant traction in various industries, including agriculture, food and beverage, and international trade, due to their numerous advantages over traditional packaging solutions such as corrugated fibreboard and wooden crates. These crates offer weather protection, temperature stability, and durability, making them ideal for transporting sensitive goods like packaged food and perishable items. In the context of online shopping and home delivery, plastic crates provide a lightweight and stackable solution for mass-produced and returnable packaging. Moreover, plastic crates are reusable, reducing packaging waste and contributing to sustainable products. They are also customizable, allowing for product approval regulations and biodegradable properties to be considered.
- High-performance films, such as high-density polyethylene (HDPE) and polypropylene (PP), are used to enhance the strength and flexibility of these crates. Plastic crates are essential In the food and beverage industry, where temperature maintenance and food preservation are crucial. They are also used extensively in agriculture, particularly In the context of greenhouse cultivation and the transportation of produce. In the logistics distribution sector, plastic crates offer versatility and stackability, making them suitable for bulk packaging and extreme temperatures. Environmental initiatives have led to the development of eco-friendly plastic crates, which are corrosion-resistant, moisture-resistant, and safe for packaging various goods.
What challenges does the India Plastic Crates Market face during the growth?
Growing pollution due to increasing plastic waste generation is a key challenge affecting the market growth.
- Plastic crates, including those made from high-density polyethylene (HDPE) and polypropylene (PP), are widely used in various industries for goods transportation and logistics distribution. While plastic crates offer benefits such as durability, versatility, and stackability, they contribute significantly to packaging waste due to their non-biodegradable nature. This issue is further compounded by the increasing trend of online shopping and home delivery, leading to an increase In the demand for plastic crates. To mitigate the environmental impact, alternative packaging solutions such as corrugated fibreboard and customized wooden crates have gained popularity due to their biodegradable properties and weather protection capabilities.
- Customizable reusable crates are also being adopted for international trade and export activities, reducing the need for mass-produced, disposable plastic crates. In the food and beverage industry, temperature stability is crucial for product preservation and food safety. High-performance films and temperature maintenance technologies are being employed to ensure safe packaging for online food orders and the fast food industry. Sustainable packaging solutions, such as those made from biodegradable materials, are also gaining traction as part of environmental initiatives. RFID tags and other advanced technologies are being integrated into plastic crates to enhance their functionality and improve supply chain efficiency.
Exclusive Customer Landscape
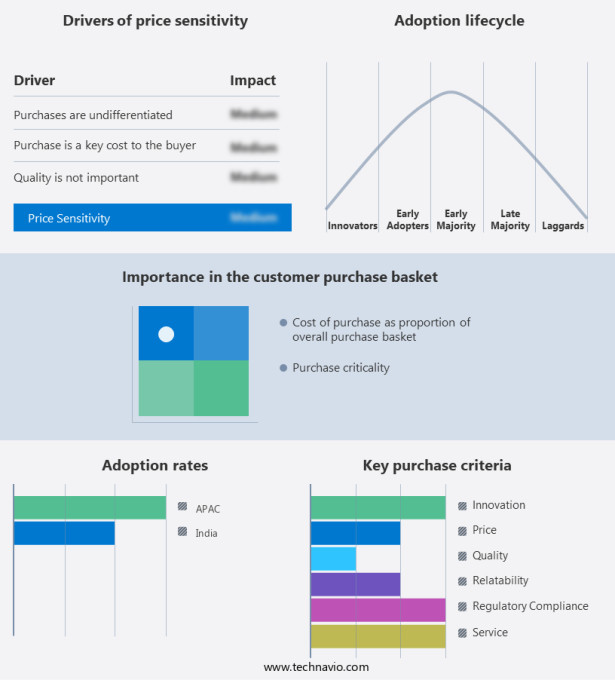
The market forecasting report includes the adoption lifecycle of the market, covering from the innovator's stage to the laggard's stage. It focuses on adoption rates in different regions based on penetration. Furthermore, the market report also includes key purchase criteria and drivers of price sensitivity to help companies evaluate and develop their market growth analysis strategies.
Customer Landscape
Key Companies & Market Insights
Companies are implementing various strategies, such as strategic alliances, market forecast, partnerships, mergers and acquisitions, geographical expansion, and product/service launches, to enhance their presence In the market.
Aristoplast Products Pvt. Ltd. - The company offers plastic crates such as 53200 SP crates, 53200 CHCC and FB crates, and 43320 CC and FB crates.
The market research and growth report includes detailed analyses of the competitive landscape of the market and information about key companies, including:
- Bright Brothers Ltd.
- Brix Industries
- Croma Plast Pvt. Ltd.
- Esquire Multiplast Pvt. Ltd.
- K.M.S. Plastworld Pvt. Ltd.
- MPH Group
- National Plastics
- Nilkamal Ltd.
- R.R. Enterprises
- Rita International
- Samruddhi Industries Ltd.
- Signet Industries Ltd.
- Sri Kamakshi Enterprises.
- Sunshine Plastics
- Swift Technoplast Pvt. Ltd.
- The Supreme Industries Ltd.
- VIP Plastics
- Vishakha Mouldings P. Ltd.
- White Plaast
Qualitative and quantitative analysis of companies has been conducted to help clients understand the wider business environment as well as the strengths and weaknesses of key market players. Data is qualitatively analyzed to categorize companies as pure play, category-focused, industry-focused, and diversified; it is quantitatively analyzed to categorize companies as dominant, leading, strong, tentative, and weak.
Research Analyst Overview
The market encompasses a wide range of packaging solutions designed to protect and transport various goods. Among the various types, plastic crates, corrugated fibreboard crates, and wooden crates are the most common. Each type offers unique advantages, making them suitable for different applications. Plastic crates are renowned for their durability and versatility. These crates are lightweight, making them easy to transport and handle. They are also stackable, allowing for efficient use of storage space. Plastic crates provide excellent protection against moisture, extreme temperatures, and corrosion, making them an ideal choice for various industries, including agriculture, food and beverage, and logistics distribution. Corrugated fibreboard crates, on the other hand, offer a cost-effective alternative to plastic and wooden crates. They are lightweight, easy to assemble, and disposable.
Further, corrugated fibreboard crates provide adequate protection for goods during transportation, especially for lighter items. They are also recyclable, making them an eco-friendly option. Wooden crates, despite being more traditional, still hold a significant market share. They offer excellent strength and flexibility, making them suitable for transporting heavy and bulky goods. Wooden crates can be customized to fit specific product dimensions, providing excellent product protection. However, they are heavier and less stackable compared to plastic and corrugated fibreboard crates. The rise of online shopping and home delivery has led to an increased demand for crates that offer temperature stability. Plastic crates with high-performance films provide excellent insulation, making them suitable for transporting temperature-sensitive goods such as food and beverages. These crates help ensure the safety and quality of the products during transportation, contributing to customer satisfaction.
Moreover, international trade activities and mass-produced goods transportation require crates that are reusable and sustainable. Plastic crates with RFID tags offer a solution, as they can be tracked and monitored throughout the supply chain. Reusable crates also help reduce packaging waste, making them an environmentally friendly option. Product approval regulations play a crucial role In the crate market. Biodegradable properties, such as those found in corrugated fibreboard crates, are becoming increasingly important as environmental initiatives gain popularity. High-density polyethylene and polypropylene are commonly used materials for producing sustainable, reusable crates. The crate market is diverse, with applications ranging from agriculture and food and beverage to logistics distribution and e-commerce. Production technology continues to advance, leading to the development of high-density polyethylene, polyethylene, and polyvinyl chloride crates that offer superior strength and flexibility.
|
Market Scope |
|
|
Report Coverage |
Details |
|
Page number |
163 |
|
Base year |
2024 |
|
Historic period |
2019-2023 |
|
Forecast period |
2025-2029 |
|
Growth momentum & CAGR |
Accelerate at a CAGR of 8.2% |
|
Market Growth 2025-2029 |
USD 392.7 million |
|
Market structure |
Fragmented |
|
YoY growth 2024-2025(%) |
7.6 |
|
Competitive landscape |
Leading Companies, Market Positioning of Companies, Competitive Strategies, and Industry Risks |
What are the Key Data Covered in this Market Research and Growth Report?
- CAGR of the market during the forecast period
- Detailed information on factors that will drive the market growth and forecasting between 2025 and 2029
- Precise estimation of the size of the market and its contribution of the market in focus to the parent market
- Accurate predictions about upcoming market growth and trends and changes in consumer behaviour
- Growth of the market across India
- Thorough analysis of the market's competitive landscape and detailed information about companies
- Comprehensive analysis of factors that will challenge the growth of market companies
We can help! Our analysts can customize this market research report to meet your requirements.