Portable Battery Pack Market Size 2024-2028
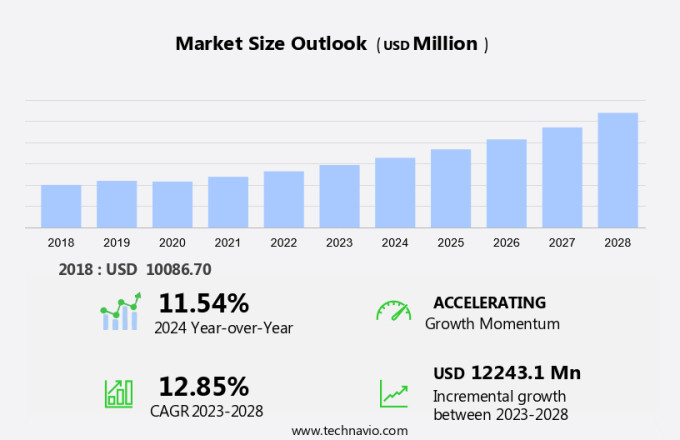
The portable battery pack market size is forecast to increase by USD 12.24 billion at a CAGR of 12.85% between 2023 and 2028. The market is experiencing significant growth due to several key drivers. One of the primary factors is the declining prices of lithium-ion batteries, making these power sources increasingly affordable for various applications. Additionally, there is a growing trend towards the use of sustainable and eco-friendly batteries, as concerns about the environment become more prevalent. This shift is particularly noticeable in sectors such as wind energy, where portable battery packs are used to store excess power generated by renewable sources. Furthermore, the increasing popularity of medical devices, fitness bands, and hearing aids that require regular charging is driving demand for portable battery packs.
What will be the Size of the Market During the Forecast Period?
Market Segmentation
The market research report provides comprehensive data (region-wise segment analysis), with forecasts and estimates in "USD million" for the period 2024-2028, as well as historical data from 2018-2022 for the following segments.
- Distribution Channel
- Online
- Offline
- Type
- Smart phones
- Tablet
- Laptop
- Portable media device
- Others
- Geography
- APAC
- China
- India
- North America
- US
- Europe
- South America
- Brazil
- Middle East and Africa
- APAC
By Distribution Channel Insights
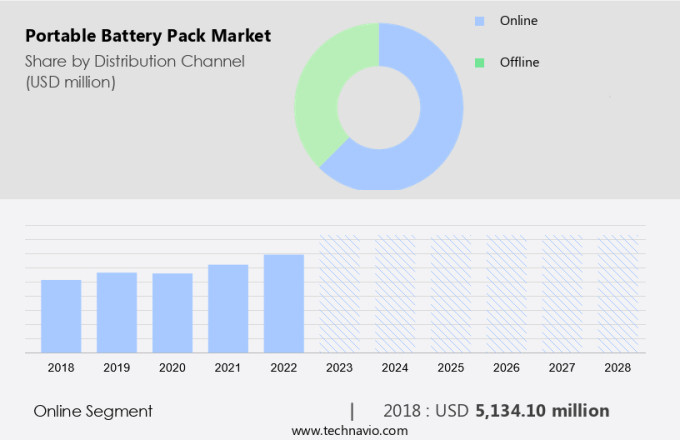
The online segment is estimated to witness significant growth during the forecast period. The market is witnessing substantial growth due to several factors, including the expanding internet connectivity and the growing preference for online shopping among consumers. This trend is particularly noticeable in the online distribution segment, which is expected to experience significant growth in the coming years. Online shopping provides customers with the convenience of purchasing portable battery packs at their own pace and from the comfort of their homes.
In response to this trend, numerous manufacturers of portable battery packs are making their products available for purchase online, either via their own websites or through popular e-commerce platforms such as Amazon, Alibaba, and Flipkart. By listing their offerings on these platforms, companies can expand their reach and increase brand visibility. This shift towards online sales is a strategic move to cater to the changing consumer behavior and preferences.
Get a glance at the market share of various segments Request Free Sample
The online segment accounted for USD 5.13 billion in 2018 and showed a gradual increase during the forecast period.
Regional Insights
APAC is estimated to contribute 41% to the growth of the global market during the forecast period. Technavio's analysts have elaborately explained the regional trends and drivers that shape the market during the forecast period.
For more insights on the market share of various regions Request Free Sample
In the global market for portable battery packs, countries in the Asia Pacific region (APAC) hold a significant revenue share. The substantial population growth and increasing urbanization in nations like India and China have fueled the demand for portable battery packs to power various electronic devices, including laptops and smartphones. As the middle class expands in these countries, consumers have more disposable income to invest in consumer electronics such as laptops, smartphones, and other portable gadgets that require batteries. The proliferation of e-commerce in APAC has made it simpler for consumers to acquire portable battery packs, ensuring hassle-free and efficient purchasing. Two primary types of batteries dominate the market: Nickel-cadmium (Ni-Cd) and Lithium-ion (Li-ion). The Li-ion polymer segment is gaining popularity due to its lightweight, high energy density, and long cycle life. Portable medical equipment is another significant application area for portable battery packs, as they offer the convenience of mobility and extended battery life.
Our researchers analyzed the data with 2023 as the base year, along with the key drivers, trends, and challenges. A holistic analysis of drivers will help companies refine their marketing strategies to gain a competitive advantage.
Market Driver
The declining Li-ion battery prices is notably driving market growth. The market encompasses a wide range of electrical batteries used to power various portable electronic gadgets, power tools, and energy storage systems. Technological advancements have led to the development of various types of batteries, including Lead Acid, Nickel Metal Hydride, Lithium-ion Polymer, and Nickel Cadmium. These batteries cater to diverse applications, such as electric vehicles, construction activities, infrastructure development, and the automotive sector. Warming trends in the automotive sector and the increasing popularity of electric vehicles have fueled the demand for high-wattage batteries. Similarly, the proliferation of smartphones, tablets, and other consumer electronics has boosted the demand for portable battery packs. In the medical sector, portable medical equipment relies on these batteries for uninterrupted power supply. Renewable energy sources, such as solar and wind energy, have also increased the demand for portable battery packs. However, regulatory guidelines regarding chemical energy and fire risk associated with batteries pose challenges to market growth. Lithium-ion batteries, particularly the Lithium-ion polymer segment, dominate the market due to their high conversion efficiency and long battery life. The market is expected to grow significantly in the coming years, with FMI predictions indicating a strong expansion. Despite the opportunities, piracy-related threats and competition from fossil fuels pose challenges to market growth. The market caters to various end-users, including the telecommunication industry, construction activities, and the automotive sector. Battery management software plays a crucial role in ensuring the efficient use and safety of portable battery packs. Thus, such factors are driving the growth of the market during the forecast period.
Market Trends
The growing use of sustainable and eco-friendly batteries is the key trend in the market. The market encompasses the production and distribution of electrical batteries designed for use in various applications, including warming systems, electric vehicles, power tools, and electronic devices. Technological advancements have led to the development of various battery types, such as Lead Acid, Nickel Metal Hydride, Lithium-ion Polymer, and Nickel Cadmium, each with distinct advantages in terms of wattage, safety, and conversion efficiency. The market caters to diverse sectors, including the automotive industry, construction activities, infrastructure development, telecommunication, consumer electronics, and medical equipment. Electric vehicles and renewable energy sources, such as solar and wind energy, are driving the demand for portable battery packs. However, regulatory guidelines regarding chemical energy and fire risk are crucial considerations. Lithium-ion batteries, particularly the Lithium-ion polymer segment, dominate the market due to their high energy density and long cycle life. Portable electronic gadgets, power tools, and cordless drills are significant consumers. The coronavirus pandemic has accelerated the shift from fossil fuels to renewable energy resources, further boosting the market. Despite the market's growth potential, piracy-related threats pose a significant challenge. According to FMI predictions, the market is expected to expand at a steady pace in the coming years. Thus, such trends will shape the growth of the market during the forecast period.
Market Challenge
The growing environmental concerns is the major challenge that affects the growth of the market. The market encompasses a wide range of electrical battery solutions designed for powering various electronic devices, electric vehicles, and energy storage systems. Technological advancements have led to the development of diverse battery types, including Lead Acid, Nickel Metal Hydride, Lithium-ion Polymer, and Nickel Cadmium. These batteries cater to the energy requirements of numerous sectors such as construction activities, infrastructure development, automotive, consumer electronics, telecommunication, and medical equipment. Wattage demands vary significantly across applications, from powering smartphones and tablets to electric vehicles and heavy-duty power tools like cordless drills. Lithium-ion batteries, particularly the Lithium-ion Polymer segment, have gained popularity due to their high energy density, long cycle life, and conversion efficiency. However, concerns regarding fire risk and regulatory guidelines necessitate continuous improvements in battery safety and performance. The market is influenced by several factors, including the shift towards renewable energy sources, the growing demand for portable electronic gadgets, and the increasing adoption of electric vehicles. Fossil fuels are being replaced by renewable energy resources such as solar and wind energy. FMI predictions suggest that the market will continue to grow, with the consumer electronics and automotive sectors being major contributors. Despite the market's potential, challenges persist, including piracy-related threats and the need for battery management software to ensure optimal performance and safety. Portable medical equipment is a critical application area, where reliable and efficient battery solutions are essential. Overall, the market is poised for significant growth, driven by technological advancements, evolving consumer preferences, and regulatory requirements. Hence, the above factors will impede the growth of the market during the forecast period.
Exclusive Customer Landscape
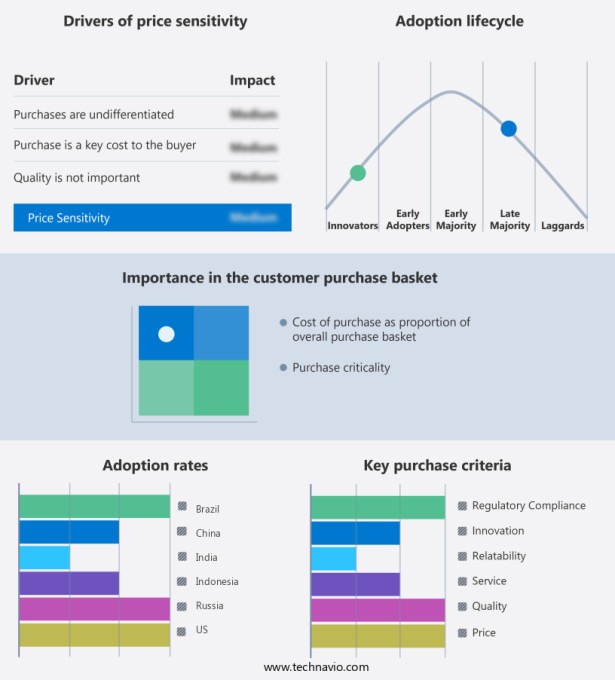
The market forecasting report includes the adoption lifecycle of the market, covering from the innovator's stage to the laggard's stage. It focuses on adoption rates in different regions based on penetration. Furthermore, the report also includes key purchase criteria and drivers of price sensitivity to help companies evaluate and develop their market growth analysis strategies.
Customer Landscape
Key Companies & Market Insights
Companies are implementing various strategies, such as strategic alliances, partnerships, mergers and acquisitions, geographical expansion, and product/service launches, to enhance their presence in the market.
Anker Technology UK Ltd. - The company offers portable battery pack such as Anker PowerCore Essential 20K, Anker PowerCore 10K, and Anker PowerCore plus 24K for laptops, tablets, and smartphones.
The market research and growth report includes detailed analyses of the competitive landscape of the market and information about key companies, including:
- ADATA Technology Co. Ltd.
- ASUSTeK Computer Inc.
- AUKEY Online
- Belkin International Inc.
- BYD Co. Ltd.
- ChargeTech Inc.
- Energizer Holdings Inc.
- Huawei Technologies Co. Ltd.
- Intex Technologies India Ltd.
- Jackery Inc.
- LG Chem Ltd.
- Panasonic Holdings Corp.
- Samsung Electronics Co. Ltd.
- Shenzhen Bak Battery Co. Ltd.
- Simplo Technology Co. Ltd.
- Sony Group Corp.
- The Duracell Co.
- Xiaomi Communications Co. Ltd.
- ZAGG Inc.
Qualitative and quantitative analysis of companies has been conducted to help clients understand the wider business environment as well as the strengths and weaknesses of key market players. Data is qualitatively analyzed to categorize companies as pure play, category-focused, industry-focused, and diversified; it is quantitatively analyzed to categorize companies as dominant, leading, strong, tentative, and weak.
Research Analyst Overview
The market is witnessing significant growth due to the increasing demand for power on-the-go. Electrical batteries have become an integral part of our daily lives, powering various electronic devices such as smartphones, tablets, and portable electronic gadgets. The market is driven by advancements in technology, with the shift from traditional lead-acid and nickel metal hydride batteries to lithium-ion polymer and nickel-cadmium batteries. The automotive sector, construction activities, and infrastructure development are major contributors to the market's growth. Lithium-ion batteries are gaining popularity due to their high energy density, long cycle life, and high conversion efficiency. The market is also witnessing growth in the renewable energy sector, with the integration of battery packs in energy storage systems and the use of battery management software for optimizing performance.
The market is also influenced by regulatory guidelines, fire risk, and conversion efficiency. Portable battery packs are increasingly being used in medical devices, consumer electronics, telecommunication, power tools, and cordless drills. The coronavirus pandemic has led to an increase in the demand for portable battery packs as people work and study from home. The market is expected to grow further with the increasing adoption of renewable energy resources such as solar and wind energy. However, piracy-related threats and the high cost of lithium-ion batteries remain challenges for market growth. The lithium-ion polymer segment is expected to dominate the market due to its high energy density and long cycle life.
The market is also witnessing growth in the consumer electronics and medical devices sectors. The market is highly competitive, with companies focusing on innovation and customized solutions to meet the diverse needs of consumers.
|
Market Scope |
|
|
Report Coverage |
Details |
|
Page number |
198 |
|
Base year |
2023 |
|
Historic period |
2018-2022 |
|
Forecast period |
2024-2028 |
|
Growth momentum & CAGR |
Accelerate at a CAGR of 12.85% |
|
Market growth 2024-2028 |
USD 12.24 billion |
|
Market structure |
Fragmented |
|
YoY growth 2023-2024(%) |
11.54 |
|
Regional analysis |
APAC, North America, Europe, South America, and Middle East and Africa |
|
Performing market contribution |
APAC at 41% |
|
Key countries |
China, India, US, Indonesia, Brazil, and Russia |
|
Competitive landscape |
Leading Companies, Market Positioning of Companies, Competitive Strategies, and Industry Risks |
|
Key companies profiled |
ADATA Technology Co. Ltd., Anker Technology UK Ltd., ASUSTeK Computer Inc., AUKEY Online, Belkin International Inc., BYD Co. Ltd., ChargeTech Inc., Energizer Holdings Inc., Huawei Technologies Co. Ltd., Intex Technologies India Ltd., Jackery Inc., LG Chem Ltd., Panasonic Holdings Corp., Samsung Electronics Co. Ltd., Shenzhen Bak Battery Co. Ltd., Simplo Technology Co. Ltd., Sony Group Corp., The Duracell Co., Xiaomi Communications Co. Ltd., and ZAGG Inc. |
|
Market dynamics |
Parent market analysis, market growth inducers and obstacles, market forecast, fast-growing and slow-growing segment analysis, COVID-19 impact and recovery analysis and future consumer dynamics, market condition analysis for the forecast period |
|
Customization purview |
If our market report has not included the data that you are looking for, you can reach out to our analysts and get segments customized. |
What are the Key Data Covered in this Market Research and Growth Report?
- CAGR of the market during the forecast period
- Detailed information on factors that will drive the market growth and forecasting between 2024 and 2028
- Precise estimation of the size of the market and its contribution of the market in focus to the parent market
- Accurate predictions about upcoming market growth and trends and changes in consumer behaviour
- Growth of the market across APAC, North America, Europe, South America, and Middle East and Africa
- Thorough analysis of the market's competitive landscape and detailed information about companies
- Comprehensive analysis of factors that will challenge the growth of market companies
We can help! Our analysts can customize this market research report to meet your requirements. Get in touch


