Semiconductor Dielectric Etching Equipment Market Analysis, Size, and Forecast 2026-2030: APAC (China, Japan, and India), North America (US, Canada, and Mexico), Europe (Germany, UK, and France), South America (Brazil and Argentina), Middle East and Africa (Saudi Arabia, UAE, and South Africa), and Rest of World (ROW)

Semiconductor Dielectric Etching Equipment Market Analysis, Size, and Forecast 2026-2030:
APAC (China, Japan, and India), North America (US, Canada, and Mexico), Europe (Germany, UK, and France), South America (Brazil and Argentina), Middle East and Africa (Saudi Arabia, UAE, and South Africa), and Rest of World (ROW)

Published: Dec 2025 286 Pages SKU: IRTNTR80157

Market Overview at a Glance

$2.09 B
Market Opportunity
9.7%
CAGR 2025 - 2030
61.9%
APAC Growth
$2.54 B
Dry etching systems segment 2024

Semiconductor Dielectric Etching Equipment Market Size 2026-2030

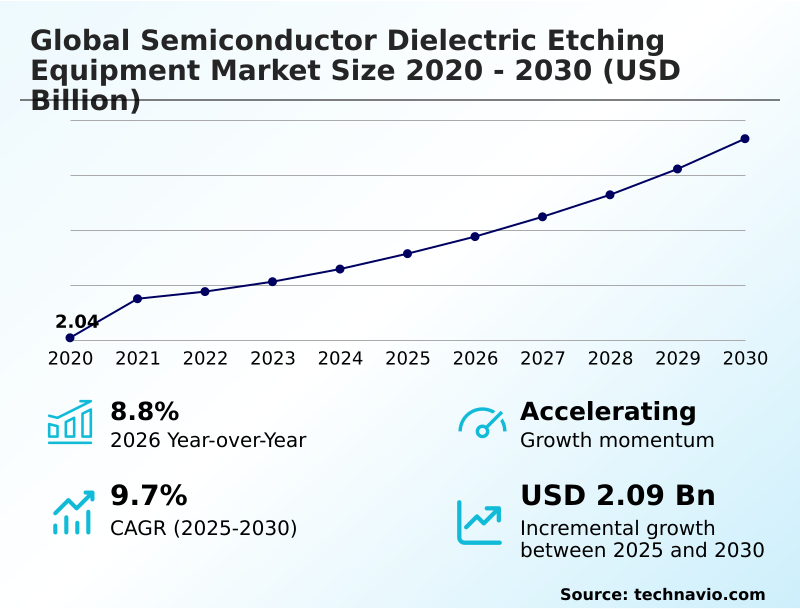
The semiconductor dielectric etching equipment market size is valued to increase by USD 2.09 billion, at a CAGR of 9.7% from 2025 to 2030. Rising demand for consumer electronics will drive the semiconductor dielectric etching equipment market.

Major Market Trends & Insights

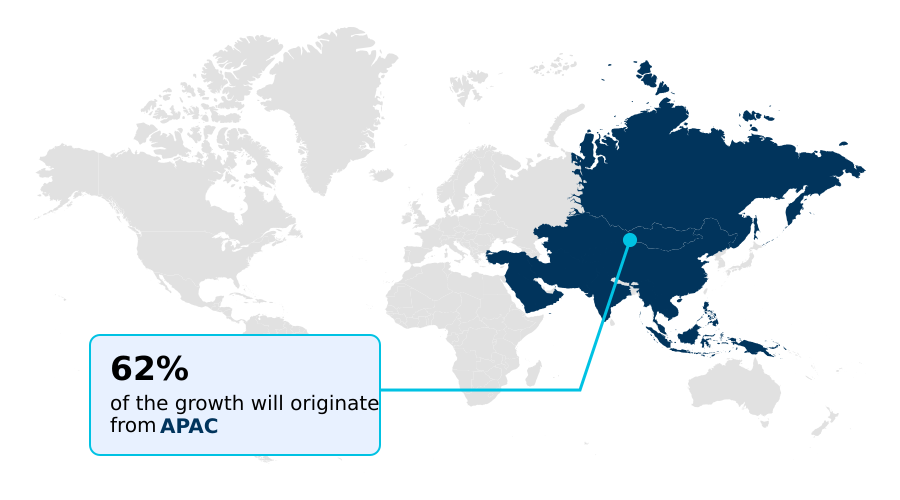
  • APAC dominated the market and accounted for a 61.9% growth during the forecast period.
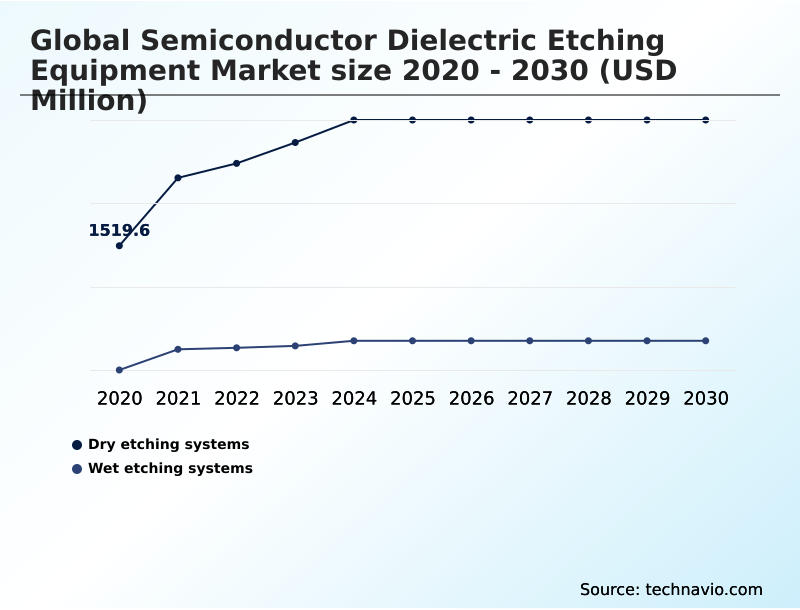
  • By Type - Dry etching systems segment was valued at USD 2.54 billion in 2024
  • By Application - Front-end process segment accounted for the largest market revenue share in 2024

Market Size & Forecast

  • Market Opportunities: USD 3.62 billion
  • Market Future Opportunities: USD 2.09 billion
  • CAGR from 2025 to 2030 : 9.7%

Market Summary

What will be the Size of the Semiconductor Dielectric Etching Equipment Market during the forecast period?

Get Key Insights on Market Forecast (PDF) Request Free Sample

How is the Semiconductor Dielectric Etching Equipment Market Segmented?

The semiconductor dielectric etching equipment industry research report provides comprehensive data (region-wise segment analysis), with forecasts and estimates in "USD million" for the period 2026-2030, as well as historical data from 2020-2024 for the following segments.

  • Type
    • Dry etching systems
    • Wet etching systems
  • Application
    • Front-end process
    • Back-end process
  • End-user
    • Foundries
    • Integrated device manufacturers
  • Geography
    • APAC
      • China
      • Japan
      • India
    • North America
      • US
      • Canada
      • Mexico
    • Europe
      • Germany
      • UK
      • France
    • South America
      • Brazil
      • Argentina
    • Middle East and Africa
      • Saudi Arabia
      • UAE
      • South Africa
    • Rest of World (ROW)

By Type Insights

The dry etching systems segment is estimated to witness significant growth during the forecast period.

Request Free Sample

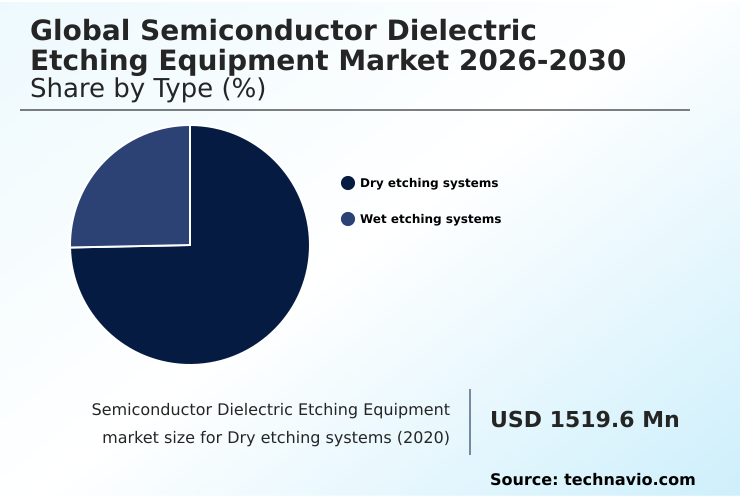
The Dry etching systems segment was valued at USD 2.54 billion in 2024 and showed a gradual increase during the forecast period.

Request Free Sample

Regional Analysis

APAC is estimated to contribute 61.9% to the growth of the global market during the forecast period.Technavio’s analysts have elaborately explained the regional trends and drivers that shape the market during the forecast period.

See How Semiconductor Dielectric Etching Equipment Market Demand is Rising in APAC Request Free Sample

Market Dynamics

Our researchers analyzed the data with 2025 as the base year, along with the key drivers, trends, and challenges. A holistic analysis of drivers will help companies refine their marketing strategies to gain a competitive advantage.

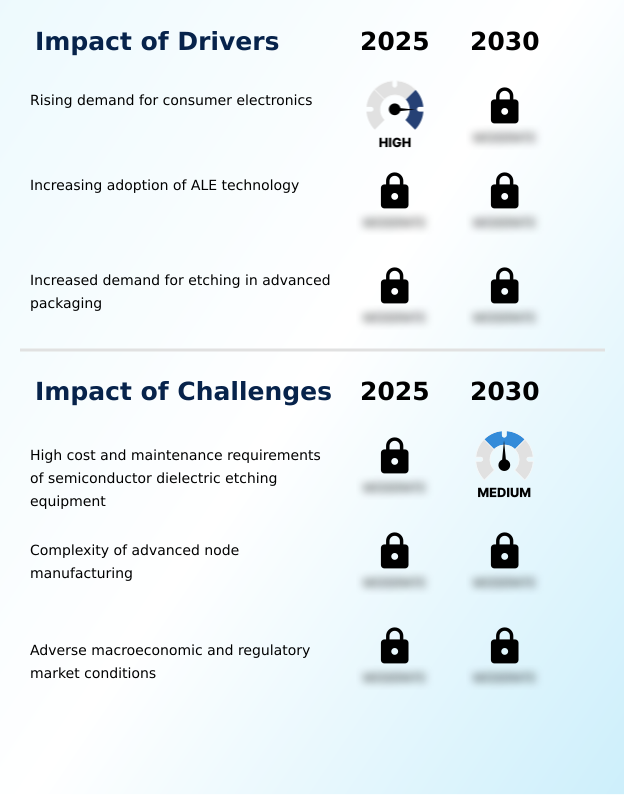
What are the key market drivers leading to the rise in the adoption of Semiconductor Dielectric Etching Equipment Industry?

What are the market trends shaping the Semiconductor Dielectric Etching Equipment Industry?

What challenges does the Semiconductor Dielectric Etching Equipment Industry face during its growth?

Exclusive Technavio Analysis on Customer Landscape

The semiconductor dielectric etching equipment market forecasting report includes the adoption lifecycle of the market, covering from the innovator’s stage to the laggard’s stage. It focuses on adoption rates in different regions based on penetration. Furthermore, the semiconductor dielectric etching equipment market report also includes key purchase criteria and drivers of price sensitivity to help companies evaluate and develop their market growth analysis strategies.

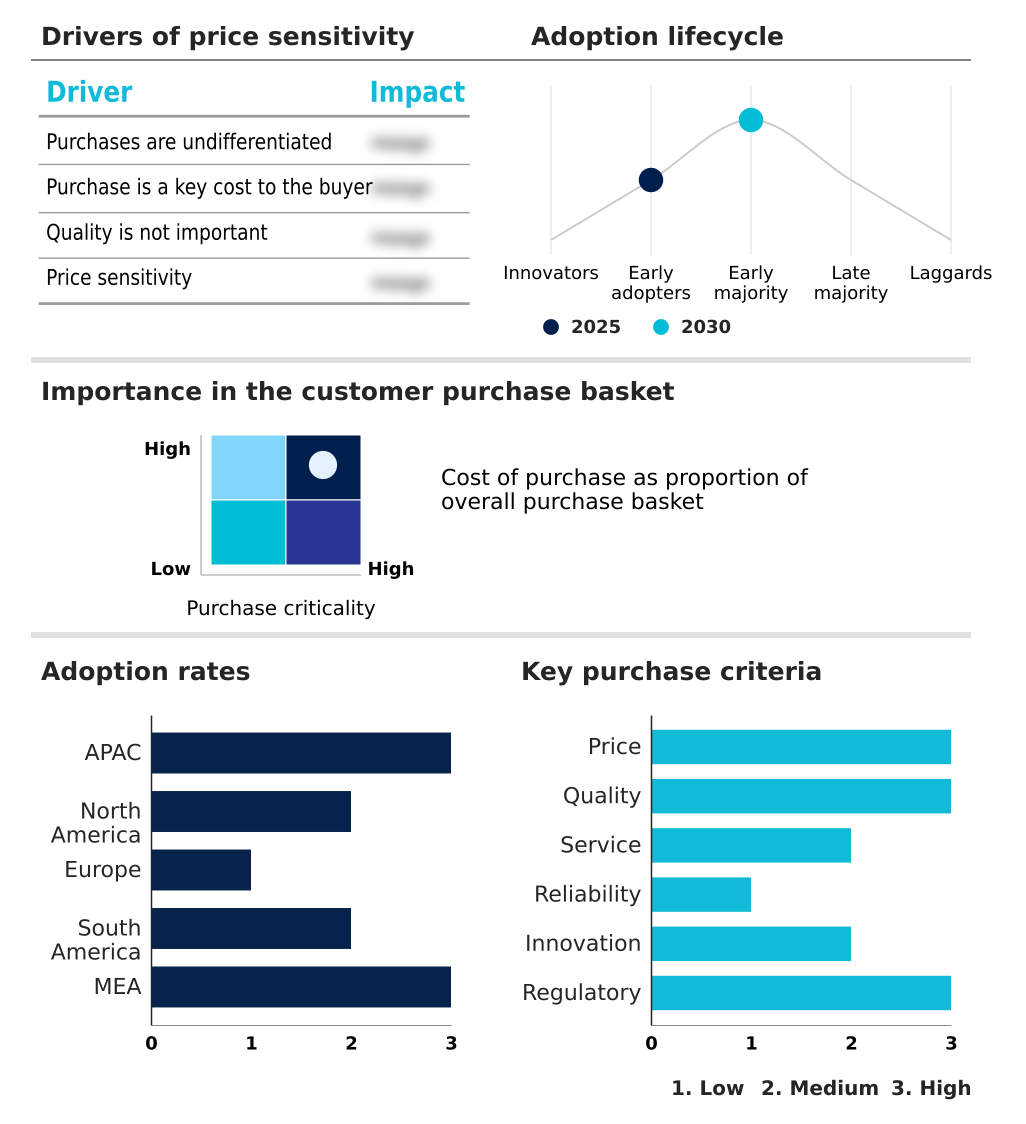
Customer Landscape of Semiconductor Dielectric Etching Equipment Industry

Competitive Landscape

Companies are implementing various strategies, such as strategic alliances, semiconductor dielectric etching equipment market forecast, partnerships, mergers and acquisitions, geographical expansion, and product/service launches, to enhance their presence in the industry.

Advanced Micro Fabrication Inc -

The industry research and growth report includes detailed analyses of the competitive landscape of the market and information about key companies, including:

  • Advanced Micro Fabrication Inc
  • AlixLabs AB
  • Applied Materials Inc.
  • Delphi Technologies Plc
  • EV Group
  • Giga Lane Co. Ltd.
  • Hitachi Ltd.
  • KLA Corp.
  • Lam Research Corp.
  • Mattson Technology Inc.
  • Oxford Instruments plc
  • Panasonic Holdings Corp.
  • Plasma Etch Inc
  • PLASMA THERM
  • Samco Inc
  • Shibaura Machine
  • Shinko Seiki Co. Ltd
  • Tokyo Electron Ltd.
  • Trion Technology Inc.
  • ULVAC Inc.

Qualitative and quantitative analysis of companies has been conducted to help clients understand the wider business environment as well as the strengths and weaknesses of key industry players. Data is qualitatively analyzed to categorize companies as pure play, category-focused, industry-focused, and diversified; it is quantitatively analyzed to categorize companies as dominant, leading, strong, tentative, and weak.

Recent Development and News in Semiconductor dielectric etching equipment market

Dive into Technavio’s robust research methodology, blending expert interviews, extensive data synthesis, and validated models for unparalleled Semiconductor Dielectric Etching Equipment Market insights. See full methodology.

Market Scope
Page number 286
Base year 2025
Historic period 2020-2024
Forecast period 2026-2030
Growth momentum & CAGR Accelerate at a CAGR of 9.7%
Market growth 2026-2030 USD 2089.6 million
Market structure Fragmented
YoY growth 2025-2026(%) 8.8%
Key countries China, Japan, India, South Korea, Australia, Indonesia, US, Canada, Mexico, Germany, UK, France, Italy, Spain, The Netherlands, Brazil, Argentina, Chile, Saudi Arabia, UAE, South Africa, Israel and Turkey
Competitive landscape Leading Companies, Market Positioning of Companies, Competitive Strategies, and Industry Risks

Request Free Sample

Research Analyst Overview

What are the Key Data Covered in this Semiconductor Dielectric Etching Equipment Market Research and Growth Report?

  • What is the expected growth of the Semiconductor Dielectric Etching Equipment Market between 2026 and 2030?

    • USD 2.09 billion, at a CAGR of 9.7%

  • What segmentation does the market report cover?

    • The report is segmented by Type (Dry etching systems, and Wet etching systems), Application (Front-end process, and Back-end process), End-user (Foundries, and Integrated device manufacturers) and Geography (APAC, North America, Europe, South America, Middle East and Africa)

  • Which regions are analyzed in the report?

    • APAC, North America, Europe, South America and Middle East and Africa

  • What are the key growth drivers and market challenges?

    • Rising demand for consumer electronics, High cost and maintenance requirements of semiconductor dielectric etching equipment

  • Who are the major players in the Semiconductor Dielectric Etching Equipment Market?

    • Advanced Micro Fabrication Inc, AlixLabs AB, Applied Materials Inc., Delphi Technologies Plc, EV Group, Giga Lane Co. Ltd., Hitachi Ltd., KLA Corp., Lam Research Corp., Mattson Technology Inc., Oxford Instruments plc, Panasonic Holdings Corp., Plasma Etch Inc, PLASMA THERM, Samco Inc, Shibaura Machine, Shinko Seiki Co. Ltd, Tokyo Electron Ltd., Trion Technology Inc. and ULVAC Inc.

Market Research Insights

We can help! Our analysts can customize this semiconductor dielectric etching equipment market research report to meet your requirements.

Get in touch

1. Executive Summary

1.1 Market overview

Executive Summary - Chart on Market Overview
Executive Summary - Data Table on Market Overview
Executive Summary - Chart on Global Market Characteristics
Executive Summary - Chart on Market by Geography
Executive Summary - Chart on Market Segmentation by Type
Executive Summary - Chart on Market Segmentation by Application
Executive Summary - Chart on Market Segmentation by End-user
Executive Summary - Chart on Incremental Growth
Executive Summary - Data Table on Incremental Growth
Executive Summary - Chart on Company Market Positioning

2. Technavio Analysis

2.1 Analysis of price sensitivity, lifecycle, customer purchase basket, adoption rates, and purchase criteria

2.2 Criticality of inputs and Factors of differentiation

Chart on Overview on criticality of inputs and factors of differentiation

2.3 Factors of disruption

Chart on Overview on factors of disruption

2.4 Impact of drivers and challenges

Chart on Impact of drivers and challenges in 2025 and 2030

3. Market Landscape

3.1 Market ecosystem

Chart on Parent Market
Data Table on - Parent Market

3.2 Market characteristics

Chart on Market characteristics analysis

3.3 Value chain analysis

Chart on Value chain analysis

4. Market Sizing

4.1 Market definition

Data Table on Offerings of companies included in the market definition

4.2 Market segment analysis

Market segments

4.3 Market size 2025

4.4 Market outlook: Forecast for 2025-2030

Chart on Global - Market size and forecast 2025-2030 ($ million)
Data Table on Global - Market size and forecast 2025-2030 ($ million)
Chart on Global Market: Year-over-year growth 2025-2030 (%)
Data Table on Global Market: Year-over-year growth 2025-2030 (%)

5. Historic Market Size

5.1 Global Semiconductor Dielectric Etching Equipment Market 2020 - 2024

Historic Market Size - Data Table on Global Semiconductor Dielectric Etching Equipment Market 2020 - 2024 ($ million)

5.2 Type segment analysis 2020 - 2024

Historic Market Size - Type Segment 2020 - 2024 ($ million)

5.3 Application segment analysis 2020 - 2024

Historic Market Size - Application Segment 2020 - 2024 ($ million)

5.4 End-user segment analysis 2020 - 2024

Historic Market Size - End-user Segment 2020 - 2024 ($ million)

5.5 Geography segment analysis 2020 - 2024

Historic Market Size - Geography Segment 2020 - 2024 ($ million)

5.6 Country segment analysis 2020 - 2024

Historic Market Size - Country Segment 2020 - 2024 ($ million)

6. Qualitative Analysis

6.1 AI impact on the Global Semiconductor Dielectric Etching Equipment Market

7. Five Forces Analysis

7.1 Five forces summary

Five forces analysis - Comparison between 2025 and 2030

7.2 Bargaining power of buyers

Bargaining power of buyers - Impact of key factors 2025 and 2030

7.3 Bargaining power of suppliers

Bargaining power of suppliers - Impact of key factors in 2025 and 2030

7.4 Threat of new entrants

Threat of new entrants - Impact of key factors in 2025 and 2030

7.5 Threat of substitutes

Threat of substitutes - Impact of key factors in 2025 and 2030

7.6 Threat of rivalry

Threat of rivalry - Impact of key factors in 2025 and 2030

7.7 Market condition

Chart on Market condition - Five forces 2025 and 2030

8. Market Segmentation by Type

8.1 Market segments

Chart on Type - Market share 2025-2030 (%)
Data Table on Type - Market share 2025-2030 (%)

8.2 Comparison by Type

Chart on Comparison by Type
Data Table on Comparison by Type

8.3 Dry etching systems - Market size and forecast 2025-2030

Chart on Dry etching systems - Market size and forecast 2025-2030 ($ million)
Data Table on Dry etching systems - Market size and forecast 2025-2030 ($ million)
Chart on Dry etching systems - Year-over-year growth 2025-2030 (%)
Data Table on Dry etching systems - Year-over-year growth 2025-2030 (%)

8.4 Wet etching systems - Market size and forecast 2025-2030

Chart on Wet etching systems - Market size and forecast 2025-2030 ($ million)
Data Table on Wet etching systems - Market size and forecast 2025-2030 ($ million)
Chart on Wet etching systems - Year-over-year growth 2025-2030 (%)
Data Table on Wet etching systems - Year-over-year growth 2025-2030 (%)

8.5 Market opportunity by Type

Market opportunity by Type ($ million)
Data Table on Market opportunity by Type ($ million)

9. Market Segmentation by Application

9.1 Market segments

Chart on Application - Market share 2025-2030 (%)
Data Table on Application - Market share 2025-2030 (%)

9.2 Comparison by Application

Chart on Comparison by Application
Data Table on Comparison by Application

9.3 Front-end process - Market size and forecast 2025-2030

Chart on Front-end process - Market size and forecast 2025-2030 ($ million)
Data Table on Front-end process - Market size and forecast 2025-2030 ($ million)
Chart on Front-end process - Year-over-year growth 2025-2030 (%)
Data Table on Front-end process - Year-over-year growth 2025-2030 (%)

9.4 Back-end process - Market size and forecast 2025-2030

Chart on Back-end process - Market size and forecast 2025-2030 ($ million)
Data Table on Back-end process - Market size and forecast 2025-2030 ($ million)
Chart on Back-end process - Year-over-year growth 2025-2030 (%)
Data Table on Back-end process - Year-over-year growth 2025-2030 (%)

9.5 Market opportunity by Application

Market opportunity by Application ($ million)
Data Table on Market opportunity by Application ($ million)

10. Market Segmentation by End-user

10.1 Market segments

Chart on End-user - Market share 2025-2030 (%)
Data Table on End-user - Market share 2025-2030 (%)

10.2 Comparison by End-user

Chart on Comparison by End-user
Data Table on Comparison by End-user

10.3 Foundries - Market size and forecast 2025-2030

Chart on Foundries - Market size and forecast 2025-2030 ($ million)
Data Table on Foundries - Market size and forecast 2025-2030 ($ million)
Chart on Foundries - Year-over-year growth 2025-2030 (%)
Data Table on Foundries - Year-over-year growth 2025-2030 (%)

10.4 Integrated device manufacturers - Market size and forecast 2025-2030

Chart on Integrated device manufacturers - Market size and forecast 2025-2030 ($ million)
Data Table on Integrated device manufacturers - Market size and forecast 2025-2030 ($ million)
Chart on Integrated device manufacturers - Year-over-year growth 2025-2030 (%)
Data Table on Integrated device manufacturers - Year-over-year growth 2025-2030 (%)

10.5 Market opportunity by End-user

Market opportunity by End-user ($ million)
Data Table on Market opportunity by End-user ($ million)

11. Customer Landscape

11.1 Customer landscape overview

Analysis of price sensitivity, lifecycle, customer purchase basket, adoption rates, and purchase criteria

12. Geographic Landscape

12.1 Geographic segmentation

Chart on Market share by geography 2025-2030 (%)
Data Table on Market share by geography 2025-2030 (%)

12.2 Geographic comparison

Chart on Geographic comparison
Data Table on Geographic comparison

12.3 APAC - Market size and forecast 2025-2030

Chart on APAC - Market size and forecast 2025-2030 ($ million)
Data Table on APAC - Market size and forecast 2025-2030 ($ million)
Chart on APAC - Year-over-year growth 2025-2030 (%)
Data Table on APAC - Year-over-year growth 2025-2030 (%)
Chart on Regional Comparison - APAC
Data Table on Regional Comparison - APAC

12.3.1 China - Market size and forecast 2025-2030

Chart on China - Market size and forecast 2025-2030 ($ million)
Data Table on China - Market size and forecast 2025-2030 ($ million)
Chart on China - Year-over-year growth 2025-2030 (%)
Data Table on China - Year-over-year growth 2025-2030 (%)

12.3.2 Japan - Market size and forecast 2025-2030

Chart on Japan - Market size and forecast 2025-2030 ($ million)
Data Table on Japan - Market size and forecast 2025-2030 ($ million)
Chart on Japan - Year-over-year growth 2025-2030 (%)
Data Table on Japan - Year-over-year growth 2025-2030 (%)

12.3.3 India - Market size and forecast 2025-2030

Chart on India - Market size and forecast 2025-2030 ($ million)
Data Table on India - Market size and forecast 2025-2030 ($ million)
Chart on India - Year-over-year growth 2025-2030 (%)
Data Table on India - Year-over-year growth 2025-2030 (%)

12.3.4 South Korea - Market size and forecast 2025-2030

Chart on South Korea - Market size and forecast 2025-2030 ($ million)
Data Table on South Korea - Market size and forecast 2025-2030 ($ million)
Chart on South Korea - Year-over-year growth 2025-2030 (%)
Data Table on South Korea - Year-over-year growth 2025-2030 (%)

12.3.5 Australia - Market size and forecast 2025-2030

Chart on Australia - Market size and forecast 2025-2030 ($ million)
Data Table on Australia - Market size and forecast 2025-2030 ($ million)
Chart on Australia - Year-over-year growth 2025-2030 (%)
Data Table on Australia - Year-over-year growth 2025-2030 (%)

12.3.6 Indonesia - Market size and forecast 2025-2030

Chart on Indonesia - Market size and forecast 2025-2030 ($ million)
Data Table on Indonesia - Market size and forecast 2025-2030 ($ million)
Chart on Indonesia - Year-over-year growth 2025-2030 (%)
Data Table on Indonesia - Year-over-year growth 2025-2030 (%)

12.4 North America - Market size and forecast 2025-2030

Chart on North America - Market size and forecast 2025-2030 ($ million)
Data Table on North America - Market size and forecast 2025-2030 ($ million)
Chart on North America - Year-over-year growth 2025-2030 (%)
Data Table on North America - Year-over-year growth 2025-2030 (%)
Chart on Regional Comparison - North America
Data Table on Regional Comparison - North America

12.4.1 US - Market size and forecast 2025-2030

Chart on US - Market size and forecast 2025-2030 ($ million)
Data Table on US - Market size and forecast 2025-2030 ($ million)
Chart on US - Year-over-year growth 2025-2030 (%)
Data Table on US - Year-over-year growth 2025-2030 (%)

12.4.2 Canada - Market size and forecast 2025-2030

Chart on Canada - Market size and forecast 2025-2030 ($ million)
Data Table on Canada - Market size and forecast 2025-2030 ($ million)
Chart on Canada - Year-over-year growth 2025-2030 (%)
Data Table on Canada - Year-over-year growth 2025-2030 (%)

12.4.3 Mexico - Market size and forecast 2025-2030

Chart on Mexico - Market size and forecast 2025-2030 ($ million)
Data Table on Mexico - Market size and forecast 2025-2030 ($ million)
Chart on Mexico - Year-over-year growth 2025-2030 (%)
Data Table on Mexico - Year-over-year growth 2025-2030 (%)

12.5 Europe - Market size and forecast 2025-2030

Chart on Europe - Market size and forecast 2025-2030 ($ million)
Data Table on Europe - Market size and forecast 2025-2030 ($ million)
Chart on Europe - Year-over-year growth 2025-2030 (%)
Data Table on Europe - Year-over-year growth 2025-2030 (%)
Chart on Regional Comparison - Europe
Data Table on Regional Comparison - Europe

12.5.1 Germany - Market size and forecast 2025-2030

Chart on Germany - Market size and forecast 2025-2030 ($ million)
Data Table on Germany - Market size and forecast 2025-2030 ($ million)
Chart on Germany - Year-over-year growth 2025-2030 (%)
Data Table on Germany - Year-over-year growth 2025-2030 (%)

12.5.2 UK - Market size and forecast 2025-2030

Chart on UK - Market size and forecast 2025-2030 ($ million)
Data Table on UK - Market size and forecast 2025-2030 ($ million)
Chart on UK - Year-over-year growth 2025-2030 (%)
Data Table on UK - Year-over-year growth 2025-2030 (%)

12.5.3 France - Market size and forecast 2025-2030

Chart on France - Market size and forecast 2025-2030 ($ million)
Data Table on France - Market size and forecast 2025-2030 ($ million)
Chart on France - Year-over-year growth 2025-2030 (%)
Data Table on France - Year-over-year growth 2025-2030 (%)

12.5.4 Italy - Market size and forecast 2025-2030

Chart on Italy - Market size and forecast 2025-2030 ($ million)
Data Table on Italy - Market size and forecast 2025-2030 ($ million)
Chart on Italy - Year-over-year growth 2025-2030 (%)
Data Table on Italy - Year-over-year growth 2025-2030 (%)

12.5.5 Spain - Market size and forecast 2025-2030

Chart on Spain - Market size and forecast 2025-2030 ($ million)
Data Table on Spain - Market size and forecast 2025-2030 ($ million)
Chart on Spain - Year-over-year growth 2025-2030 (%)
Data Table on Spain - Year-over-year growth 2025-2030 (%)

12.5.6 The Netherlands - Market size and forecast 2025-2030

Chart on The Netherlands - Market size and forecast 2025-2030 ($ million)
Data Table on The Netherlands - Market size and forecast 2025-2030 ($ million)
Chart on The Netherlands - Year-over-year growth 2025-2030 (%)
Data Table on The Netherlands - Year-over-year growth 2025-2030 (%)

12.6 South America - Market size and forecast 2025-2030

Chart on South America - Market size and forecast 2025-2030 ($ million)
Data Table on South America - Market size and forecast 2025-2030 ($ million)
Chart on South America - Year-over-year growth 2025-2030 (%)
Data Table on South America - Year-over-year growth 2025-2030 (%)
Chart on Regional Comparison - South America
Data Table on Regional Comparison - South America

12.6.1 Brazil - Market size and forecast 2025-2030

Chart on Brazil - Market size and forecast 2025-2030 ($ million)
Data Table on Brazil - Market size and forecast 2025-2030 ($ million)
Chart on Brazil - Year-over-year growth 2025-2030 (%)
Data Table on Brazil - Year-over-year growth 2025-2030 (%)

12.6.2 Argentina - Market size and forecast 2025-2030

Chart on Argentina - Market size and forecast 2025-2030 ($ million)
Data Table on Argentina - Market size and forecast 2025-2030 ($ million)
Chart on Argentina - Year-over-year growth 2025-2030 (%)
Data Table on Argentina - Year-over-year growth 2025-2030 (%)

12.6.3 Chile - Market size and forecast 2025-2030

Chart on Chile - Market size and forecast 2025-2030 ($ million)
Data Table on Chile - Market size and forecast 2025-2030 ($ million)
Chart on Chile - Year-over-year growth 2025-2030 (%)
Data Table on Chile - Year-over-year growth 2025-2030 (%)

12.7 Middle East and Africa - Market size and forecast 2025-2030

Chart on Middle East and Africa - Market size and forecast 2025-2030 ($ million)
Data Table on Middle East and Africa - Market size and forecast 2025-2030 ($ million)
Chart on Middle East and Africa - Year-over-year growth 2025-2030 (%)
Data Table on Middle East and Africa - Year-over-year growth 2025-2030 (%)
Chart on Regional Comparison - Middle East and Africa
Data Table on Regional Comparison - Middle East and Africa

12.7.1 Saudi Arabia - Market size and forecast 2025-2030

Chart on Saudi Arabia - Market size and forecast 2025-2030 ($ million)
Data Table on Saudi Arabia - Market size and forecast 2025-2030 ($ million)
Chart on Saudi Arabia - Year-over-year growth 2025-2030 (%)
Data Table on Saudi Arabia - Year-over-year growth 2025-2030 (%)

12.7.2 UAE - Market size and forecast 2025-2030

Chart on UAE - Market size and forecast 2025-2030 ($ million)
Data Table on UAE - Market size and forecast 2025-2030 ($ million)
Chart on UAE - Year-over-year growth 2025-2030 (%)
Data Table on UAE - Year-over-year growth 2025-2030 (%)

12.7.3 South Africa - Market size and forecast 2025-2030

Chart on South Africa - Market size and forecast 2025-2030 ($ million)
Data Table on South Africa - Market size and forecast 2025-2030 ($ million)
Chart on South Africa - Year-over-year growth 2025-2030 (%)
Data Table on South Africa - Year-over-year growth 2025-2030 (%)

12.7.4 Israel - Market size and forecast 2025-2030

Chart on Israel - Market size and forecast 2025-2030 ($ million)
Data Table on Israel - Market size and forecast 2025-2030 ($ million)
Chart on Israel - Year-over-year growth 2025-2030 (%)
Data Table on Israel - Year-over-year growth 2025-2030 (%)

12.7.5 Turkey - Market size and forecast 2025-2030

Chart on Turkey - Market size and forecast 2025-2030 ($ million)
Data Table on Turkey - Market size and forecast 2025-2030 ($ million)
Chart on Turkey - Year-over-year growth 2025-2030 (%)
Data Table on Turkey - Year-over-year growth 2025-2030 (%)

12.8 Market opportunity by geography

Market opportunity by geography ($ million)
Data Tables on Market opportunity by geography ($ million)

13. Drivers, Challenges, and Opportunity

13.1 Market drivers

Rising demand for consumer electronics
Increasing adoption of ALE technology
Increased demand for etching in advanced packaging

13.2 Market challenges

High cost and maintenance requirements of semiconductor dielectric etching equipment
Complexity of advanced node manufacturing
Adverse macroeconomic and regulatory market conditions

13.3 Impact of drivers and challenges

Impact of drivers and challenges in 2025 and 2030

13.4 Market opportunities

Integration of AI and ML into semiconductor dielectric etching equipment
Rising focus on 3D NAND and FinFET architectures
Growing adoption of autonomous vehicles

14. Competitive Landscape

14.1 Overview

14.2

Overview on criticality of inputs and factors of differentiation

14.3 Landscape disruption

Overview on factors of disruption

14.4 Industry risks

Impact of key risks on business

15. Competitive Analysis

15.1 Companies profiled

Companies covered

15.2 Company ranking index

15.3 Market positioning of companies

Matrix on companies position and classification

15.4 AlixLabs AB

AlixLabs AB - Overview
AlixLabs AB - Product / Service
AlixLabs AB - Key offerings
SWOT

15.5 Applied Materials Inc.

Applied Materials Inc. - Overview
Applied Materials Inc. - Business segments
Applied Materials Inc. - Key offerings
Applied Materials Inc. - Segment focus
SWOT

15.6 EV Group

EV Group - Overview
EV Group - Product / Service
EV Group - Key offerings
SWOT

15.7 Giga Lane Co. Ltd.

Giga Lane Co. Ltd. - Overview
Giga Lane Co. Ltd. - Product / Service
Giga Lane Co. Ltd. - Key offerings
SWOT

15.8 Hitachi Ltd.

Hitachi Ltd. - Overview
Hitachi Ltd. - Business segments
Hitachi Ltd. - Key news
Hitachi Ltd. - Key offerings
Hitachi Ltd. - Segment focus
SWOT

15.9 KLA Corp.

KLA Corp. - Overview
KLA Corp. - Business segments
KLA Corp. - Key offerings
KLA Corp. - Segment focus
SWOT

15.10 Lam Research Corp.

Lam Research Corp. - Overview
Lam Research Corp. - Product / Service
Lam Research Corp. - Key offerings
SWOT

15.11 Mattson Technology Inc.

Mattson Technology Inc. - Overview
Mattson Technology Inc. - Product / Service
Mattson Technology Inc. - Key offerings
SWOT

15.12 Oxford Instruments plc

Oxford Instruments plc - Overview
Oxford Instruments plc - Business segments
Oxford Instruments plc - Key offerings
Oxford Instruments plc - Segment focus
SWOT

15.13 Panasonic Holdings Corp.

Panasonic Holdings Corp. - Overview
Panasonic Holdings Corp. - Business segments
Panasonic Holdings Corp. - Key news
Panasonic Holdings Corp. - Key offerings
Panasonic Holdings Corp. - Segment focus
SWOT

15.14 PLASMA THERM

PLASMA THERM - Overview
PLASMA THERM - Product / Service
PLASMA THERM - Key offerings
SWOT

15.15 Samco Inc

Samco Inc - Overview
Samco Inc - Product / Service
Samco Inc - Key offerings
SWOT

15.16 Shibaura Machine

Shibaura Machine - Overview
Shibaura Machine - Product / Service
Shibaura Machine - Key offerings
SWOT

15.17 Tokyo Electron Ltd.

Tokyo Electron Ltd. - Overview
Tokyo Electron Ltd. - Business segments
Tokyo Electron Ltd. - Key offerings
Tokyo Electron Ltd. - Segment focus
SWOT

15.18 Trion Technology Inc.

Trion Technology Inc. - Overview
Trion Technology Inc. - Product / Service
Trion Technology Inc. - Key offerings
SWOT

16. Appendix

16.1 Scope of the report

Market definition
Objectives
Notes and caveats

16.2 Inclusions and exclusions checklist

Inclusions checklist
Exclusions checklist

16.3 Currency conversion rates for US$

16.4 Research methodology

16.5 Data procurement

Information sources

16.6 Data validation

16.7 Validation techniques employed for market sizing

16.8 Data synthesis

16.9 360 degree market analysis

16.10 List of abbreviations

Research Methodology

Technavio presents a detailed picture of the market by way of study, synthesis, and summation of data from multiple sources. The analysts have presented the various facets of the market with a particular focus on identifying the key industry influencers. The data thus presented is comprehensive, reliable, and the result of extensive research, both primary and secondary.

INFORMATION SOURCES

Primary sources

  • Manufacturers and suppliers
  • Channel partners
  • Industry experts
  • Strategic decision makers

Secondary sources

  • Industry journals and periodicals
  • Government data
  • Financial reports of key industry players
  • Historical data
  • Press releases

DATA ANALYSIS

Data Synthesis

  • Collation of data
  • Estimation of key figures
  • Analysis of derived insights

Data Validation

  • Triangulation with data models
  • Reference against proprietary databases
  • Corroboration with industry experts

REPORT WRITING

Qualitative

  • Market drivers
  • Market challenges
  • Market trends
  • Five forces analysis

Quantitative

  • Market size and forecast
  • Market segmentation
  • Geographical insights
  • Competitive landscape

Interested in this report?

Get your sample now to see our research methodology and insights!

Download Now

Frequently Asked Questions

Semiconductor Dielectric Etching Equipment market growth will increase by USD 2089.6 million during 2026-2030.

The Semiconductor Dielectric Etching Equipment market is expected to grow at a CAGR of 9.7% during 2026-2030.

Semiconductor Dielectric Etching Equipment market is segmented by Type (Dry etching systems, Wet etching systems) Application (Front-end process, Back-end process) End-user (Foundries, Integrated device manufacturers)

Advanced Micro Fabrication Inc, AlixLabs AB, Applied Materials Inc., Delphi Technologies Plc, EV Group, Giga Lane Co. Ltd., Hitachi Ltd., KLA Corp., Lam Research Corp., Mattson Technology Inc., Oxford Instruments plc, Panasonic Holdings Corp., Plasma Etch Inc, PLASMA THERM, Samco Inc, Shibaura Machine, Shinko Seiki Co. Ltd, Tokyo Electron Ltd., Trion Technology Inc., ULVAC Inc. are a few of the key vendors in the Semiconductor Dielectric Etching Equipment market.

APAC will register the highest growth rate of 61.9% among the other regions. Therefore, the Semiconductor Dielectric Etching Equipment market in APAC is expected to garner significant business opportunities for the vendors during the forecast period.

China, Japan, India, South Korea, Australia, Indonesia, US, Canada, Mexico, Germany, UK, France, Italy, Spain, The Netherlands, Brazil, Argentina, Chile, Saudi Arabia, UAE, South Africa, Israel, Turkey

  • Rising demand for consumer electronics is the driving factor this market.

The Semiconductor Dielectric Etching Equipment market vendors should focus on grabbing business opportunities from the Type segment as it accounted for the largest market share in the base year.