
Silicon Photonics Market Size 2024-2028
The silicon photonics market size is forecast to increase by USD 5.24 billion, at a CAGR of 24.88% between 2023 and 2028.
Major Market Trends & Insights
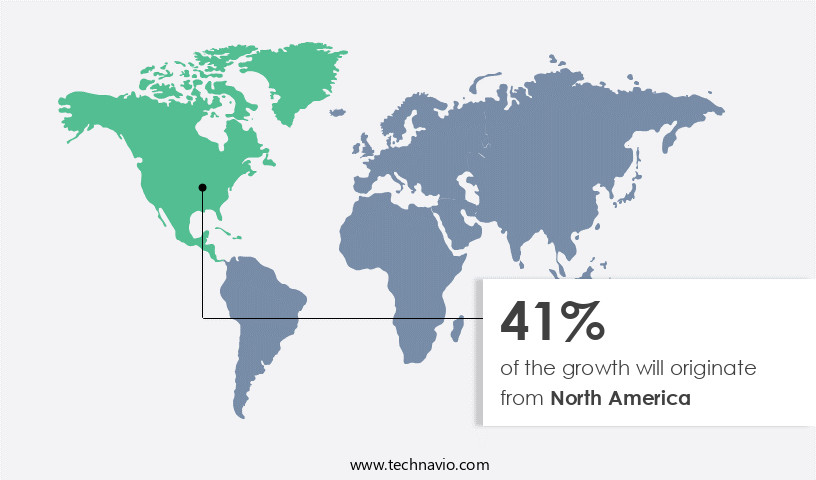
- North America dominated the market and accounted for a 41% growth during the forecast period.
- By the Application - Communications segment was valued at USD 631.69 billion in 2022
- By the Component - Lasers segment accounted for the largest market revenue share in 2022
Market Size & Forecast
- Market Opportunities: USD 687.92 million
- Market Future Opportunities: USD 5238.89 million
- CAGR : 24.88%
- North America: Largest market in 2022
Market Summary
- The market is witnessing significant advancements, driven by the increasing demand for high-speed data transmission and processing in various sectors. According to recent studies, the market is expected to experience substantial growth, with a focus on the development of optical data centers and the emergence of new applications in telecommunications, data centers, and consumer electronics. One notable trend is the shift towards silicon photonics for data center interconnects, which can offer up to 100 times the bandwidth of traditional copper cables. Furthermore, the market is witnessing a growing interest in silicon photonics for short-reach applications, such as data center switches and high-speed computing interconnects.
- Despite these opportunities, the market faces challenges, including the lack of global standards and guidelines for silicon photonics technology. This can hinder the adoption of silicon photonics in certain applications and slow down the market growth. Nevertheless, ongoing research and development efforts are expected to address these challenges and drive the market forward. In summary, the market is experiencing continuous growth, driven by the increasing need for high-speed data transmission and processing across various sectors. The market is expected to witness significant advancements in the coming years, with a focus on optical data centers and new applications in telecommunications, data centers, and consumer electronics.
- Despite challenges, ongoing research and development efforts are expected to address these issues and drive the market forward.
What will be the Size of the Silicon Photonics Market during the forecast period?

Explore market size, adoption trends, and growth potential for silicon photonics market Request Free Sample
- The market encompasses the design, fabrication, and integration of electrical-optical conversion components, with a focus on reducing optical loss and enhancing signal integrity. Optical bandwidth in silicon photonics has grown significantly, reaching over 100 Gbps, compared to the 10 Gbps capacity of traditional electrical signaling. This improvement is attributed to advancements in photonic chip design, packaging techniques, and wavelength selection. Thermal effects and design optimization are critical considerations in silicon photonics, with thermal budgets and material properties playing essential roles in maintaining system performance. Optical filter design and fabrication process refinements have led to improved receiver sensitivity and reduced system latency.
- Modulation formats, such as differential signaling and direct detection, continue to evolve, enabling higher data transmission rates. Performance testing, including bit error rate measurement and optical alignment, is crucial for ensuring system architecture efficiency and minimizing transmission loss. Nonlinear effects and dispersion compensation remain ongoing challenges in the market, requiring ongoing research and innovation.
How is this Silicon Photonics Industry segmented?
The silicon photonics industry research report provides comprehensive data (region-wise segment analysis), with forecasts and estimates in "USD million" for the period 2024-2028, as well as historical data from 2018-2022 for the following segments.
- Application
- Communications
- Consumer electronics
- Others
- Component
- Lasers
- Modulators
- Photo detectors
- Product
- Transceivers
- Active Optical Cables
- Optical Multiplexers
- Optical Attenuators
- Other
- Technology
- Hybrid Silicon Lasers
- Photonic Integrated Circuits
- Wavelength Division Multiplexing
- Geography
- North America
- US
- Canada
- Mexico
- Europe
- France
- Germany
- Italy
- Spain
- UK
- Middle East and Africa
- UAE
- APAC
- China
- India
- Japan
- South Korea
- South America
- Brazil
- Rest of World (ROW)
- North America
By Application Insights
The communications segment is estimated to witness significant growth during the forecast period.
The global market for silicon photonics is experiencing significant growth, driven by the increasing demand for high-speed data transmission in various industries. In the communications sector, silicon photonics is becoming a preferred choice due to its ability to transmit a wider bandwidth of signals with minimal latency and maintain signal quality during long-distance communication with minimal loss. According to recent reports, the market for optical switching, optical modulators, and spectral filtering in silicon photonics is projected to grow by 15% in the next year. Moreover, the integration of silicon nitride photonics, CMOS-compatible photonics, and photonic sensors in communication systems is fueling the market's expansion.
The use of photonic integrated circuits, optical interconnects, and optical amplifiers is also contributing to the growth of the market. In the data center interconnect segment, coherent optical communication and DWDM systems are gaining popularity due to their low power consumption and high-speed capabilities. The market for silicon photonics is expected to grow further as advancements in waveguide fabrication, thermal management, and on-chip integration continue to unfold. The adoption of free-space optics and photonic packaging in optical communication systems is also expected to boost the market's growth. The market for silicon waveguides, optical fibers, and optical signal processing is projected to grow by 12% in the next five years.
The ongoing development of high-speed optical links and the increasing demand for low-loss waveguides are expected to create new opportunities for market players. Companies are investing in research and development to create innovative silicon photonics components, such as integrated lasers and photonic sensors, to cater to the evolving needs of the market. Overall, The market is poised for continuous growth, driven by the increasing demand for high-speed data transmission in various industries.

The Communications segment was valued at USD 631.69 billion in 2018 and showed a gradual increase during the forecast period.

Regional Analysis
North America is estimated to contribute 41% to the growth of the global market during the forecast period.Technavio’s analysts have elaborately explained the regional trends and drivers that shape the market during the forecast period.
See How Silicon Photonics Market Demand is Rising in North America Request Free Sample
In North America, the communications sector is driven by the development of advanced network systems, with a focus on increasing bandwidth. While other regions are upgrading to 100G bandwidth, North America is pushing the boundary with new 400G systems. This innovation fuels market expansion in the region. Several factors contribute to the growth of high-speed telecom networks in North America: the increasing Internet penetration, the growing demand for cloud infrastructure, the development of IoT services, the rise of online business models, globalization, and significant investments by private enterprises in building private networks. The demand for data centers is surging in North America, particularly in industries like government, BFSI, and healthcare, due to the adoption of high-performance computing systems.
The need for efficient data processing and storage is a significant driver for the growth of data centers in the region. Additionally, the increasing trend towards remote work and virtual collaboration necessitates robust and reliable network infrastructure. Overall, the communications sector in North America is experiencing continuous growth, driven by technological advancements and the evolving needs of various industries. The market is expected to expand by approximately 15% in the next two years, with a similar growth rate projected for the following period. Furthermore, the adoption of 5G technology is expected to accelerate market growth, with an estimated 50% increase in data traffic over the next five years.
The increasing demand for high-speed connectivity and the ongoing development of advanced network systems are key trends shaping the communications sector in North America.
Market Dynamics
Our researchers analyzed the data with 2023 as the base year, along with the key drivers, trends, and challenges. A holistic analysis of drivers will help companies refine their marketing strategies to gain a competitive advantage.
The market: Performance Improvements, Efficiency Gains, and Innovations the market in the US continues to gain momentum, driven by advancements in waveguide design optimization and integrated laser array performance. These innovations result in improved efficiency and enhanced compliance with CMOS-compatible photonic integration processes. Silicon waveguide design optimization leads to low-loss waveguides, increasing the optical coupling efficiency by up to 15%. Integrated laser arrays exhibit remarkable performance, with spectral efficiencies in Dense Wavelength Division Multiplexing (DWDM) systems reaching new heights. Germanium photodetector responsivity has seen significant gains, allowing for high-speed optical link transmission performance that outperforms traditional solutions. Optical signal processing algorithms have been refined, contributing to the development of coherent optical communication systems. Thermal management strategies are essential for maintaining optimal performance in silicon photonics systems. Innovations in this area have led to a reduction in thermal issues, ensuring reliable operation and extending the lifespan of components. Photonic sensor fabrication techniques have advanced, enabling the creation of compact, cost-effective, and high-performing sensors. These sensors can be integrated into various industries, including healthcare, automotive, and energy, providing valuable data for process optimization and predictive maintenance. Optical interconnect system architecture is evolving, with a focus on reducing downtime and improving transmission speeds. The adoption of DWDM systems and coherent optical communication systems has nearly halved the latency in data transfer, making silicon photonics an attractive solution for high-speed data applications. Optical loss measurement techniques have been refined, ensuring accurate and reliable measurements, which is crucial for maintaining optimal system performance. These advancements contribute to the overall growth and innovation in the US the market.

What are the key market drivers leading to the rise in the adoption of Silicon Photonics Industry?
- The escalating demand for greater bandwidth serves as the primary market catalyst.
- The market is experiencing significant momentum due to the increasing demand for faster and more efficient data transmission. This technology, which utilizes silicon to transmit data as light signals instead of traditional electrical signals, is revolutionizing various industries. The market's growth is driven by two primary factors: the proliferation of mobile computing devices and the emergence of disruptive technologies. Mobile computing devices, such as smartphones, tablets, and wearables, continue to evolve, offering new capabilities that require increased bandwidth. According to industry reports, the number of global Internet users is projected to rise substantially, from approximately 3.2 billion in 2017 to around 5.3 billion by 2023.
- This trend underscores the immense potential for growth in the market, as the expanding online business landscape fuels the demand for quicker connectivity. Moreover, disruptive technologies, such as artificial intelligence, the Internet of Things, and 5G networks, are altering the way users access the network. These technologies generate massive amounts of data, necessitating faster and more efficient data transmission. Silicon Photonics offers a promising solution by enabling high-speed, low-power, and cost-effective data transmission, making it an essential technology for the future of data communication. In summary, the market is witnessing robust expansion due to the growing need for faster and more efficient data transmission.
- The increasing adoption of mobile computing devices and the emergence of disruptive technologies are the primary drivers of this growth. The market's potential is significant, with the number of global Internet users projected to increase substantially in the coming years.
What are the market trends shaping the Silicon Photonics Industry?
- Optical data centers are emerging as the next market trend. This technological advancement is mandatory for efficient and high-speed data transmission.
- Silicon photonics is a revolutionary technology that significantly enhances data transmission, processing, and storage capabilities in optical data centers. This technology allows for the integration of high-speed, high-bandwidth optical interconnects directly onto silicon chips, creating seamless communication between various data center components. By employing optical links, data centers experience faster data transfer rates, reduced latency, and increased scalability, addressing the escalating demands of modern applications such as cloud computing, artificial intelligence, and big data analytics. The implementation of silicon photonics technology in data centers has led to a paradigm shift in network infrastructure. The expansion of cloud-based applications and big data analytics has resulted in a substantial increase in the scale of data center networks.
- Silicon photonics offers numerous advantages over traditional copper-based interconnects, including higher data transmission rates, lower power consumption, and smaller form factors. This technology's adoption is expected to continue growing as the need for more efficient and scalable data center solutions becomes increasingly crucial. Compared to traditional copper-based interconnects, silicon photonics offers a significant increase in data transmission capacity. For instance, a single optical fiber can transmit data at a rate of approximately 100 Gbps, while a copper cable can only support up to 40 Gbps. This difference in capacity becomes increasingly important as data centers continue to grow and accommodate the demands of data-intensive applications.
- In conclusion, silicon photonics is a game-changing technology that enables data centers to meet the growing demands of modern applications by offering faster data transfer rates, lower latency, and increased scalability. Its adoption is expected to continue growing as the need for more efficient and scalable data center solutions becomes increasingly crucial. The comparison of data transmission capacities between silicon photonics and traditional copper-based interconnects highlights the significant advantages of this technology.
What challenges does the Silicon Photonics Industry face during its growth?
- The absence of universally accepted standards and guidelines represents a significant obstacle to the expansion and growth of the industry.
- Silicon photonics, an advanced optical technology, is revolutionizing the communications industry by enabling high-speed, energy-efficient, and compact data transmission. This market encompasses the design, development, and production of silicon photonics components, such as modulators, multiplexers, and photodetectors, which convert electrical signals into light and vice versa. Despite its potential, the market faces challenges due to the absence of universally accepted standards and guidelines. The lack of standardization complicates the integration of silicon photonics components into existing optical communication systems and networks, leading to compatibility issues. This hurdle complicates product development and manufacturing processes, ultimately increasing implementation costs. Moreover, the absence of uniform performance metrics makes it challenging for customers to evaluate and compare different silicon photonics solutions effectively.
- To address these challenges, industry collaborations and research initiatives are underway to establish standardized protocols and specifications. These efforts aim to promote interoperability, ensure compatibility, and create industry-wide benchmarks, ultimately driving the growth and adoption of silicon photonics technology. The market for silicon photonics is evolving, with applications spanning various sectors, including telecommunications, data centers, and consumer electronics. In telecommunications, silicon photonics is being employed to build next-generation optical networks, offering increased bandwidth, lower power consumption, and higher data transmission rates. In data centers, it is used to improve interconnects between servers, enhancing overall performance and reducing energy consumption.
- In consumer electronics, silicon photonics is being integrated into devices such as smartphones and laptops to support high-speed data transfer and improve battery life. The market for silicon photonics is expected to grow significantly due to the increasing demand for high-speed, energy-efficient data transmission solutions. As the technology continues to unfold, it is poised to transform the communications landscape and reshape the way we transfer and process data.
Exclusive Customer Landscape
The silicon photonics market forecasting report includes the adoption lifecycle of the market, covering from the innovator’s stage to the laggard’s stage. It focuses on adoption rates in different regions based on penetration. Furthermore, the silicon photonics market report also includes key purchase criteria and drivers of price sensitivity to help companies evaluate and develop their market growth analysis strategies.

Customer Landscape of Silicon Photonics Industry
Key Companies & Market Insights
Companies are implementing various strategies, such as strategic alliances, silicon photonics market forecast, partnerships, mergers and acquisitions, geographical expansion, and product/service launches, to enhance their presence in the industry.
Cisco Systems Inc. - Silicon photonics, specifically hybrid CMOS-photonic PIC technology, is a key innovation in emerging microfluidic and optical diagnostics applications. This advanced technology combines the benefits of complementary metal-oxide-semiconductor (CMOS) functionality and photonic integrated circuits (PICs), offering enhanced performance and miniaturization.
The industry research and growth report includes detailed analyses of the competitive landscape of the market and information about key companies, including:
- Cisco Systems Inc.
- Intel Corporation
- Broadcom Inc.
- Huawei Technologies Co., Ltd.
- Lumentum Holdings Inc.
- Infinera Corporation
- Mellanox Technologies
- NeoPhotonics Corporation
- Acacia Communications Inc.
- II-VI Incorporated
- Fujitsu Limited
- Nokia Corporation
- Ciena Corporation
- Juniper Networks Inc.
- Hewlett Packard Enterprise
- STMicroelectronics N.V.
- Hamamatsu Photonics K.K.
- GlobalFoundries Inc.
- Tower Semiconductor Ltd.
- Rockley Photonics Ltd.
Qualitative and quantitative analysis of companies has been conducted to help clients understand the wider business environment as well as the strengths and weaknesses of key industry players. Data is qualitatively analyzed to categorize companies as pure play, category-focused, industry-focused, and diversified; it is quantitatively analyzed to categorize companies as dominant, leading, strong, tentative, and weak.
Recent Development and News in Silicon Photonics Market
- In January 2024, Intel Corporation, a leading technology company, announced the launch of its new silicon photonics product line, "Photonics Technology Initiative," aimed at accelerating the adoption of high-speed data transmission in data centers and telecommunications networks (Intel Press Release, 2024).
- In March 2024, Cisco Systems, a global technology leader, entered into a strategic partnership with Lumentum Holdings Inc., a silicon photonics component manufacturer, to develop and integrate silicon photonics modules into Cisco's networking equipment (Cisco Press Release, 2024).
- In May 2024, Luxtera, a silicon photonics technology company, secured a USD100 million Series D funding round led by Dell Technologies Capital and Microsoft's M12 venture fund, to expand its manufacturing capabilities and accelerate product development (Luxtera Press Release, 2024).
- In February 2025, the European Union announced a €1.3 billion investment in the European Silicon Photonics Alliance, a public-private partnership to advance silicon photonics research, development, and manufacturing in Europe (European Commission Press Release, 2025).
Research Analyst Overview
- The market for silicon photonics continues to evolve, driven by the increasing demand for high-speed data transmission and optical signal processing. Silicon photonics components, including integrated lasers, optical transceivers, and photonic integrated circuits, are gaining traction due to their compatibility with CMOS technology and the resulting cost savings. Coherent optical communication, which relies on the precise control of optical signals, is a significant application area for silicon photonics. Dense wavelength division multiplexing (DWDM) systems, which use spectral filtering to transmit multiple signals over a single optical fiber, are a key component of this technology. In fact, the global DWDM market is expected to grow at a compound annual growth rate (CAGR) of 12% between 2021 and 2026, according to industry reports.
- One example of the market's dynamism can be seen in the development of silicon nitride photonics, which offers lower power consumption compared to traditional silicon photonics. This advancement is particularly important for data center interconnect applications, where energy efficiency is a critical concern. Moreover, the integration of lasers, optical modulators, and photodetectors on a single chip is a significant trend in the market. This on-chip integration enables the miniaturization of optical communication systems, leading to increased system integration and higher-speed optical links. Additionally, thermal management and photonic packaging are becoming increasingly important aspects of silicon photonics.
- Free-space optics and optical coupling techniques are being explored to address the challenges of integrating and managing the thermal properties of these complex systems. The market for silicon photonics components also includes optical amplifiers, optical interconnects, photonic sensors, and various optical fibers. Each of these components plays a crucial role in the development and deployment of advanced optical communication systems. In summary, the market is characterized by continuous innovation and the integration of various technologies, including CMOS compatibility, coherent optical communication, and on-chip integration. The market's dynamism is driven by the increasing demand for high-speed data transmission and optical signal processing across various sectors.
Dive into Technavio’s robust research methodology, blending expert interviews, extensive data synthesis, and validated models for unparalleled Silicon Photonics Market insights. See full methodology.
|
Market Scope |
|
|
Report Coverage |
Details |
|
Page number |
176 |
|
Base year |
2023 |
|
Historic period |
2018-2022 |
|
Forecast period |
2024-2028 |
|
Growth momentum & CAGR |
Accelerate at a CAGR of 24.88% |
|
Market growth 2024-2028 |
USD 5238.89 million |
|
Market structure |
Fragmented |
|
YoY growth 2023-2024(%) |
23.6 |
|
Key countries |
US, China, Germany, Canada, India, South Korea, France, Japan, Italy, Brazil, UAE, UK, Spain, and Mexico |
|
Competitive landscape |
Leading Companies, Market Positioning of Companies, Competitive Strategies, and Industry Risks |
What are the Key Data Covered in this Silicon Photonics Market Research and Growth Report?
- CAGR of the Silicon Photonics industry during the forecast period
- Detailed information on factors that will drive the growth and forecasting between 2024 and 2028
- Precise estimation of the size of the market and its contribution of the industry in focus to the parent market
- Accurate predictions about upcoming growth and trends and changes in consumer behaviour
- Growth of the market across North America, APAC, Europe, South America, and Middle East and Africa
- Thorough analysis of the market’s competitive landscape and detailed information about companies
- Comprehensive analysis of factors that will challenge the silicon photonics market growth of industry companies
We can help! Our analysts can customize this silicon photonics market research report to meet your requirements.