
Middle East and Africa Steel Building Market Size 2025-2029
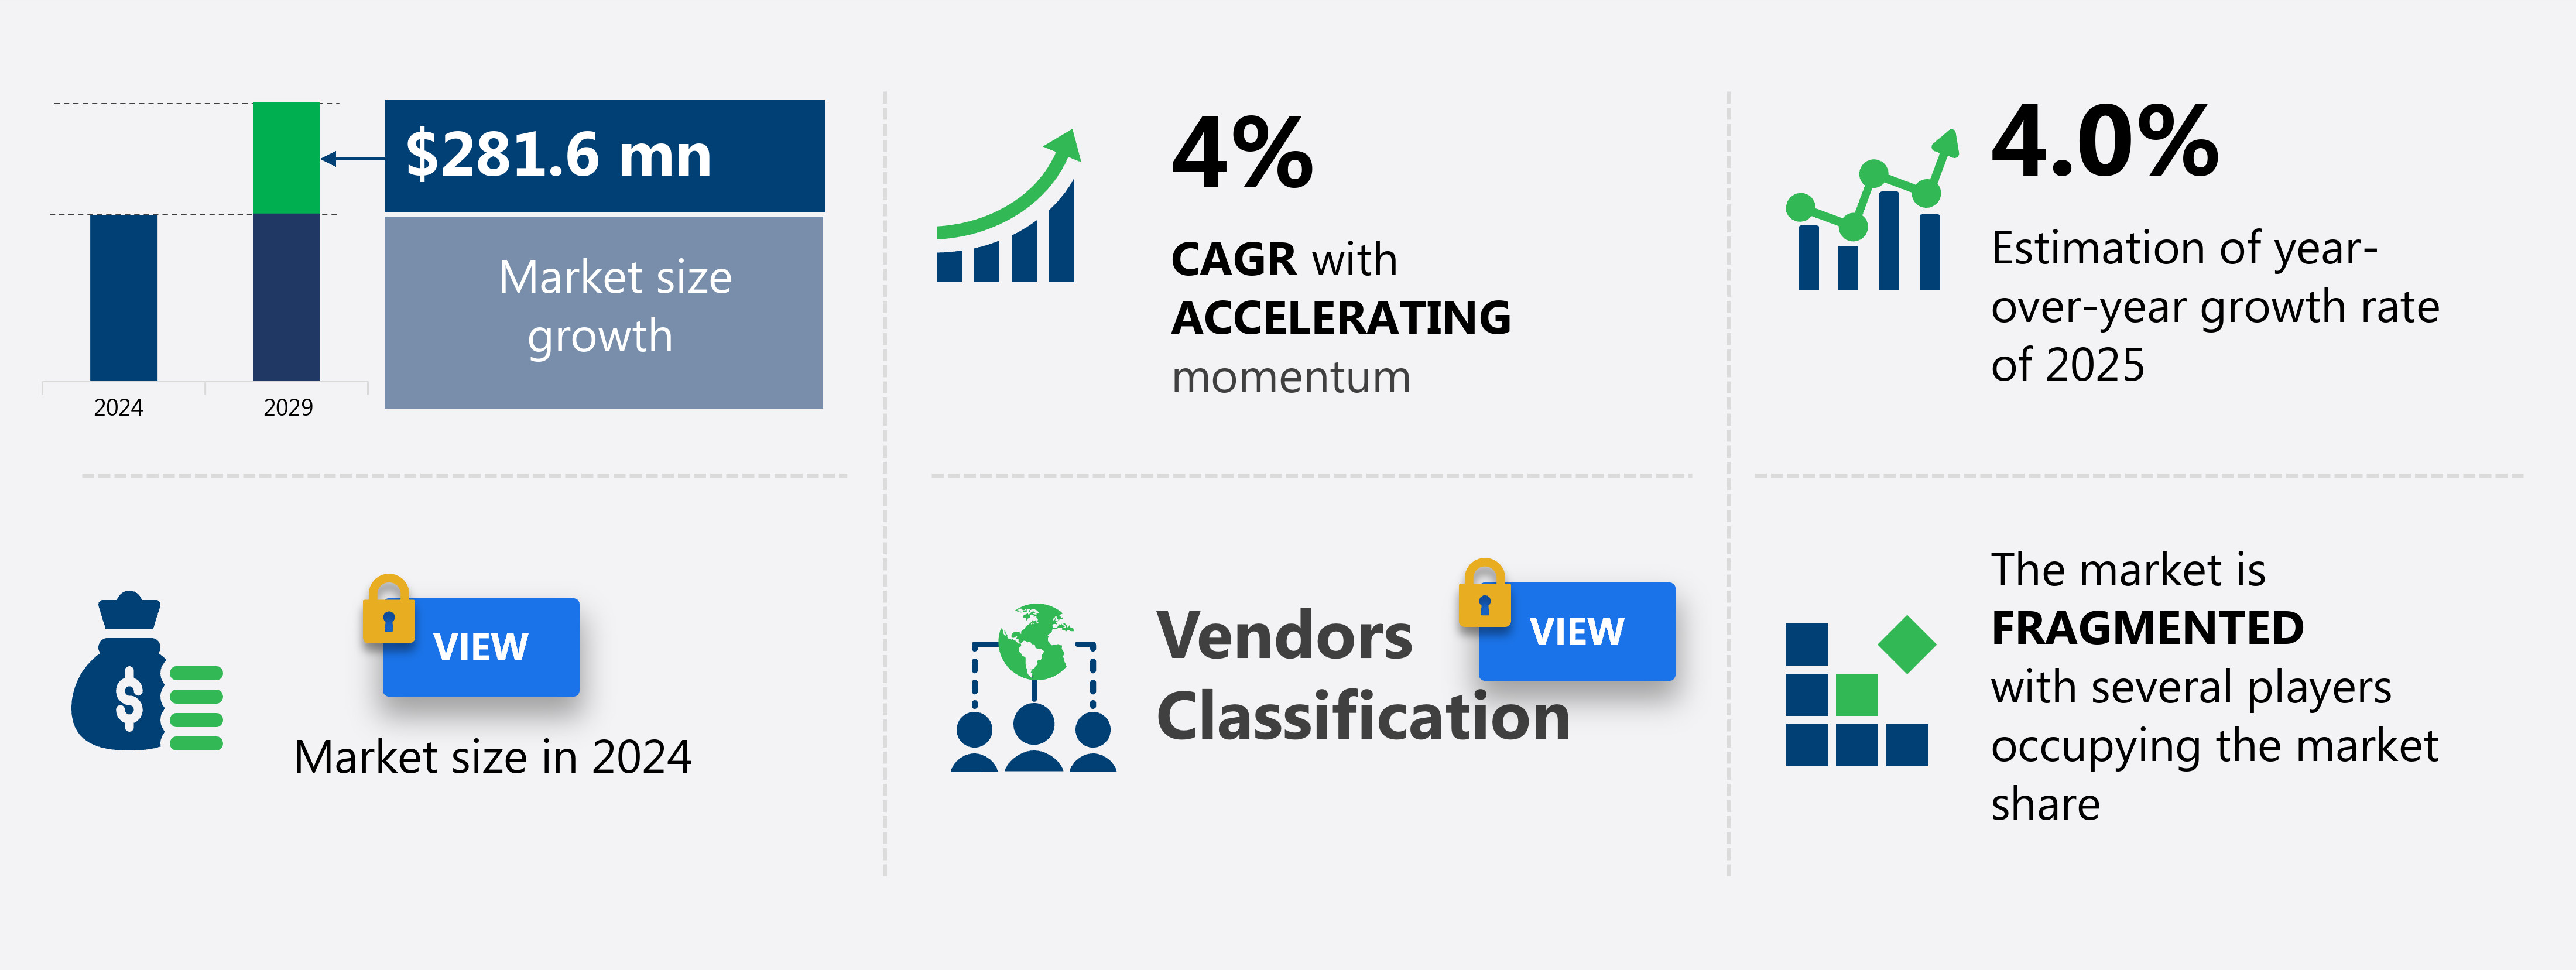
The Middle East and Africa steel building market size is forecast to increase by USD 281.6 million at a CAGR of 4% between 2024 and 2029.
- The steel building market is experiencing significant growth due to several key factors. One major trend is the increasing adoption of pre-engineered buildings (PEBs) over traditional construction methods. PEBs offer numerous advantages, including faster construction times, cost savings, and greater structural integrity. PEBs' flexibility and strength make them a wise investment for various industries, including logistics, production halls, and shipyards, as well as residential and commercial buildings, seeking contemporary designs. Another growth factor is the expansion of the construction and infrastructure sectors, which are driving demand for durable and efficient building solutions. However, there are challenges facing the market as well. Limited design flexibility In the residential sector and low awareness among builders about the benefits of PEBs are hindering market growth. Despite these challenges, the future looks bright for the steel building market, with continued innovation and advancements in technology expected to drive growth.
What will be the Size of the market During the Forecast Period?
- The steel building market encompasses a diverse range of applications, including versatile construction for industrial warehouses, secure storage solutions, and protection from elements for agricultural buildings. This sector caters to various industries, offering customizable structures for commercial retail spaces, office buildings, multi-story complexes, workshops, and even aircraft hangars. Steel buildings provide flexibility and strength, making them an ideal choice for residential garages, carports, churches, religious institutions, barns, and even large-scale projects like sports facilities, indoor practice areas, schools, and customizable designs. Metal building construction continues to gain popularity due to its durability, low-maintenance characteristics, and ability to withstand extreme weather conditions.
- The market's size and direction reflect a growing demand for secure, safe environments that can accommodate various industries and applications. Steel buildings offer a cost-effective, efficient solution for businesses and individuals seeking protection and customizable structures for their specific needs. Overall, the steel building market remains a dynamic and strongindustry, providing innovative solutions for a wide range of applications.
How is this market segmented and which is the largest segment?
The market research report provides comprehensive data (region-wise segment analysis), with forecasts and estimates in "USD million" for the period 2025-2029, as well as historical data from 2019-2023 for the following segments.
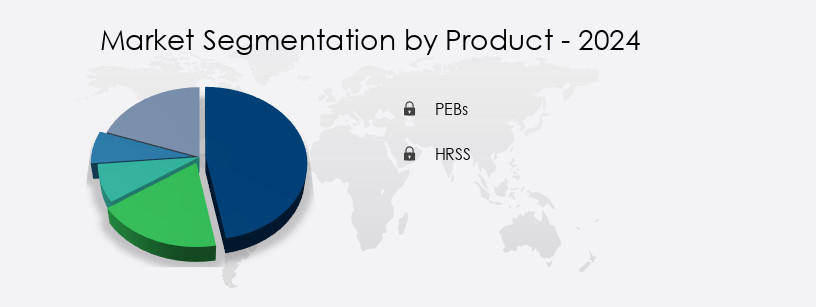
- Product
- PEBs
- HRSS
- Application
- Industrial
- Commercial
- Residential
- End-user
- Construction and infrastructure
- Energy and power
- Transportation and logistics
- Defense and aerospace
- Geography
- Middle East and Africa
- South Africa
- Middle East and Africa
By Product Insights
- The PEBs segment is estimated to witness significant growth during the forecast period.
Pre-engineered steel buildings, a type of metal building construction, have gained significant popularity In the Middle East and Africa (MEA) region due to their versatility and strength. These structures are ideal for various applications, including industrial warehouses, secure storage, agricultural buildings, commercial retail spaces, office buildings, multi-story complexes, workshops, aircraft hangars, residential garages, carports, churches, barns, and even schools. Steel buildings offer flexibility and strength, with customizable designs that cater to specific requirements. Their durability and low-maintenance nature make steel buildings a wise investment for both commercial and residential applications. Quick construction is another advantage, as these structures can be manufactured offsite and installed rapidly.
Get a glance at the market report of share of various segments Request Free Sample
Market Dynamics
Our Middle East and Africa Steel Building Market researchers analyzed the data with 2024 as the base year, along with the key drivers, trends, and challenges. A holistic analysis of drivers will help companies refine their marketing strategies to gain a competitive advantage.
What are the key market drivers leading to the rise in adoption of Middle East and Africa Steel Building Market?
Advantages of PEBs over traditional building is the key driver of the market.
- Pre-engineered steel buildings (PEBs) have gained significant traction In the global construction industry due to their versatility and efficiency. These structures are engineered offsite, with components brought to the construction site for assembly, catering to various customer requirements. PEBs' advantages extend beyond cost-effectiveness and fast construction. Their strength and durability, derived from high-quality steel, make them an eco-friendly alternative, as they can be recycled and reused.
- PEBs offer flexibility, allowing for dismantling and relocation, and are customizable to suit diverse needs, from industrial warehouses and commercial retail spaces to agricultural buildings, offices, multi-story complexes, workshops, aircraft hangars, residential garages, carports, churches, barns, and even schools. These structures provide a safe environment, withstanding harsh elements such as high winds and heavy rainfall, and offering features like fire suppression, energy efficiency, and ventilation.
What are the market trends shaping the Middle East and Africa Steel Building Market?
Growing construction and infrastructure sectors is the upcoming trend In the market.
- The Steel Building Market in MEA is experiencing significant growth due to the increasing industrialization and infrastructure development in countries such as the UAE, Saudi Arabia, Egypt, Iran, and Morocco. Industrial warehouses, agricultural buildings, commercial retail spaces, office buildings, multi-story complexes, workshops, and various other structures are in high demand for secure storage and protection from elements. Metal building construction offers versatility, strength, and durability, making it an ideal choice for various applications. PEBs (Pre-engineered steel buildings) are particularly popular due to their flexibility and strength, which makes them suitable for constructing aircraft hangars, residential garages, carports, churches, and other religious institutions, barns, storage units, sports facilities, schools, and customizable designs.
- The efficiency, versatility, and sturdiness of metal buildings make them an excellent investment for both commercial and residential buildings. Moreover, metal building construction offers several advantages, including quick construction, low-maintenance, affordability, and expandability. Offsite fabrication and fast installation further add to the appeal of metal buildings, making them a popular choice for shipyards, infrastructure projects, and logistics buildings. Additionally, metal buildings offer fire suppression, energy efficiency, ventilation, and can withstand high winds and heavy rainfall.
What challenges does Middle East and Africa Steel Building Market face during the growth?
Low awareness among builders and limited design flexibility in residential sector is a key challenge affecting the market growth.
- Steel buildings offer versatility in construction, making them an ideal choice for various applications, including industrial warehouses, secure storage solutions, agricultural buildings, commercial retail spaces, office buildings, multi-story complexes, workshops, aircraft hangars, residential garages, carports, churches, and religious institutions, among others. Their strength and durability make them suitable for extreme weather conditions, such as high winds and heavy rainfall. In the commercial sector, steel buildings are increasingly popular due to their efficiency, versatility, and sturdiness. Pre-engineered steel buildings are particularly attractive due to their quick construction and low-maintenance nature. They are also cost-effective and can be customized to meet specific requirements.
- Steel buildings are also gaining popularity In the residential sector, although awareness and acceptance are still growing. While concrete buildings require extensive foundation work, steel buildings do not. Their lighter construction also reduces the overall construction time. However, some buyers may prefer the aesthetic appeal of concrete buildings over steel buildings, which have more rudimentary designs. Steel buildings offer a safe and secure environment, making them suitable for storage units, sports facilities, indoor practice areas, schools, and other applications that require a flexible and strong structure. Offsite fabrication and fast installation are other advantages of steel buildings, making them a smart investment for businesses and individuals alike.
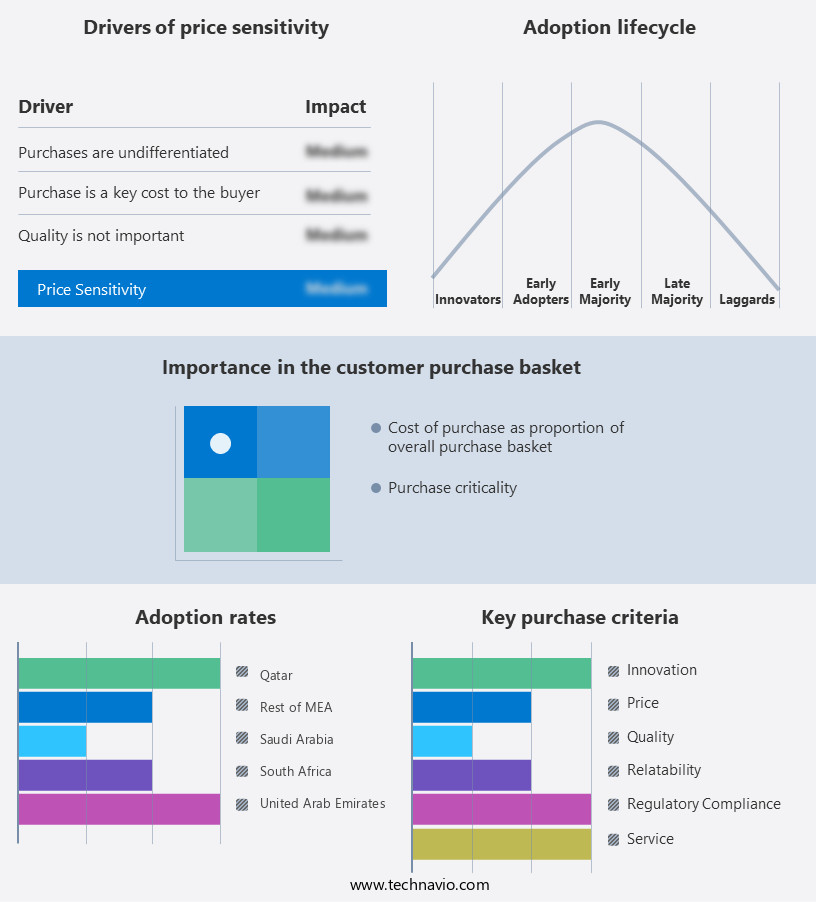
Exclusive Customer Landscape
The market forecasting report includes the adoption lifecycle of the market, covering from the innovator's stage to the laggard's stage. It focuses on adoption rates in different regions based on penetration. Furthermore, the market report also includes key purchase criteria and drivers of price sensitivity to help companies evaluate and develop their market growth analysis strategies.
Customer Landscape
Key Companies & Market Insights
Companies are implementing various strategies, such as strategic alliances, market forecast , partnerships, mergers and acquisitions, geographical expansion, and product/service launches, to enhance their presence In the market.
Afrifab Steel Ltd. - The company offers steel buildings for stadiums, warehouses and malls.
The market research and growth report includes detailed analyses of the competitive landscape of the market and information about key companies, including:
- Al Shahin Metal Industries
- Al Yarmouk Steel and Engg. Co. LLC
- ASTRA Industrial Group
- BSI International Building Systems
- DANA Group of Companies
- Emirates Building System Co. LLC
- Etihad Steel Factory
- Mabani Steel LLC
- Memaar Building Systems FZC
- Modern Industrial Investment Holding Group
- Nesma Group Co.
- SpanAfrica Steel Structures
- Steel Structures Ltd.
- Tamimi Group
- Tiger Steel Engineering LLC
- Tugela Steel
- Yusuf A. Alghanim and Sons WLL
- Zamil Industrial Investment Co.
Qualitative and quantitative analysis of companies has been conducted to help clients understand the wider business environment as well as the strengths and weaknesses of key market players. Data is qualitatively analyzed to categorize companies as pure play, category-focused, industry-focused, and diversified; it is quantitatively analyzed to categorize companies as dominant, leading, strong, tentative, and weak.
Research Analyst Overview
The steel building market encompasses a diverse range of structures, each designed to provide versatility and strength for various industries and applications. Industrial warehouses and storage as well as production halls are among the most common applications, offering secure storage solutions for businesses and protecting their assets from the elements. The flexibility and strength of steel buildings make them an ideal choice for agricultural buildings, providing a safe environment for livestock and crops. Commercial retail spaces and office buildings also benefit from the durability and low-maintenance nature of metal buildings. Multi-story complexes and workshops are engineered to withstand heavy loads and high winds, ensuring a safe and secure work environment.
In addition, customizable structures cater to unique design requirements, with applications ranging from aircraft hangars and residential garages to carports, churches, and religious institutions. Steel buildings offer a contemporary design aesthetic, with the ability to create expansive, open interior spaces. Their modular and expandable nature makes them an attractive investment for businesses, enabling quick construction and easy modification as needs change. Pre-engineered steel buildings offer efficiency and versatility, with the added benefits of flexibility in design and offsite fabrication. The strength and durability of metal buildings make them a popular choice for logistics and storage facilities, providing a safe and secure environment for goods and materials.
Moreover, fire suppression systems and energy efficiency features further enhance their appeal, making them an essential component of infrastructure development. Sports facilities and indoor practice areas benefit from the sturdiness and quick installation of metal buildings, enabling the creation of large, open spaces for athletic activities. Schools and educational institutions also utilize customizable designs to accommodate various learning environments. Metal building construction continues to evolve, offering innovative solutions for various industries and applications. The affordability and efficiency of steel buildings make them a smart investment for businesses and organizations seeking versatile, durable, and customizable structures.
|
Market Scope |
|
|
Report Coverage |
Details |
|
Page number |
188 |
|
Base year |
2024 |
|
Historic period |
2019-2023 |
|
Forecast period |
2025-2029 |
|
Growth momentum & CAGR |
Accelerate at a CAGR of 4% |
|
Market growth 2025-2029 |
USD 281.6 million |
|
Market structure |
Fragmented |
|
YoY growth 2024-2025(%) |
4.0 |
|
Competitive landscape |
Leading Companies, Market Positioning of Companies, Competitive Strategies, and Industry Risks |
What are the Key Data Covered in this Market Research and Growth Report?
- CAGR of the market during the forecast period
- Detailed information on factors that will drive the market growth and forecasting between 2025 and 2029
- Precise estimation of the size of the market and its contribution of the market in focus to the parent market
- Accurate predictions about upcoming market growth and trends and changes in consumer behaviour
- Growth of the market across Middle East and Africa
- Thorough analysis of the market's competitive landscape and detailed information about companies
- Comprehensive analysis of factors that will challenge the growth of market companies
We can help! Our analysts can customize this market research report to meet your requirements. Get in touch