UC 2.0 System Integration Market Size 2024-2028
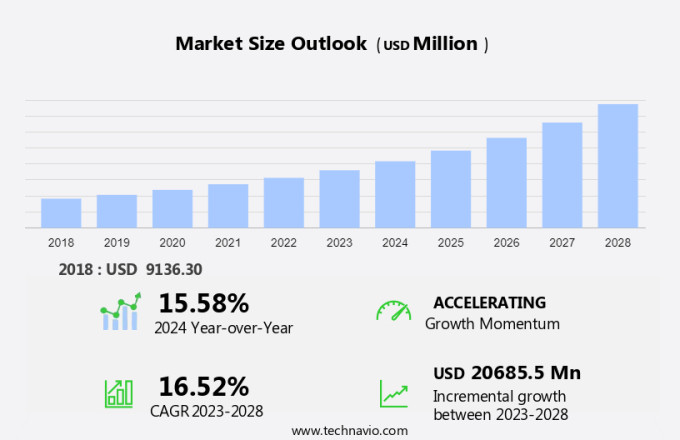
The UC 2.0 system integration market size is estimated to grow by USD 20.69 billion at a CAGR of 16.52% between 2023 and 2028. Unified Communications 2.0 (UC 2.0) system integration offers significant benefits for businesses in today's globalized economy. With the growing need to collaborate and communicate effectively across borders, UC 2.0 provides a seamless platform for real-time voice, video, and messaging communications. The increasing number of mobile computing devices has made it essential for businesses to adopt flexible and accessible communication solutions. UC 2.0 integration enables users to communicate and collaborate from anywhere, using any device, ensuring productivity and connectivity. Moreover, it offers advanced features such as presence information, instant messaging, and conferencing, enhancing teamwork and streamlining workflows. By integrating UC 2.0 into their business operations, organizations can improve communication efficiency, foster collaboration, and ultimately, gain a competitive edge in the global market.
What will be the Size of the Market During the Forecast Period?
For More Highlights About this Report, Request Free Sample
Market Dynamic and Customer Landscape
The market is witnessing significant growth due to the increasing demand for advanced communication tools and productivity enhancement in businesses. UC 2.0 integrates various communication channels, such as voice, video, messaging, and collaboration applications, into a single platform, enabling seamless communication between devices and locations. Large enterprises are increasingly adopting cloud-based unified communication solutions for cost reduction, scalability, and efficiency. These solutions offer real-time communication capabilities, including telephony, conferencing, and email and messaging. Contact centers are also integrating UC 2.0 systems to improve customer engagement and agent productivity. UC 2.0 system integration involves integrating on-premises infrastructure with cloud-based solutions to provide a seamless communication experience.
Further, the integration of UC 2.0 with CEBP (Communications-Enabled Business Processes) further enhances business efficiency by enabling real-time communication between applications and processes. The market is expected to grow at a rapid pace due to the increasing demand for advanced communication tools and the need for businesses to improve communication and collaboration between employees, customers, and partners. The integration of UC 2.0 with various devices and locations also offers flexibility and convenience, making it an essential component of modern business communication.
Key Market Driver
The benefits of UC 2.0 system integration is notably driving market growth. In the digital age, effective communication is essential for productivity and collaboration, especially in the context of remote working and virtual teams. Unified communication platforms have emerged as a solution, integrating various communication channels such as voice, video, and messaging across devices and locations. Cloud-based solutions have gained popularity due to their flexibility and accessibility, allowing users to communicate in real-time from anywhere with an internet connection. The unified communication market encompasses both on-premise and cloud-based systems. On-premise infrastructure requires local servers and hardware for communication services, while cloud-based solutions rely on remote servers. The COVID-19 pandemic has accelerated the adoption of unified communication systems in various sectors, including healthcare, IT and telecom, retail, and contact centers. Artificial intelligence and the Internet of Things are also transforming unified communication systems, enhancing productivity and user experience.
Moreover, communication services such as telephony, conferencing, email and messaging, and collaboration applications are integral components of unified communication platforms. Integrated communication systems enable seamless communication between devices, improving overall efficiency and collaboration. The on-premise market and cloud-based market for unified communication systems continue to grow, offering businesses the flexibility to choose the best solution based on their specific needs and infrastructure. Regardless of the deployment model, unified communication platforms play a crucial role in enabling effective communication and collaboration in today's interconnected world. Thus, such factors are driving the growth of the market during the market forecast period.
Significant Market Trends
The increased adoption of BYOD policies is the key trend in the market. In the digital age, the integration of communication tools and channels has become essential for productivity and collaboration, particularly in the context of remote working and virtual teams. Unified communication platforms, including voice, video, and messaging, have become indispensable for businesses across industries such as healthcare, IT and telecom, retail, and more. The COVID-19 pandemic has further accelerated the adoption of cloud-based solutions, with on-premise infrastructure giving way to remote servers and internet connectivity. Integrated communication systems enable real-time communication between devices and locations, facilitating seamless collaboration and customer engagement. Artificial intelligence and the Internet of Things are increasingly being integrated into these platforms, enhancing functionality and improving user experience.
The market continues to grow, with companies investing in hardware, communication services, and collaboration applications. Contact centers, telephony, conferencing, email and messaging, and collaboration applications are key areas of focus. CEBP (Communication-Enabled Business Processes) is a critical aspect of unified communication, streamlining workflows and improving operational efficiency. Overall, unified communication platforms are transforming the way businesses communicate and collaborate, driving digitalization and innovation in IT and telecom. Thus, such trends will shape the growth of the market during the forecast period.
Major Market Challenge
Data privacy and security concerns is the major challenge that affects the growth of the market. In the digital age, the integration of communication tools and channels has become essential for productivity and collaboration, particularly in the context of remote working and virtual teams. Unified communication platforms offer real-time voice, video, and messaging capabilities across devices and locations, enabling seamless communication. Cloud-based solutions have gained significant traction during the COVID-19 pandemic, allowing businesses to maintain connectivity and communication services even when working from home. Integrated communication systems are increasingly being adopted in various sectors, including healthcare, IT and telecom, retail, and more. Artificial intelligence and the Internet of Things are also being integrated into these platforms to enhance functionality and user experience. The market for on-premise unified communication systems and cloud-based solutions continues to grow, with local servers and hardware providing additional flexibility for businesses. Communication services such as telephony, conferencing, email and messaging, collaboration applications, and contact centers are all integrated into these platforms, providing a comprehensive solution for businesses.
Additionally, CEBP (Communication-Enabled Business Processes) is another area where unified communication platforms are making a significant impact, streamlining workflows and improving efficiency. Remote servers and internet connectivity are crucial components of cloud-based unified communication systems, ensuring reliable and secure communication. On-premises infrastructure continues to play a role, particularly for businesses with specific security requirements or large-scale operations. Overall, unified communication platforms are transforming the way businesses communicate and collaborate, driving digitalization and productivity in the modern workplace. Hence, the above factors will impede the growth of the market during the forecast period.
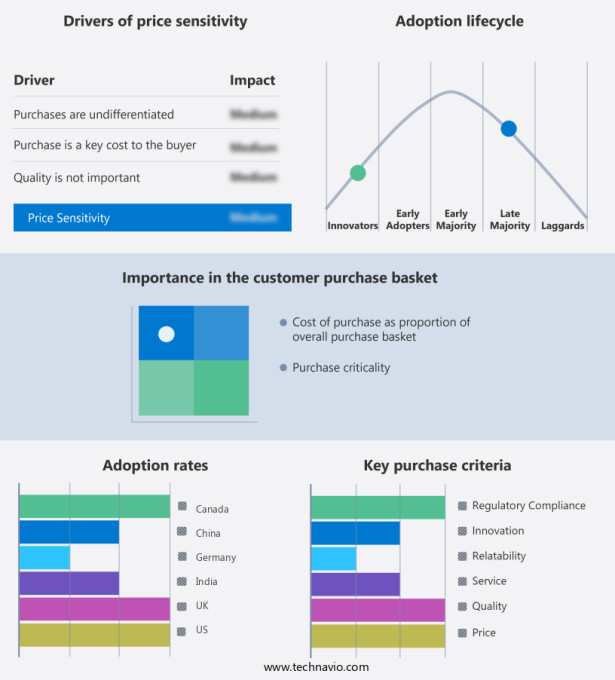
Customer Landscape
The market forecasting report includes the adoption lifecycle of the market, covering from the innovator’s stage to the laggard’s stage. It focuses on adoption rates in different regions based on penetration. Furthermore, the report also includes key purchase criteria and drivers of price sensitivity to help companies evaluate and develop their market growth analysis strategies.
Customer Landscape
Key Companies & Market Insights
Companies are implementing various strategies, such as strategic alliances, partnerships, mergers and acquisitions, geographical expansion, and product/service launches, to enhance their presence in the market.
ALE International - The company offers UC 2.0 system integration such as OmniPCX Enterprise and OXO Connect.
The market research and growth report also includes detailed analyses of the competitive landscape of the market and information about key companies, including:
- Avaya LLC
- Cisco Systems Inc.
- ECOSMOB TECHNOLOGIES PVT. LTD.
- GAVS Technologies NA Inc.
- Gurusons Communications Pvt. Ltd.
- International Business Machines Corp.
- Jampottech
- Matrix Comsec
- Microsoft Corp.
- Mitel Networks Corp.
- NAKA
- NEC Corp.
- Proven IT
- Ribbon Communications Inc.
- Telefonaktiebolaget LM Ericsson
- TrueConf LLC
- VISIONOSS Ltd.
- Wroffy
- Zoom Video Communications Inc.
Qualitative and quantitative analysis of companies has been conducted to help clients understand the wider business environment as well as the strengths and weaknesses of key market players. Data is qualitatively analyzed to categorize companies as pure play, category-focused, industry-focused, and diversified; it is quantitatively analyzed to categorize companies as dominant, leading, strong, tentative, and weak.
Market Segmentation
By Component
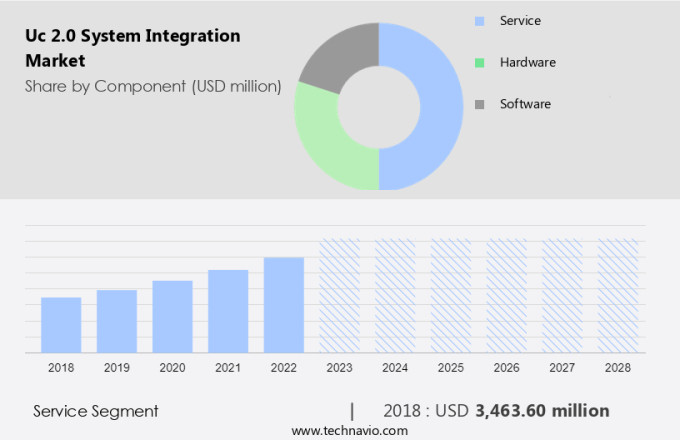
The service segment is estimated to witness significant growth during the forecast period. In the digital age, the integration of communication tools and platforms has become essential for productivity and efficient communication channels. Unified communication systems, which integrate voice, video, messaging, and other communication functionalities, have gained significant importance in the remote working era brought about by the COVID-19 pandemic. Communication devices and locations, whether on-premise or cloud-based, play a crucial role in these systems.
Get a glance at the market share of various regions Download the PDF Sample
The service segment accounted for USD 3.46 billion in 2018. Cloud-based solutions, including cloud-based unified communication platforms, have seen a surge in demand due to their flexibility and accessibility. Real-time communication tools, such as telephony, conferencing, email and messaging, collaboration applications, and contact centers, have become indispensable for virtual teams in various industries, including healthcare, IT and telecom, retail, and more. Artificial intelligence and the Internet of Things have further enhanced the capabilities of unified communication systems, enabling advanced features like voice recognition and automated messaging. Local servers and hardware, as well as remote servers and internet connectivity, are essential components of both on-premise and cloud-based communication services. The market for on-premise and cloud-based unified communication systems continues to grow, with telephony, conferencing, and collaboration applications being key areas of focus.
Regional Analysis
For more insights on the market share of various regions Download PDF Sample now!
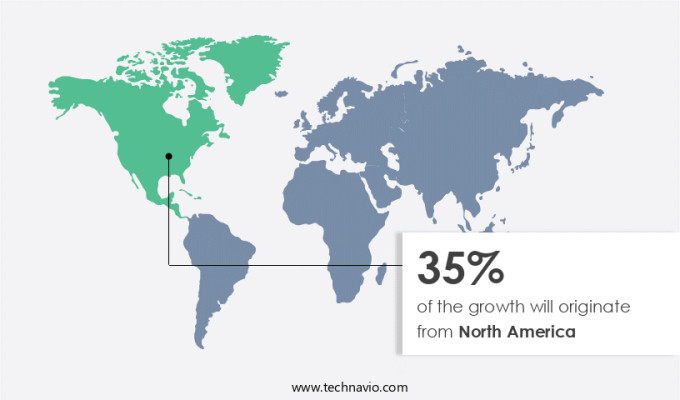
North America is estimated to contribute 35% to the growth of the global market during the forecast period. Technavio’s analysts have elaborately explained the regional trends and drivers that shape the market during the forecast period. The market is witnessing significant growth in large enterprises due to the need for cost reduction and increased efficiency. This market segment is experiencing scalability and technological advancements, which are segmenting the industry chain. The integration of UC 2.0 systems enables seamless communication and collaboration among teams, leading to improved productivity and operational efficiency. The market is driven by the adoption of cloud-based solutions and the integration of AI and machine learning technologies. The scalability and flexibility of these systems allow businesses to easily expand their operations and adapt to changing market conditions. The technology is expected to continue revolutionizing the way businesses communicate and collaborate, making it an essential investment for organizations seeking to remain competitive.
Segment Overview
The market report provides comprehensive data (region-wise segment analysis), with forecasts and estimates in "USD Billion" for the period 2024-2028, as well as historical data from 2018-2022 for the following segments.
- Component Outlook
- Service
- Hardware
- Software
- Solution Outlook
- Data communication solutions
- Voice communication solutions
- Video communication solutions
- Collaboration solutions
- Others
- Region Outlook
- North America
- The U.S.
- Canada
- Europe
- U.K.
- Germany
- France
- Rest of Europe
- APAC
- China
- India
- Middle East & Africa
- Saudi Arabia
- South Africa
- Rest of the Middle East & Africa
- South America
- Argentina
- Brazil
- Chile
- North America
You may also interested in below market reports
2. Unified Communication as a Service (UCaaS) Market by End-user, Application, and Geography, Industry Forecast and Analysis
3. Web Real Time Communication (webRTC) Market Analysis North America, Europe, APAC, South America, Middle East and Africa - US, UK, India, Canada, Germany - Size and Forecast
Market Analyst Overview
In the digital age, Unified Communication 2.0 (UC 2.0) System Integration has become a necessity for businesses to enhance productivity and facilitate seamless communication. UC 2.0 integrates various communication channels, including voice, video, and messaging, on devices and locations, making real-time communication a reality. Cloud-based solutions have been a game-changer, allowing the implementation of Unified Communication Platforms (UCP) with minimal hardware requirements and easy scalability. The IT and telecom industry, healthcare, retail, and other sectors have embraced UC 2.0 System Integration to support remote working and virtual teams. The COVID-19 pandemic has further accelerated this trend, making integrated communication systems essential for businesses to maintain continuity.
In addition, UC 2.0 offers several advantages, such as telephony, conferencing, email and messaging, collaboration applications, contact centers, and more. The market for UC 2.0 System Integration is segmented into On-Premise and Cloud-Based markets. On-Premise solutions rely on local servers and hardware, while Cloud-Based solutions leverage remote servers and Internet connectivity. Artificial intelligence and the Internet of Things are also transforming UC 2.0, enabling advanced features like voice recognition and automated call routing. The future of UC 2.0 System Integration looks promising, with continuous innovation and digitalization driving growth in the market.
|
Market Scope |
|
|
Report Coverage |
Details |
|
Page number |
204 |
|
Base year |
2023 |
|
Historic period |
2018-2022 |
|
Forecast period |
2024-2028 |
|
Growth momentum & CAGR |
Accelerate at a CAGR of 16.52% |
|
Market growth 2024-2028 |
USD 20.69 billion |
|
Market structure |
Fragmented |
|
YoY growth 2023-2024(%) |
15.58 |
|
Regional analysis |
North America, Europe, APAC, Middle East and Africa, and South America |
|
Performing market contribution |
North America at 35% |
|
Key countries |
US, China, Germany, UK, Canada, and India |
|
Competitive landscape |
Leading Companies, Market Positioning of Companies, Competitive Strategies, and Industry Risks |
|
Key companies profiled |
ALE International, Avaya LLC, Cisco Systems Inc., ECOSMOB TECHNOLOGIES PVT. LTD., GAVS Technologies NA Inc., Gurusons Communications Pvt. Ltd., International Business Machines Corp., Jampottech, Matrix Comsec, Microsoft Corp., Mitel Networks Corp., NAKA, NEC Corp., Proven IT, Ribbon Communications Inc., Telefonaktiebolaget LM Ericsson, TrueConf LLC, VISIONOSS Ltd., Wroffy, and Zoom Video Communications Inc. |
|
Market dynamics |
Parent market analysis, Market growth inducers and obstacles, Fast-growing and slow-growing segment analysis, Market growth and Forecasting, COVID-19 impact and recovery analysis and future consumer dynamics, Market condition analysis for forecast period |
|
Customization purview |
If our report has not included the data that you are looking for, you can reach out to our analysts and get segments customized. |
What are the Key Data Covered in this Market Research Report?
- CAGR of the market during the forecast period
- Detailed information on factors that will drive the market growth and forecasting between 2024 and 2028
- Precise estimation of the size of the market and its contribution of the market in focus to the parent market
- Accurate predictions about upcoming market growth and trends and changes in consumer behavior
- Growth of the market across North America, Europe, APAC, Middle East and Africa, and South America
- Thorough analysis of the market’s competitive landscape and detailed information about companies
- Comprehensive analysis of factors that will challenge the growth of market companies


