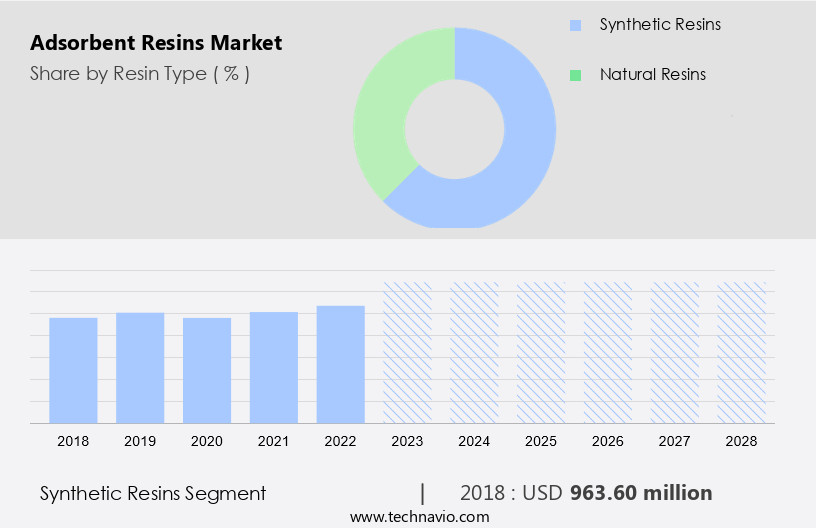
Adsorbent Resins Market Size 2024-2028
The adsorbent resins market size is forecast to increase by USD 662.7 million at a CAGR of 7% between 2023 and 2028.
- The market is witnessing significant growth due to several key trends. Companies in this market are launching new products to cater to the increasing demand for bio-based adsorbent resins. This shift towards eco-friendly solutions is driven by stringent regulations on traditional adsorbent resins. Applications in denitrogenation technology, ethylene purification, crude oil, hydrofracking, biopharmaceuticals, oxygen cylinders, oxygen therapy, home isolation, hospitals, and medical devices further expand the market. Additionally, the growing awareness of water and air pollution and the need for effective solutions to mitigate these issues are fueling market growth. However, the market faces challenges such as high production costs and the availability of alternative technologies. Despite these challenges, the market is expected to continue its growth trajectory due to its essential role in various industries, including water treatment, pharmaceuticals, and food and beverage. The market analysis report provides a comprehensive study of these trends and challenges, offering valuable insights to stakeholders.
What will be the Size of the Adsorbent Resins Market During the Forecast Period?
- The adsorbent resins market encompasses a wide range of applications, primarily focused on water treatment and the removal of impurities and contaminants. Industrial wastewater treatment is a significant sector, utilizing adsorbents to remove toxic materials and improve water quality. Adsorbents are also essential in various industries, including petrochemicals, electronics, and healthcare, for applications such as denitrogenation technology, oxygen concentrators, and medical devices. Low-cost polymer-based adsorbents are gaining popularity due to their thermal stability and abrasion resistance, making them suitable for use in air-conditioners, refrigerators, and oxygen cylinders. Adsorption is a surface-based phenomenon that relies on chemical bonding between the adsorbent and the impurities.
- Moreover, the high surface area and porosity of adsorbent resins enable efficient adsorption, making them effective in applications like water treatment, air purification, and environmental cleanup. The market for adsorbent resins is growing, driven by the increasing demand for clean water and air, as well as the need for efficient impurity removal in various industries. Applications in water treatment, denitrogenation technology, and oxygen therapy are expected to remain key growth areas. Specialty resin materials continue to be developed to address specific application requirements and improve overall market performance.
How is this Adsorbent Resins Industry segmented and which is the largest segment?
The adsorbent resins industry research report provides comprehensive data (region-wise segment analysis), with forecasts and estimates in "USD million" for the period 2024-2028, as well as historical data from 2018-2022 for the following segments.
- Resin Type
- Synthetic resins
- Natural resins
- Application
- Water and wastewater treatment
- Pharmaceuticals and biotechnology
- Food and beverage
- Chemical manufacturing
- Others
- Geography
- APAC
- China
- India
- Japan
- South Korea
- North America
- Canada
- US
- Europe
- Germany
- UK
- France
- Middle East and Africa
- South America
- Brazil
- APAC
By Resin Type Insights
- The synthetic resins segment is estimated to witness significant growth during the forecast period.
Synthetic adsorbent resins are specialized materials engineered for optimal performance in diverse industrial applications. Notably, they are extensively utilized in water treatment for purification, deionization, and softening. These resins facilitate the exchange of ions in water with ions adhered to the resin, thereby eliminating impurities. Ion exchange resins are indispensable in sectors such as water treatment, pharmaceuticals, and food processing, where stringent purity standards are required. Additionally, chelating resins are engineered to selectively bind metal ions from solutions. They are particularly valuable in wastewater treatment for heavy metal removal and in industrial processes for metal recovery. Adsorbent resins, including Activated Carbon, Molecular Sieve, Activated Alumina, Clay, and Silica Gel, exhibit superior thermal stability and abrasion resistance, ensuring longevity and efficiency.
Get a glance at the Adsorbent Resins Industry report of share of various segments Request Free Sample
The synthetic resins segment was valued at USD 963.60 million in 2018 and showed a gradual increase during the forecast period.
Regional Analysis
- APAC is estimated to contribute 35% to the growth of the global market during the forecast period.
Technavio's analysts have elaborately explained the regional trends and drivers that shape the market during the forecast period.
For more insights on the market share of various regions, Request Free Sample
The adsorbent resins market In the Asia Pacific (APAC) region is experiencing significant growth due to increasing industrialization and stringent environmental regulations. Adsorbent resins, a key segment of this market, are extensively used in various applications such as water and industrial wastewater treatment, chemical manufacturing, pharmaceuticals, and renewable energy production. The industrial sectors in China, India, South Korea, and Japan, which are undergoing rapid growth, are major contributors to the demand for adsorbent resins. These resins play a crucial role in ensuring the purity of industrial outputs by removing impurities and contaminants. Key applications include sulfur removal in petrochemicals, denitrogenation technology, and mercury removal in power generation.
Market Dynamics
Our researchers analyzed the data with 2023 as the base year, along with the key drivers, trends, and challenges. A holistic analysis of drivers will help companies refine their marketing strategies to gain a competitive advantage.
What are the key market drivers leading to the rise In the adoption of Adsorbent Resins Industry?
New product launches by companies is the key driver of the market.
- The market is experiencing notable growth due to the increasing demand for water treatment solutions in various industries. Industrial wastewater treatment, particularly for the removal of toxic materials, is a significant application driving market expansion. Adsorbents, including Activated Carbon, Molecular Sieve, Activated Alumina, Clay, Silica Gel, and others, play a crucial role in ensuring water quality in various sectors such as petrochemicals, sulfur removal, and gas refining. New product innovations continue to emerge In the market. For instance, Alfa Chemistry recently introduced three new adsorbent resins for ion exchange chromatography applications. These resins offer versatility in removing organic matter from wastewater, decolorizing sugar solutions, and facilitating the separation and refinement of natural products and biochemical compounds.
- In addition, the new product offerings cater to specific customer requirements, such as polymer types, moisture content, swelling rate, effective size, and ionic form. Adsorbent resins are also essential in various consumer goods, including air-conditioners, refrigerators, oxygen concentrators, and medical devices. Key market trends include the development of low-cost polymer-based adsorbents, thermal stability, and abrasion resistance to enhance the overall performance and longevity of adsorbent resins. Novel resin formulations, bio-based resins, and regeneration capabilities are also gaining popularity due to their environmental benefits and cost-effectiveness.
What are the market trends shaping the Adsorbent Resins Industry?
Increasing demand for bio-based adsorbent resin is the upcoming market trend.
- The market is witnessing a significant shift towards eco-friendly, bio-based alternatives, driven by increasing demand for sustainable solutions and stringent environmental regulations. Bio-based adsorbent resins, derived from renewable resources like plant-based materials, offer a more sustainable alternative to traditional petroleum-based resins. These resins perform similar functions, such as adsorption of contaminants and impurities, but with a lower environmental impact. One key advantage of bio-based adsorbent resins is their biodegradability. Unlike traditional resins, which can persist In the environment for extended periods, bio-based resins degrade more easily, reducing plastic waste accumulation. In various industries, including water treatment for industrial wastewater and toxic materials, as well as in consumer goods such as air-conditioners, refrigerators, and oxygen concentrators, adsorbents play a crucial role in ensuring water quality and removing impurities.
- Furthermore, bio-based adsorbent resins are also used in denitrogenation technology for petrochemicals, sulfur removal, and hydrogenation processes. Applications in gas refining, air separation, drying, sulfur poisoning, mercury removal, ethylene purification, and crude oil processing are also common. In the chemicals sector, bio-based adsorbent resins are used for desulfurization, hydro-sulfurization, and raw material purification. Innovations In the adsorbent resin market include novel resin formulations, automation technologies, and 3D printing. The market is expected to grow as industries continue to seek cost-effective, high-performance adsorbents with thermal stability, abrasion resistance, and regeneration capabilities. Additionally, advancements in continuous monitoring systems and the development of aromatic and modified aromatic resins, as well as methacrylic resins, are expected to further drive market growth.
What challenges does the Adsorbent Resins Industry face during its growth?
Stringent regulation on adsorbent resins is a key challenge affecting the industry growth.
- The global adsorbent resin market encounters regulatory challenges due to stringent frameworks. In Europe, REACH regulations mandate comprehensive compliance for industrial applications, requiring detailed documentation and evaluation of chemical substances for human health and environmental risks. This process can be resource-intensive and time-consuming, affecting market agility. In the US, the Food and Drug Administration (FDA) enforces rigorous guidelines for adsorbent resins in food and pharmaceutical applications, ensuring safety through extensive testing and validation. Key applications of adsorbent resins include water treatment for industrial wastewater and freshwater, toxic materials removal, and air purification in appliances like air-conditioners, refrigerators, and oxygen concentrators.
- In addition, adsorbent technologies like denitrogenation, desulfurization, hydrogenation, hydro-sulfurization, and distillate fuels purification are essential in various industries, including petrochemicals, sulfur removal, and gas refining. Novel resin formulations, such as bio-based resins and specialty resin materials, are gaining popularity due to their regeneration capabilities and eco-friendly attributes. Automation technologies, including 3D printing and continuous monitoring systems, are also advancing the adsorbent resin market. Key applications include the adsorption of impurities and contaminants, mercury removal, ethylene purification, and crude oil refining. Additionally, adsorbent resins are used in hydrofracking and various consumer goods sectors, such as biopharmaceuticals, oxygen cylinders, oxygen therapy, home isolation, hospitals, medical devices, and ambient air purification.
Exclusive Customer Landscape
The adsorbent resins market forecasting report includes the adoption lifecycle of the market, covering from the innovator's stage to the laggard's stage. It focuses on adoption rates in different regions based on penetration. Furthermore, the adsorbent resins market report also includes key purchase criteria and drivers of price sensitivity to help companies evaluate and develop their market growth analysis strategies.
Customer Landscape
Key Companies & Market Insights
Companies are implementing various strategies, such as strategic alliances, adsorbent resins market forecast, partnerships, mergers and acquisitions, geographical expansion, and product/service launches, to enhance their presence In the industry.
The industry research and growth report includes detailed analyses of the competitive landscape of the market and information about key companies, including:
- Arkema
- BASF SE
- Bengbu Dongli Chemical Co Ltd.
- Bio Rad Laboratories Inc.
- China Huayue New Materials Technology Group Co., Ltd.
- DuPont de Nemours Inc.
- Henan Comcess Industry Co., Ltd. A
- Hengshui Snowate Environmental Technology Co Ltd.
- Ion Exchange India Ltd.
- IPSUM LIFESCIENCES LLP
- Jacobi Resins
- Lanxess AG
- Merck KGaA
- Mitsubishi Chemical Group Corp.
- Purolite Corp.
- Sunresin New Materials Co.Ltd.
- Suzhou bojie resin technology Co.Ltd
- Taiyuan Lanlang Technology Industrial Corp.
- Thermax Ltd.
- Thermo Fisher Scientific Inc.
Qualitative and quantitative analysis of companies has been conducted to help clients understand the wider business environment as well as the strengths and weaknesses of key industry players. Data is qualitatively analyzed to categorize companies as pure play, category-focused, industry-focused, and diversified; it is quantitatively analyzed to categorize companies as dominant, leading, strong, tentative, and weak.
Research Analyst Overview
The adsorbent resins market encompasses a wide range of materials used for the removal of impurities and contaminants from various industrial and environmental applications. These materials, including water treatment adsorbents, exhibit unique properties such as high adsorption capacity, thermal stability, and abrasion resistance, making them indispensable in numerous industries. Water treatment is a significant end-use sector for adsorbents, particularly In the context of industrial wastewater treatment. In this application, adsorbents play a crucial role In the removal of toxic materials and contaminants, ensuring the production of freshwater suitable for reuse or discharge. Adsorbents are also extensively used in gas refining and air separation processes.
Moreover, in gas refining, adsorbents are employed to remove impurities such as sulfur and nitrogen from natural gas streams, enabling the production of cleaner fuels. In air separation, adsorbents are used to purify air streams, producing oxygen for various applications, including medical oxygen therapy, home isolation, and industrial processes. Adsorbents find extensive use In the petrochemical industry for sulfur removal and denitrogenation technology. Sulfur removal is essential to prevent sulfur poisoning of catalysts and equipment, while denitrogenation is necessary to produce high-purity hydrocarbons. The adsorbent resins market includes a diverse range of materials, such as activated carbon, molecular sieves, activated alumina, clay, silica gel, and various resin-based materials.
Furthermore, these materials exhibit unique properties, including high surface area, porosity, and chemical bonding, which enable their adsorption capabilities. The development of low-cost polymer-based adsorbents has gained significant attention in recent years due to their potential to offer cost-effective solutions for various applications. These materials are also being explored for their regeneration capabilities, enabling their reuse and reducing the overall cost of adsorbent-based processes. Automation technologies, such as continuous monitoring systems and 3D printing, are increasingly being adopted In the production and application of adsorbents. These technologies enable the production of high-performance adsorbents with precise control over their properties and improved efficiency.
In addition, novel resin formulations, including bio-based resins derived from renewable resources, are also gaining traction In the adsorbent resins market. These materials offer environmental benefits and can contribute to the reduction of greenhouse gas emissions, making them attractive alternatives to traditional adsorbents. The adsorbent resins market is driven by the increasing demand for water purification and the need for cleaner fuels and air. The market is also influenced by regulatory requirements for environmental cleanup and the growing demand for high-purity raw materials in various industries.
|
Market Scope |
|
|
Report Coverage |
Details |
|
Page number |
216 |
|
Base year |
2023 |
|
Historic period |
2018-2022 |
|
Forecast period |
2024-2028 |
|
Growth momentum & CAGR |
Accelerate at a CAGR of 7% |
|
Market growth 2024-2028 |
USD 662.7 million |
|
Market structure |
Fragmented |
|
YoY growth 2023-2024(%) |
6.3 |
|
Key countries |
US, China, Germany, Japan, India, France, UK, Brazil, South Korea, and Canada |
|
Competitive landscape |
Leading Companies, market growth and forecasting , Market Positioning of Companies, Competitive Strategies, and Industry Risks |
What are the Key Data Covered in this Adsorbent Resins Market Research and Growth Report?
- CAGR of the Adsorbent Resins industry during the forecast period
- Detailed information on factors that will drive the growth and forecasting between 2024 and 2028
- Precise estimation of the size of the market and its contribution of the industry in focus to the parent market
- Accurate predictions about upcoming growth and trends and changes in consumer behaviour
- Growth of the market across APAC, North America, Europe, Middle East and Africa, and South America
- Thorough analysis of the market's competitive landscape and detailed information about companies
- Comprehensive analysis of factors that will challenge the adsorbent resins market growth of industry companies
We can help! Our analysts can customize this adsorbent resins market research report to meet your requirements.


