Aftermarket Automotive Parts And Components Market Size 2024-2028
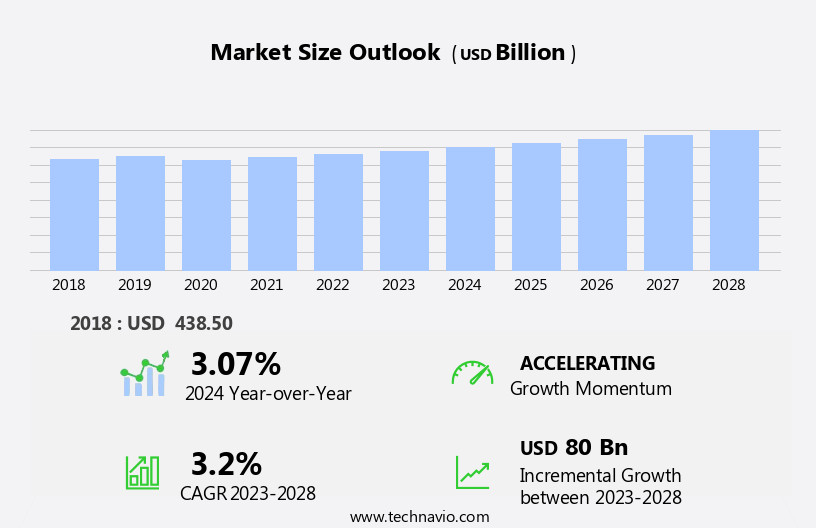
The aftermarket automotive parts and components market size is forecast to increase by USD 80 billion at a CAGR of 3.2% between 2023 and 2028.
- The market is experiencing significant shifts in consumer behavior and business dynamics. One of the most prominent trends is the growing convenience of purchasing automotive aftermarket products online, leading to an increase in popularity for aftermarket e-retailing. However, this trend comes with its challenges. Despite the ease of online shopping, price sensitivity remains a major concern for consumers, resulting in margin pressure on e-retailers. This dynamic requires strategic planning and innovative solutions to maintain profitability and meet evolving customer expectations. Companies must focus on competitive pricing, efficient supply chain management, and value-added services to differentiate themselves in the market.
- Additionally, addressing the challenges of counterfeit parts and ensuring product authenticity will be crucial for building trust and customer loyalty. By staying agile and responsive to these market drivers and challenges, businesses can effectively capitalize on the opportunities presented in the market.
What will be the Size of the Aftermarket Automotive Parts And Components Market during the forecast period?
- The market continues to evolve, driven by various sectors and market dynamics. Customer experience plays a pivotal role, with replacement parts and maintenance essential for ensuring vehicle longevity and satisfaction. In heavy-duty vehicles, fleet operators rely on supply chain transparency and inventory management to minimize downtime and maintain productivity. Performance parts and green technologies cater to DIY enthusiasts and those seeking improved fuel efficiency. Research and development in materials science and data analytics fuel innovation, while the Internet of Things and artificial intelligence optimize operations and enhance technical support. Online retailers offer convenience, while brand loyalty and ethical sourcing remain key considerations for consumers.
- The automotive industry's shift towards electric vehicle, autonomous, and connected vehicles necessitates continuous adaptation, with electrical parts and product certification becoming increasingly important. Quality control and OEM parts ensure safety and reliability, while auto repair shops and independent garages provide essential services for the aftermarket. Carbon emissions and product liability concerns persist, necessitating ongoing efforts in sustainability and ethical manufacturing practices. The market's continuous dynamism underscores the importance of adaptability and responsiveness to emerging trends and customer needs.
How is this Aftermarket Automotive Parts And Components Industry segmented?
The aftermarket automotive parts and components industry research report provides comprehensive data (region-wise segment analysis), with forecasts and estimates in "USD billion" for the period 2024-2028, as well as historical data from 2018-2022 for the following segments.
- Product
- Tire
- Brake parts
- Battery
- Filter
- Others
- Distribution Channel
- Retail
- Wholesale
- End-User
- DIY Consumers
- Professional Mechanics
- Fleet Operators
- Vehicle Type
- Passenger Cars
- Commercial Vehicles
- Two-Wheelers
- Geography
- North America
- US
- Canada
- Mexico
- Europe
- France
- Germany
- Italy
- Spain
- UK
- Middle East and Africa
- UAE
- APAC
- China
- India
- Japan
- South Korea
- South America
- Brazil
- Rest of World (ROW)
- North America
By Product Insights
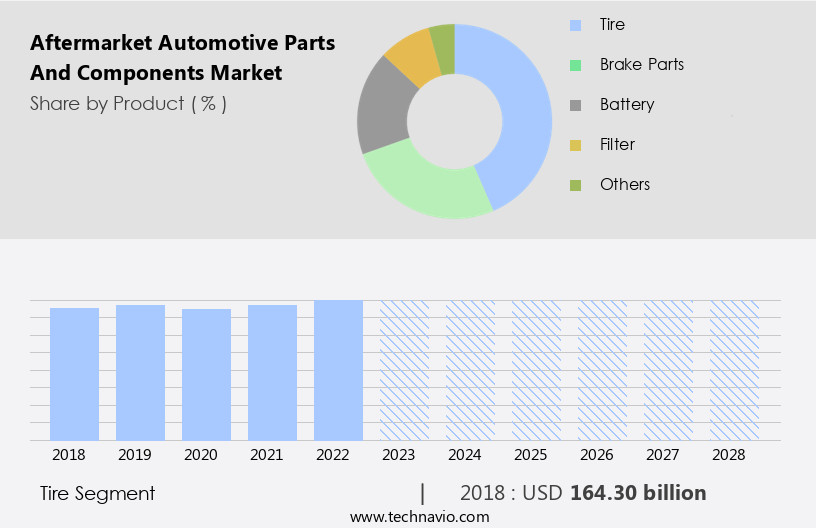
The tire segment is estimated to witness significant growth during the forecast period.
The market is experiencing significant growth due to various factors. The aging vehicle population in mature automobile markets, such as the US, Japan, and Western Europe, is driving the demand for replacement parts, including interior and exterior components, engine parts, suspension parts, brake parts, and transmission parts. In addition, fleet operators prioritize fuel efficiency and maintenance parts for heavy-duty vehicles, leading to an increased focus on performance parts and green technologies. Moreover, the integration of artificial intelligence, data analytics, and the internet of things in the automotive industry is revolutionizing inventory management and supply chain transparency.
This enables automotive manufacturers and aftermarket suppliers to streamline their operations and improve customer satisfaction. Furthermore, the increasing popularity of DIY enthusiasts and online retailers is disrupting traditional sales channels, providing customers with more options and convenience. However, product liability, ethical sourcing, and product certification remain critical concerns for both OEMs and aftermarket suppliers. The shift towards electric, hybrid, and autonomous vehicles is also impacting the market, with a growing demand for electrical parts and connected vehicles. Quality control and technical support are essential for maintaining brand loyalty and customer trust. In summary, the market is evolving rapidly, with a focus on innovation, sustainability, and customer experience.
The integration of various technologies and trends, including the circular economy, inventory management, artificial intelligence, and green technologies, is shaping the future of the industry.
The Tire segment was valued at USD 164.30 billion in 2018 and showed a gradual increase during the forecast period.
Regional Analysis
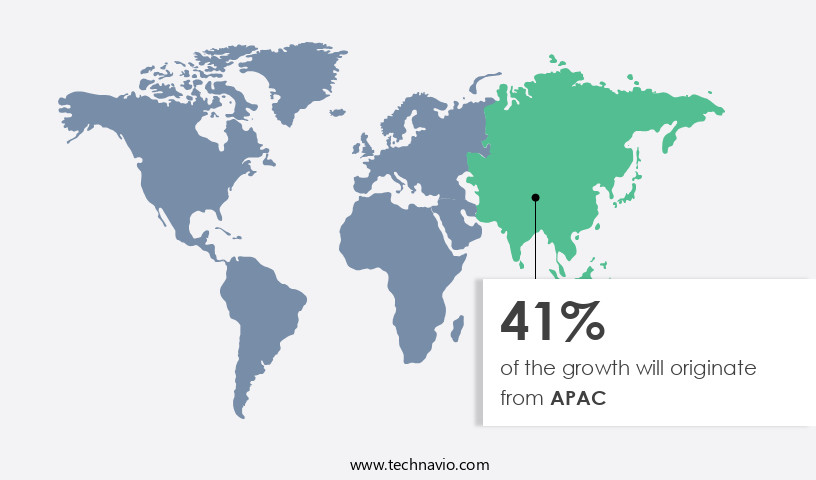
APAC is estimated to contribute 41% to the growth of the global market during the forecast period.Technavio's analysts have elaborately explained the regional trends and drivers that shape the market during the forecast period.
The market in APAC is driven by several key factors. Prominent revenue contributors to this market are China, India, and Japan, due to their high vehicle adoption rates. Increasing disposable incomes in emerging economies like China and India have led to a surge in vehicle sales, subsequently increasing the demand for automotive parts and components. The automotive industry's significant contribution to the region's economy also necessitates reliable Vehicle Roadside Assistance services. Moreover, the rise in sales of luxury cars, which require premium parts and components, positively impacts the market. Green technologies, such as electric and hybrid vehicles, are gaining popularity, driving the demand for replacement parts and components.
Fleet operators, including commercial and heavy-duty vehicle operators, require regular maintenance, leading to a consistent demand for maintenance parts. Artificial intelligence, data analytics, and the Internet of Things are transforming the market by enabling predictive maintenance, improving inventory management, and enhancing customer experience. Research and development in materials science, performance parts, and fuel efficiency are also significant trends. DIY enthusiasts and independent garages contribute to the market by demanding custom and repair parts. Brand loyalty and technical support from online retailers are essential factors influencing customer satisfaction. Ethical sourcing, product certification, and supply chain transparency are crucial for maintaining quality control and mitigating product liability risks.
The integration of connected vehicles, electric vehicles, autonomous vehicles, and electrical parts is shaping the future of the market. In conclusion, the market in APAC is experiencing significant growth due to various factors, including increasing vehicle sales, the adoption of green technologies, and the integration of advanced technologies. These trends are expected to continue shaping the market during the forecast period.
Market Dynamics
Our researchers analyzed the data with 2023 as the base year, along with the key drivers, trends, and challenges. A holistic analysis of drivers will help companies refine their marketing strategies to gain a competitive advantage.
The Global Aftermarket Automotive Parts Market, with tire sales up thrives with aftermarket tires for SUVs and brake pads for sedans. Aftermarket parts trends 2024 highlight budget-friendly car tires and spare parts for EVs. Aftermarket batteries for hybrids and suspension components for trucks drive demand, per aftermarket parts forecast. Car chemicals for maintenance leverage aftermarket parts for fuel efficiency, while filters for passenger cars ensure reliability. Aftermarket parts for used cars and components for heavy vehicles enhance longevity. Aftermarket parts for sustainability, advanced aftermarket technologies, and aftermarket supply chain optimize growth. Aftermarket parts for regulatory compliance, aftermarket parts for global markets, aftermarket parts for vehicle safety, aftermarket parts for cost efficiency, and aftermarket parts for B2B sectors fuel expansion through 2028.
What are the key market drivers leading to the rise in the adoption of Aftermarket Automotive Parts And Components Industry?
- The significant convenience offered by purchasing automotive products online serves as the primary market driver. The global aftermarket for automotive repair parts is experiencing significant growth due to several key factors. One primary driver is the increasing lifespan of vehicles, resulting in a larger vehicle population in major automotive markets. This expansion in vehicle numbers fuels the demand for repair and maintenance services, thereby propelling market growth. The average age of vehicles continues to rise, with the global average reaching over 12 years in 2020. This trend has been ongoing for the past decade and a half. Commercial vehicles, such as buses and trucks, as well as light-duty vehicles like sedans and SUVs, are all contributing to this trend.
- In addition, the growing popularity of hybrid and electric vehicles is increasing the demand for specialized repair parts, particularly for exterior parts, custom parts, brake parts, and suspension parts. Enhanced customer service and the application of advanced technologies like machine learning are further improving the aftermarket landscape.
What are the market trends shaping the Aftermarket Automotive Parts And Components Industry?
- The trend toward e-commerce in the aftermarket for automotive parts and components is gaining significant traction, representing a notable market development in this industry. Aftermarket e-retailing is becoming increasingly popular, offering convenience, competitive pricing, and easy access to a wide range of parts for automotive consumers.
- The aftermarket automotive parts and components industry is experiencing significant shifts as online sales gain popularity. E-commerce platforms are driving revenue growth in this sector due to their convenience and benefits. In recent years, online sales of aftermarket automotive parts and components have surpassed traditional brick-and-mortar sales, fueled by digitalization. Key trends in the market include the adoption of circular economy principles, inventory management systems, and artificial intelligence. These innovations aim to improve supply chain transparency, reduce warranty claims, and enhance customer satisfaction. Interior and body parts, as well as engine parts, are popular categories in the aftermarket.
- Fleet operators and individual consumers alike seek replacement parts for their vehicles, and the market caters to their needs. Green technologies are increasingly influencing the industry, with a focus on sustainability and reducing waste. E-commerce platforms provide several advantages, such as easy access to a wide range of parts, competitive pricing, and the ability to compare offerings from various sellers. These factors contribute to the growing preference for online sales channels. In conclusion, the aftermarket automotive parts and components industry is undergoing transformative changes, with e-commerce platforms playing a pivotal role in its growth. The industry's focus on innovation, sustainability, and customer satisfaction will continue to shape its future.
What challenges does the Aftermarket Automotive Parts And Components Industry face during its growth?
- The e-retail industry faces significant pressure to maintain margins due to heightened price sensitivity among consumers, posing a significant challenge to industry growth.
- The market is experiencing significant growth due to the increasing demand for maintenance and repair services as vehicle populations rise globally. However, a shortage of skilled technicians in professional automotive repair shops poses a challenge to the market. This issue may result in these shops spending less on parts and components. Factors contributing to the technician shortage include a lack of clear career paths, unequal compensation packages, and long working hours. To retain skilled technicians, repair shops must adapt their strategies. Customer experience is a crucial aspect of the market, with performance parts and fuel efficiency being key priorities for both heavy-duty vehicle and passenger vehicle owners.
- Research and development in materials science is essential to producing high-quality, cost-effective parts. DIY enthusiasts also contribute to the market, purchasing parts online from various retailers. Technical support is vital for both professional repair shops and individual consumers, ensuring proper installation and usage of components. In conclusion, the market is driven by the growing demand for maintenance and repair services, the importance of customer experience, and the need for skilled technicians. The market also benefits from ongoing research and development in materials science and the increasing popularity of online retailers. Despite the challenges, the market remains dynamic and innovative, with a focus on providing top-quality parts and components to meet the evolving needs of consumers. Recent research suggests that the market will continue to grow, driven by these trends and the increasing importance of automotive maintenance and repair.
Exclusive Customer Landscape
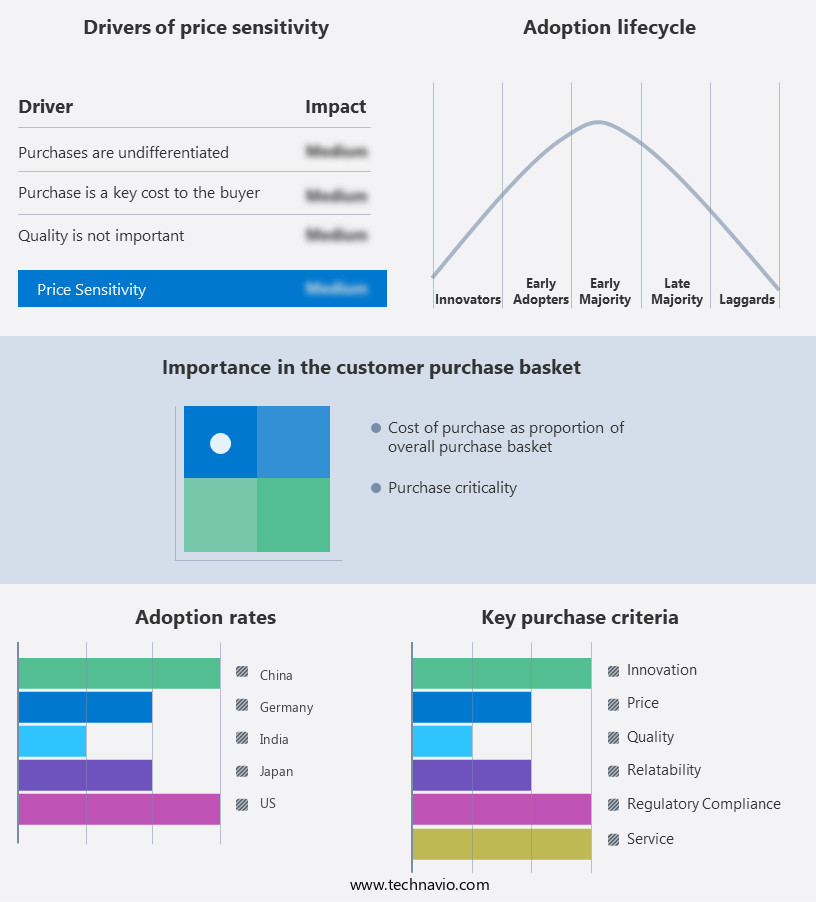
The aftermarket automotive parts and components market forecasting report includes the adoption lifecycle of the market, covering from the innovator's stage to the laggard's stage. It focuses on adoption rates in different regions based on penetration. Furthermore, the aftermarket automotive parts and components market report also includes key purchase criteria and drivers of price sensitivity to help companies evaluate and develop their market growth analysis strategies.
Customer Landscape
Key Companies & Market Insights
Companies are implementing various strategies, such as strategic alliances, aftermarket automotive parts and components market forecast, partnerships, mergers and acquisitions, geographical expansion, and product/service launches, to enhance their presence in the industry.
Bosch Auto Parts - The company specializes in supplying aftermarket automotive parts and components, encompassing mirror buttons, lighting systems, polishing compounds, and insulation foam sheets. Our offerings cater to enhancing vehicle aesthetics and functionality, ensuring customer satisfaction. With a commitment to quality and originality, we provide solutions that elevate the performance and appearance of various automotive makes and models. Our extensive inventory is meticulously sourced to ensure compatibility and reliability, enabling US to meet the diverse needs of our clientele. By focusing on continuous innovation and improvement, we aim to exceed customer expectations and deliver unparalleled value in the automotive aftermarket industry.
The industry research and growth report includes detailed analyses of the competitive landscape of the market and information about key companies, including:
- Bosch Auto Parts
- ZF Friedrichshafen AG
- Continental AG
- Denso Corporation
- Aisin Seiki Co. Ltd.
- Valeo SA
- Magna International Inc.
- Tenneco Inc.
- Federal-Mogul LLC
- Standard Motor Products Inc.
- Advance Auto Parts Inc.
- O'Reilly Automotive Inc.
- AutoZone Inc.
- Bharat Forge Ltd.
- Minda Industries Ltd.
- TVS Motor Company Ltd.
- Hero MotoCorp Ltd.
- Beijing Automotive Parts Co. Ltd.
- Weichai Power Co. Ltd.
- FAW Group Corporation
Qualitative and quantitative analysis of companies has been conducted to help clients understand the wider business environment as well as the strengths and weaknesses of key industry players. Data is qualitatively analyzed to categorize companies as pure play, category-focused, industry-focused, and diversified; it is quantitatively analyzed to categorize companies as dominant, leading, strong, tentative, and weak.
Recent Development and News in Aftermarket Automotive Parts And Components Market
- In January 2023, Denso Corporation, a leading global automotive technology supplier, announced the launch of its new aftermarket parts business platform, DENSO Aftermarket Solutions (DAS). This digital platform aims to streamline the sales process for automotive repair shops and enhance their customer experience by providing real-time access to product information and ordering capabilities (Denso Corporation Press Release).
- In March 2024, Magna International, a leading automotive supplier, entered into a strategic partnership with CarParts.Com, a leading online retailer of automotive parts and accessories. This collaboration aimed to expand Magna's aftermarket reach and leverage CarParts.Com's digital expertise to offer a more comprehensive and convenient shopping experience for customers (Magna International Press Release).
- In May 2025, Aptiv PLC, a global technology company, completed the acquisition of Valeo Service, a leading European aftermarket parts supplier. This acquisition strengthened Aptiv's aftermarket presence, particularly in Europe, and expanded its product offerings to include a broader range of components and systems (Aptiv PLC Press Release).
Research Analyst Overview
The market is characterized by a complex and dynamic landscape, shaped by various trends and market forces. Online ordering has revolutionized the way businesses and consumers purchase parts, with a parts catalog serving as a crucial tool for identifying the right components. Compliance with regulations, data analytics, and sustainability are key concerns, driving the need for parts that meet specific standards and are eco-friendly. Parts pricing, labor costs, and inventory management are critical factors influencing market activity. Used parts, remanufactured parts, and recycled parts offer cost savings, while performance tuning and vehicle customization cater to niche markets. Maintenance schedules and parts availability are essential for ensuring vehicle safety and optimal performance.
Parts delivery, logistics, and sustainability are crucial elements of the supply chain. Digitalization, including parts finder tools, product testing, technical documentation, and parts education, enhances the customer experience. Parts compatibility, performance tuning, and vehicle customization cater to diverse consumer needs. Parts pricing, promotions, and return policies impact market dynamics, with warranty and innovation playing a role in maintaining customer loyalty. Product testing, quality control, and digitalization help to ensure the reliability and accuracy of parts data. The market's future growth will be influenced by these trends and the ability to effectively manage parts supply chain, inventory, and compliance.
Dive into Technavio's robust research methodology, blending expert interviews, extensive data synthesis, and validated models for unparalleled Aftermarket Automotive Parts And Components Market insights. See full methodology.
|
Market Scope |
|
|
Report Coverage |
Details |
|
Page number |
169 |
|
Base year |
2023 |
|
Historic period |
2018-2022 |
|
Forecast period |
2024-2028 |
|
Growth momentum & CAGR |
Accelerate at a CAGR of 3.2% |
|
Market growth 2024-2028 |
USD 80 billion |
|
Market structure |
Fragmented |
|
YoY growth 2023-2024(%) |
3.07 |
|
Key countries |
US, China, Germany, Canada, India, South Korea, France, Japan, Italy, Brazil, UAE, UK, Spain, and Mexico |
|
Competitive landscape |
Leading Companies, Market Positioning of Companies, Competitive Strategies, and Industry Risks |
What are the Key Data Covered in this Aftermarket Automotive Parts And Components Market Research and Growth Report?
- CAGR of the Aftermarket Automotive Parts And Components industry during the forecast period
- Detailed information on factors that will drive the growth and forecasting between 2024 and 2028
- Precise estimation of the size of the market and its contribution of the industry in focus to the parent market
- Accurate predictions about upcoming growth and trends and changes in consumer behaviour
- Growth of the market across APAC, North America, Europe, South America, and Middle East and Africa
- Thorough analysis of the market's competitive landscape and detailed information about companies
- Comprehensive analysis of factors that will challenge the aftermarket automotive parts and components market growth of industry companies
We can help! Our analysts can customize this aftermarket automotive parts and components market research report to meet your requirements.


