Agribusiness Market Size 2025-2029
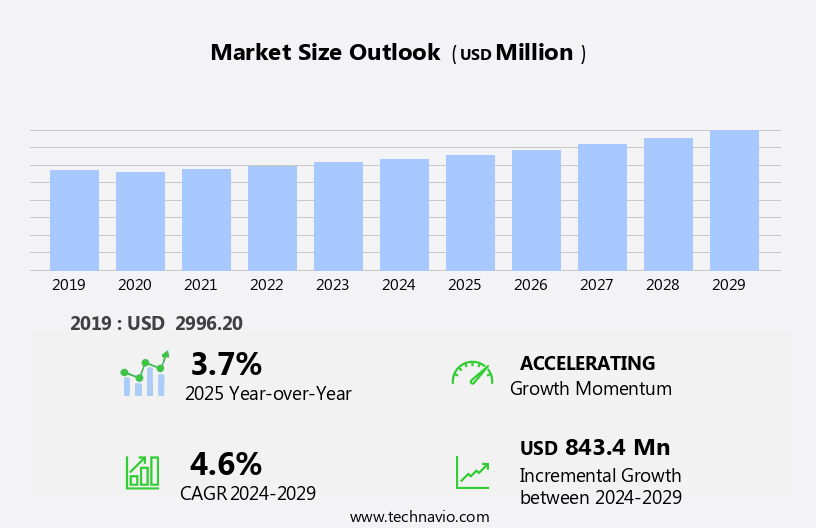
The agribusiness market size is forecast to increase by USD 843.4 million, at a CAGR of 4.6% between 2024 and 2029.
- The market is experiencing significant shifts driven by population growth, which is leading to an increased demand for food production. This trend is placing immense pressure on the industry to find innovative solutions to meet the rising demand, particularly in the context of a shrinking amount of arable land. One response to this challenge is the adoption of automation in agriculture, with technologies such as precision farming, drones, and robotics gaining traction. These solutions aim to optimize resource usage and increase efficiency, enabling farmers to produce more with less land. However, the implementation of automation also presents challenges, including high upfront costs and the need for significant investment in technology and infrastructure.
- Additionally, regulatory compliance and data security concerns add complexity to the adoption process. To capitalize on the market opportunities presented by population growth and the need for more efficient agriculture, companies must navigate these challenges and invest in technologies that can help them stay competitive while addressing the sustainability and productivity demands of the industry.
What will be the Size of the Agribusiness Market during the forecast period?

Explore in-depth regional segment analysis with market size data - historical 2019-2023 and forecasts 2025-2029 - in the full report.
Request Free Sample
The market continues to evolve, shaped by various dynamics that impact different sectors. Land use patterns are shifting, with an increasing focus on carbon sequestration and sustainable farming practices. Precision agriculture is revolutionizing yield optimization, while food processing and packaging technologies advance to ensure food safety and traceability. Seed production and agricultural biotechnology are driving innovation in crop production, and harvesting equipment is becoming more efficient and eco-friendly. Food security remains a critical concern, leading to the adoption of irrigation systems, biodiversity conservation, and sustainable farming practices. Livestock feed and breeding are undergoing transformations, with a focus on disease prevention and environmental sustainability.
Pest control methods are evolving, with a shift towards more natural and less harmful alternatives. Supply chain management is becoming more complex, with the integration of farm management software and crop rotation techniques. Water conservation is a priority, with new technologies and practices emerging to address this challenge. Agribusiness investment is on the rise, driven by market volatility and price fluctuations due to climate change adaptation and commodity trading. Direct marketing and consumer dietary trends are influencing food distribution, with a growing demand for locally sourced and organic produce. Vertical farming and agricultural finance are gaining traction, offering solutions to land tenure issues and providing access to capital for small-scale farmers.
The ongoing unfolding of these market activities and evolving patterns underscores the continuous nature of the agribusiness landscape.
How is this Agribusiness Industry segmented?
The agribusiness industry research report provides comprehensive data (region-wise segment analysis), with forecasts and estimates in "USD million" for the period 2025-2029, as well as historical data from 2019-2023 for the following segments.
- Product
- Grains and cereals
- Dairy
- Oilseeds
- Livestock
- Others
- Application
- Agrichemicals
- Seed business
- Breeding
- Machinery and equipment
- Technology
- Traditional agriculture
- Mechanized farming
- Precision agriculture and smart farming
- Organic and sustainable Farming
- Distribution Channel
- Retail chains and supermarkets
- Wholesale distribution
- Direct-to-consumer
- Food processing and manufacturing companies
- Farm Size
- Small-Scale Farms
- Medium-Scale Farms
- Large-Scale Farms
- Geography
- North America
- Europe
- Middle East and Africa
- APAC
- China
- India
- Japan
- South Korea
- South America
- Rest of World (ROW)
.
By Product Insights
The grains and cereals segment is estimated to witness significant growth during the forecast period.
The market encompasses various sectors, including grains and cereals, dairy production, land use, carbon sequestration, agricultural machinery, organic farming, yield optimization, food security, irrigation systems, biodiversity conservation, supply chain management, livestock feed, livestock breeding, pest control, poultry farming, government subsidies, farm management software, crop rotation, water conservation, sustainable farming practices, food distribution, vertical farming, agricultural finance, price fluctuations, climate change adaptation, market volatility, commodity trading, direct marketing, environmental sustainability, dietary trends, disease prevention, rural development, soil management, land tenure, precision agriculture, food processing, food packaging, seed production, agricultural biotechnology, harvesting equipment, food traceability, food safety, and agribusiness investment.
Grains and cereals, a significant portion of the market, consist of complex carbohydrates, fiber, and protein. These essential food sources are often fortified with various vitamins and minerals, making them a staple in many diets worldwide. The demand for grains and cereals remains high due to their nutritional value and role in food security. Dairy production contributes to the market, with the increasing global population leading to an increased demand for milk and dairy products. Sustainable farming practices, such as carbon sequestration and water conservation, are gaining popularity, driving the market's growth. The agricultural machinery sector continues to innovate, with precision agriculture and automation technologies improving yield optimization and reducing resource consumption.
Organic farming and biodiversity conservation are essential components of sustainable farming practices, ensuring long-term food security and environmental sustainability. Livestock breeding and feed production are crucial aspects of the market, with advancements in technology leading to improved animal health and welfare. Pest control and disease prevention are essential to maintaining crop yields and food safety, with research focusing on sustainable and environmentally friendly solutions. Government subsidies and farm management software support farmers in managing their land and operations efficiently, while crop rotation and soil management practices contribute to long-term sustainability. Food distribution and processing technologies ensure food safety and traceability, with vertical farming and hydroponics providing alternative solutions for food production in resource-limited areas.
Agribusiness investment and commodity trading play a significant role in market dynamics, with price fluctuations and climate change adaptation essential considerations for farmers and investors alike. Overall, the market continues to evolve, driven by advancements in technology, changing consumer preferences, and the need for sustainable and efficient food production.

Request Free Sample
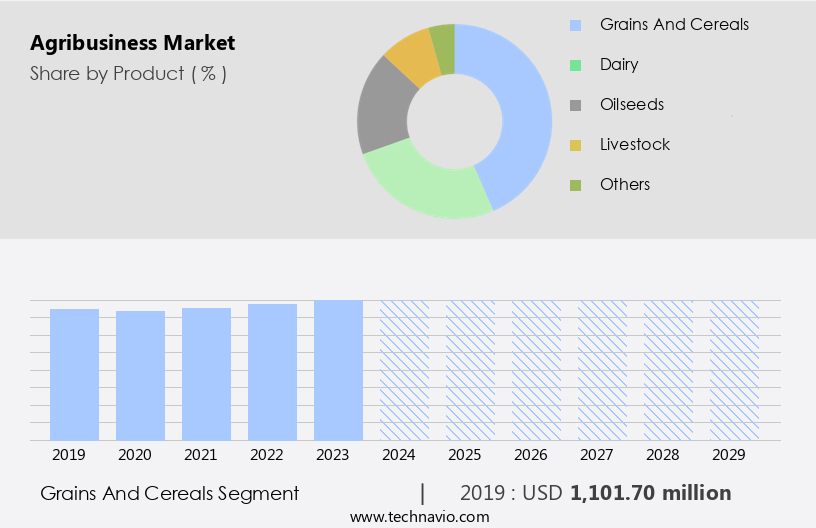
The Grains and cereals segment was valued at USD 1101.70 million in 2019 and showed a gradual increase during the forecast period.
Regional Analysis
APAC is estimated to contribute 49% to the growth of the global market during the forecast period.Technavio's analysts have elaborately explained the regional trends and drivers that shape the market during the forecast period.

Request Free Sample
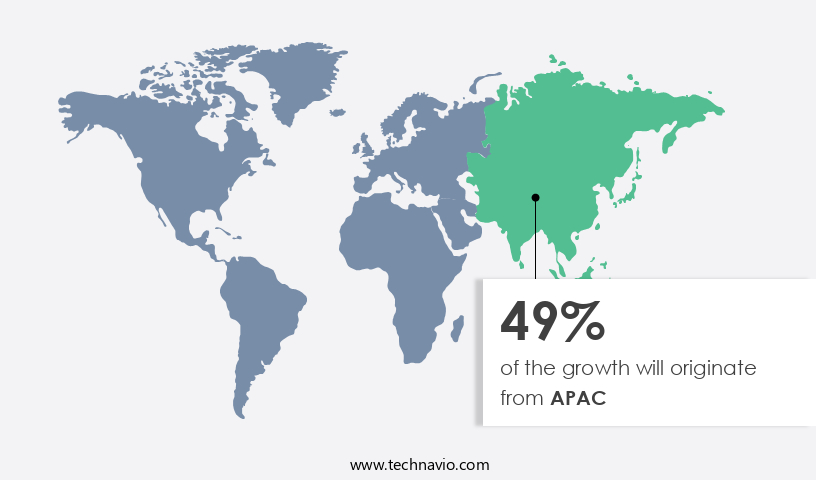
The market in Asia Pacific (APAC) is experiencing substantial growth in the global market, driven by several factors. The region's limited arable land necessitates the adoption of advanced farming practices and technological innovations, including agricultural machinery, precision agriculture, and farm management software. These advancements aim to optimize yield and improve sustainability through practices like crop rotation, water conservation, and biodiversity conservation. Moreover, the region's population growth, projected to reach approximately 4.44 billion by 2024, fuels the demand for food products. This surge in demand drives the need for livestock feed, livestock breeding, and poultry farming. To ensure food security, governments in APAC implement subsidies and policies that support farmers, enabling them to invest in irrigation systems, agricultural finance, and agricultural biotechnology.
Price fluctuations and market volatility due to climate change adaptation and commodity trading necessitate effective supply chain management. Direct marketing and food traceability systems are becoming increasingly important to maintain food safety and consumer trust. Additionally, environmental sustainability, disease prevention, and rural development are essential concerns for the agribusiness sector. Soil management and land tenure are critical aspects of sustainable farming practices, which are gaining popularity due to dietary trends and consumer preferences. Overall, the market in APAC is evolving to meet the demands of a growing population while ensuring food security, environmental sustainability, and economic growth.
Market Dynamics
Our researchers analyzed the data with 2024 as the base year, along with the key drivers, trends, and challenges. A holistic analysis of drivers will help companies refine their marketing strategies to gain a competitive advantage.
What are the key market drivers leading to the rise in the adoption of Agribusiness Industry?
- The primary factor fueling market growth is the escalating demand for food as a result of global population expansion.
- The market experiences constant growth due to the increasing worldwide population, which necessitates an expanded food supply. According to the United Nations Department of Economic and Social Affairs, the global population is projected to reach approximately 8.1 billion in 2024, with an anticipated increase to 8.5 billion by 2030. This population expansion significantly impacts the demand for agricultural products. The market dynamics are influenced by various factors, including price fluctuations, climate change adaptation, market volatility, commodity trading, direct marketing, environmental sustainability, dietary trends, disease prevention, rural development, and soil management. Price fluctuations can significantly impact farmers and food producers, necessitating the need for agricultural finance and risk management strategies.
- Climate change poses a significant challenge to the agribusiness sector, requiring adaptation strategies to ensure food security and productivity. Market volatility, driven by various factors such as weather conditions, political instability, and economic factors, can impact commodity prices and the overall market. Commodity trading plays a crucial role in the market, enabling price risk management and ensuring a stable supply of food products. Direct marketing, which allows farmers to sell their produce directly to consumers, can help mitigate the impact of market volatility and ensure better pricing for farmers. Environmental sustainability, dietary trends, and disease prevention are increasingly important considerations in the agribusiness sector.
- Consumers are increasingly conscious of the environmental impact of their food choices and are seeking out sustainable agricultural practices. Similarly, dietary trends, such as the growing demand for organic and non-GMO foods, are influencing the market. Rural development and soil management are essential components of a sustainable and productive agribusiness sector. Governments and international organizations are investing in rural development initiatives to improve infrastructure, access to markets, and support for small farmers. Soil management practices, such as sustainable farming methods and the use of fertilizers and pesticides, are crucial to maintaining productivity and ensuring long-term sustainability.
What are the market trends shaping the Agribusiness Industry?
- Automation is increasingly becoming a significant trend in the agriculture sector. This technological advancement offers numerous benefits, including increased efficiency, reduced labor costs, and improved crop yields.
- Agribusiness is undergoing a significant transformation through automation and advanced technologies. Automation streamlines agricultural production processes, from land preparation to harvesting, enabling real-time data capturing and remote monitoring of crop health. Precision agriculture, seed production, food processing, and food packaging industries benefit from this trend. Artificial Intelligence (AI) is a key driver, analyzing data from various sources to optimize yields and reduce production issues and supply chain inefficiencies. Agricultural biotechnology and harvesting equipment are also essential components, contributing to increased productivity, financial sustainability, and food safety.
- Food traceability and safety are crucial aspects of the agribusiness sector, and automation and technology enhance these areas through accurate record-keeping and real-time monitoring. Agribusiness investment continues to grow as these advancements improve the industry's efficiency and competitiveness.
What challenges does the Agribusiness Industry face during its growth?
- The decline in agricultural land usage represents a significant challenge to the industry's growth trajectory.
- Agribusiness is a critical sector that interlinks economic development and agriculture. The expansion of industries creates jobs but often requires agricultural land, leading to a decrease in land used for farming. This trend, exacerbated by urbanization, poses challenges to food security and agricultural productivity. However, there are opportunities for innovation in areas like agricultural machinery, irrigation systems, and organic farming to optimize yield and promote carbon sequestration and biodiversity conservation. Furthermore, agricultural insurance can help mitigate risks associated with crop failure and climate change. Effective supply chain management is crucial to ensure food security and maintain market stability.
- Key market drivers include population growth, increasing demand for organic and sustainable farming practices, and the potential for carbon credits from agricultural activities. In conclusion, addressing the challenges of land use and urbanization while embracing technological advancements and sustainable practices is essential for the continued growth and success of the agribusiness sector. Recent research emphasizes the importance of these factors in ensuring food security and promoting economic development.
Exclusive Customer Landscape
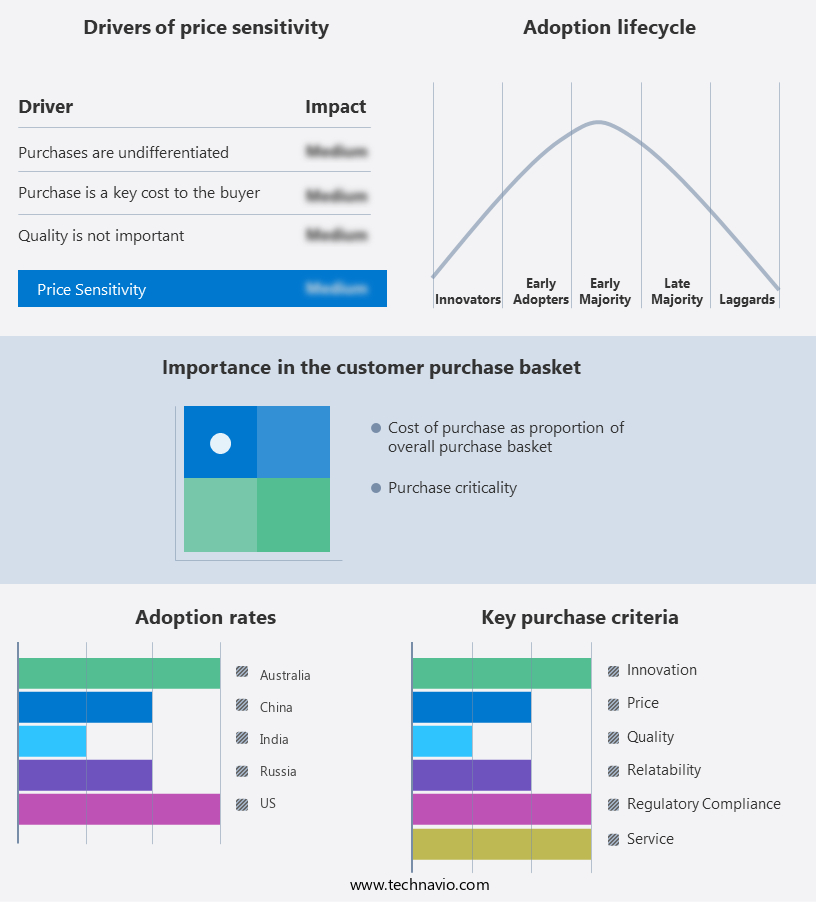
The agribusiness market forecasting report includes the adoption lifecycle of the market, covering from the innovator's stage to the laggard's stage. It focuses on adoption rates in different regions based on penetration. Furthermore, the agribusiness market report also includes key purchase criteria and drivers of price sensitivity to help companies evaluate and develop their market growth analysis strategies.

Customer Landscape
Key Companies & Market Insights
Companies are implementing various strategies, such as strategic alliances, agribusiness market forecast, partnerships, mergers and acquisitions, geographical expansion, and product/service launches, to enhance their presence in the industry.
Associated British Foods Plc - Agribusiness firm specializes in delivering farm performance services, animal feed solutions, and specialty ingredients to clients in the agricultural sector.
The industry research and growth report includes detailed analyses of the competitive landscape of the market and information about key companies, including:
- Associated British Foods Plc
- Bayer AG
- BrasilAgro
- Bunge Ltd.
- Cairo Poultry Co.
- Cargill Inc.
- Charoen Pokphand Foods PCL
- CHS Inc
- Dairy Farmers of America Inc.
- DuPont de Nemours Inc.
- Godrej Agrovet Ltd
- Indian Farmers Fertiliser Cooperative Ltd.
- Land O Lakes Inc.
- LT Foods
- Nestle SA
- Olam Group Ltd.
- Syngenta Crop Protection AG
- WH Group Ltd.
- Wilmar International Ltd.
Qualitative and quantitative analysis of companies has been conducted to help clients understand the wider business environment as well as the strengths and weaknesses of key industry players. Data is qualitatively analyzed to categorize companies as pure play, category-focused, industry-focused, and diversified; it is quantitatively analyzed to categorize companies as dominant, leading, strong, tentative, and weak.
Recent Development and News in Agribusiness Market
- In February 2024, Cargill, a leading global agribusiness company, announced the launch of its new plant-based protein production facility in North America. This strategic move is expected to significantly expand the company's presence in the growing alternative protein market, catering to the increasing consumer demand for sustainable and ethical food sources (Cargill Press Release, 2024).
- In May 2024, Syngenta and Microsoft Corporation entered into a strategic partnership to develop digital farming solutions. This collaboration aims to integrate Microsoft's Azure cloud platform with Syngenta's agronomic expertise, providing farmers with advanced data analytics and precision farming tools (Microsoft News Center, 2024).
- In October 2024, Bayer AG completed the acquisition of Advanced Agricultural Solutions (AAS), a leading U.S. Distributor of crop protection and seed solutions. This acquisition strengthens Bayer's position in the North American the market, expanding its reach and enhancing its product offerings (Bayer AG Press Release, 2024).
- In January 2025, the European Union approved the use of genetically modified organisms (GMOs) in animal feed, marking a significant policy change for the European agribusiness sector. This decision is expected to boost the production and adoption of GMO crops in Europe, addressing the growing demand for sustainable and efficient farming practices (European Commission Press Release, 2025).
Research Analyst Overview
- Agribusiness is a critical sector facing numerous challenges and opportunities. Water pollution, a significant concern, is being addressed through innovative solutions such as gene editing for drought-resistant crops and water management systems. Food innovation is driving the market with alternatives to traditional proteins and advancements in precision farming technologies. Furthermore, food waste reduction is a priority, with sustainable food systems and regenerative agriculture gaining traction. Climate change mitigation is essential, and climate-smart agriculture, carbon offsets, and livestock welfare are key areas of focus. Urban agriculture and biodiversity enhancement are emerging trends, while conservation agriculture and circular economy principles are essential for long-term resilience building.
- Agricultural robotics, including drones and autonomous farm vehicles, streamline operations and improve efficiency. Moreover, regenerative agriculture and climate-smart practices contribute to soil health monitoring and land degradation prevention. Gene editing and precision farming technologies enable farmers to optimize crop yields while reducing the use of synthetic fertilizers and pesticides. Water management solutions, such as irrigation systems and rainwater harvesting, are crucial for sustainable agriculture. Drone technology and autonomous farm vehicles enhance operational efficiency and reduce labor costs. In conclusion, the market is dynamic, with various trends and challenges shaping its future. Innovations in gene editing, food waste reduction, sustainable food systems, and climate change mitigation are crucial for long-term growth and success.
Dive into Technavio's robust research methodology, blending expert interviews, extensive data synthesis, and validated models for unparalleled Agribusiness Market insights. See full methodology.
Market Scope
|
Report Coverage
|
Details
|
Page number
|
237
|
Base year
|
2024
|
Historic period
|
2019-2023 |
Forecast period
|
2025-2029
|
Growth momentum & CAGR
|
Accelerate at a CAGR of 4.6%
|
Market growth 2025-2029
|
USD 843.4 million
|
Market structure
|
Fragmented
|
YoY growth 2024-2025(%)
|
3.7
|
Key countries
|
US, China, Japan, India, South Korea, Germany, UK, Brazil, Canada, France, Argentina, and UAE
|
Competitive landscape
|
Leading Companies, Market Positioning of Companies, Competitive Strategies, and Industry Risks
|
Request Free Sample
What are the Key Data Covered in this Agribusiness Market Research and Growth Report?
- CAGR of the Agribusiness industry during the forecast period
- Detailed information on factors that will drive the growth and forecasting between 2025 and 2029
- Precise estimation of the size of the market and its contribution of the industry in focus to the parent market
- Accurate predictions about upcoming growth and trends and changes in consumer behaviour
- Growth of the market across APAC, North America, Europe, South America, and Middle East and Africa
- Thorough analysis of the market's competitive landscape and detailed information about companies
- Comprehensive analysis of factors that will challenge the agribusiness market growth of industry companies
We can help! Our analysts can customize this agribusiness market research report to meet your requirements.
Get in touch
1 Executive Summary
- 1.1 Market overview
- Executive Summary - Chart on Market Overview
- Executive Summary - Data Table on Market Overview
- Executive Summary - Chart on Global Market Characteristics
- Executive Summary - Chart on Market by Geography
- Executive Summary - Chart on Market Segmentation by Product
- Executive Summary - Chart on Market Segmentation by Application
- Executive Summary - Chart on Market Segmentation by Technology
- Executive Summary - Chart on Market Segmentation by Distribution Channel
- Executive Summary - Chart on Incremental Growth
- Executive Summary - Data Table on Incremental Growth
- Executive Summary - Chart on Company Market Positioning
2 Technavio Analysis
- 2.1 Analysis of price sensitivity, lifecycle, customer purchase basket, adoption rates, and purchase criteria
- Analysis of price sensitivity, lifecycle, customer purchase basket, adoption rates, and purchase criteria
- 2.2 Criticality of inputs and Factors of differentiation
- Overview on criticality of inputs and factors of differentiation
- 2.3 Factors of disruption
- Overview on factors of disruption
- 2.4 Impact of drivers and challenges
- Impact of drivers and challenges in 2024 and 2029
3 Market Landscape
- 3.1 Market ecosystem
- Parent Market
- Data Table on - Parent Market
- 3.2 Market characteristics
- Market characteristics analysis
4 Market Sizing
- 4.1 Market definition
- Offerings of companies included in the market definition
- 4.2 Market segment analysis
- 4.4 Market outlook: Forecast for 2024-2029
- Chart on Global - Market size and forecast 2024-2029 ($ million)
- Data Table on Global - Market size and forecast 2024-2029 ($ million)
- Chart on Global Market: Year-over-year growth 2024-2029 (%)
- Data Table on Global Market: Year-over-year growth 2024-2029 (%)
5 Historic Market Size
- 5.1 Global Agribusiness Market 2019 - 2023
- Historic Market Size - Data Table on Global Agribusiness Market 2019 - 2023 ($ million)
- 5.2 Product segment analysis 2019 - 2023
- Historic Market Size - Product Segment 2019 - 2023 ($ million)
- 5.3 Application segment analysis 2019 - 2023
- Historic Market Size - Application Segment 2019 - 2023 ($ million)
- 5.4 Technology segment analysis 2019 - 2023
- Historic Market Size - Technology Segment 2019 - 2023 ($ million)
- 5.5 Distribution Channel segment analysis 2019 - 2023
- Historic Market Size - Distribution Channel Segment 2019 - 2023 ($ million)
- 5.6 Geography segment analysis 2019 - 2023
- Historic Market Size - Geography Segment 2019 - 2023 ($ million)
- 5.7 Country segment analysis 2019 - 2023
- Historic Market Size - Country Segment 2019 - 2023 ($ million)
6 Qualitative Analysis
- 6.1 Impact of AI on the global agribusiness market
7 Five Forces Analysis
- 7.1 Five forces summary
- Five forces analysis - Comparison between 2024 and 2029
- 7.2 Bargaining power of buyers
- Bargaining power of buyers - Impact of key factors 2024 and 2029
- 7.3 Bargaining power of suppliers
- Bargaining power of suppliers - Impact of key factors in 2024 and 2029
- 7.4 Threat of new entrants
- Threat of new entrants - Impact of key factors in 2024 and 2029
- 7.5 Threat of substitutes
- Threat of substitutes - Impact of key factors in 2024 and 2029
- 7.6 Threat of rivalry
- Threat of rivalry - Impact of key factors in 2024 and 2029
- 7.7 Market condition
- Chart on Market condition - Five forces 2024 and 2029
8 Market Segmentation by Product
- 8.1 Market segments
- Chart on Product - Market share (2024-2029) (%)
- Data Table on Product - Market share (2024-2029) (%)
- 8.2 Comparison by Product
- Chart on Comparison by Product
- Data Table on Comparison by Product
- 8.3 Grains and cereals - Market size and forecast (2024-2029)
- Chart on Grains and cereals - Market size and forecast (2024-2029) ($ million)
- Data Table on Grains and cereals - Market size and forecast (2024-2029) ($ million)
- Chart on Grains and cereals - Year-over-year growth (2024-2029) (%)
- Data Table on Grains and cereals - Year-over-year growth (2024-2029) (%)
- 8.4 Dairy - Market size and forecast (2024-2029)
- Chart on Dairy - Market size and forecast (2024-2029) ($ million)
- Data Table on Dairy - Market size and forecast (2024-2029) ($ million)
- Chart on Dairy - Year-over-year growth (2024-2029) (%)
- Data Table on Dairy - Year-over-year growth (2024-2029) (%)
- 8.5 Oilseeds - Market size and forecast (2024-2029)
- Chart on Oilseeds - Market size and forecast (2024-2029) ($ million)
- Data Table on Oilseeds - Market size and forecast (2024-2029) ($ million)
- Chart on Oilseeds - Year-over-year growth (2024-2029) (%)
- Data Table on Oilseeds - Year-over-year growth (2024-2029) (%)
- 8.6 Livestock - Market size and forecast (2024-2029)
- Chart on Livestock - Market size and forecast (2024-2029) ($ million)
- Data Table on Livestock - Market size and forecast (2024-2029) ($ million)
- Chart on Livestock - Year-over-year growth (2024-2029) (%)
- Data Table on Livestock - Year-over-year growth (2024-2029) (%)
- 8.7 Others - Market size and forecast (2024-2029)
- Chart on Others - Market size and forecast (2024-2029) ($ million)
- Data Table on Others - Market size and forecast (2024-2029) ($ million)
- Chart on Others - Year-over-year growth (2024-2029) (%)
- Data Table on Others - Year-over-year growth (2024-2029) (%)
- 8.8 Market opportunity by Product
- Market opportunity by Product ($ million)
- Data Table on Market opportunity by Product ($ million)
9 Market Segmentation by Application
- 9.1 Market segments
- Chart on Application - Market share (2024-2029) (%)
- Data Table on Application - Market share (2024-2029) (%)
- 9.2 Comparison by Application
- Chart on Comparison by Application
- Data Table on Comparison by Application
- 9.3 Agrichemicals - Market size and forecast (2024-2029)
- Chart on Agrichemicals - Market size and forecast (2024-2029) ($ million)
- Data Table on Agrichemicals - Market size and forecast (2024-2029) ($ million)
- Chart on Agrichemicals - Year-over-year growth (2024-2029) (%)
- Data Table on Agrichemicals - Year-over-year growth (2024-2029) (%)
- 9.4 Seed business - Market size and forecast (2024-2029)
- Chart on Seed business - Market size and forecast (2024-2029) ($ million)
- Data Table on Seed business - Market size and forecast (2024-2029) ($ million)
- Chart on Seed business - Year-over-year growth (2024-2029) (%)
- Data Table on Seed business - Year-over-year growth (2024-2029) (%)
- 9.5 Breeding - Market size and forecast (2024-2029)
- Chart on Breeding - Market size and forecast (2024-2029) ($ million)
- Data Table on Breeding - Market size and forecast (2024-2029) ($ million)
- Chart on Breeding - Year-over-year growth (2024-2029) (%)
- Data Table on Breeding - Year-over-year growth (2024-2029) (%)
- 9.6 Machinery and equipment - Market size and forecast (2024-2029)
- Chart on Machinery and equipment - Market size and forecast (2024-2029) ($ million)
- Data Table on Machinery and equipment - Market size and forecast (2024-2029) ($ million)
- Chart on Machinery and equipment - Year-over-year growth (2024-2029) (%)
- Data Table on Machinery and equipment - Year-over-year growth (2024-2029) (%)
- 9.7 Market opportunity by Application
- Market opportunity by Application ($ million)
- Data Table on Market opportunity by Application ($ million)
10 Market Segmentation by Technology
- 10.1 Market segments
- Chart on Technology - Market share (2024-2029) (%)
- Data Table on Technology - Market share (2024-2029) (%)
- 10.2 Comparison by Technology
- Chart on Comparison by Technology
- Data Table on Comparison by Technology
- 10.3 Traditional agriculture - Market size and forecast (2024-2029)
- Chart on Traditional agriculture - Market size and forecast (2024-2029) ($ million)
- Data Table on Traditional agriculture - Market size and forecast (2024-2029) ($ million)
- Chart on Traditional agriculture - Year-over-year growth (2024-2029) (%)
- Data Table on Traditional agriculture - Year-over-year growth (2024-2029) (%)
- 10.4 Mechanized farming - Market size and forecast (2024-2029)
- Chart on Mechanized farming - Market size and forecast (2024-2029) ($ million)
- Data Table on Mechanized farming - Market size and forecast (2024-2029) ($ million)
- Chart on Mechanized farming - Year-over-year growth (2024-2029) (%)
- Data Table on Mechanized farming - Year-over-year growth (2024-2029) (%)
- 10.5 Precision agriculture and smart farming - Market size and forecast (2024-2029)
- Chart on Precision agriculture and smart farming - Market size and forecast (2024-2029) ($ million)
- Data Table on Precision agriculture and smart farming - Market size and forecast (2024-2029) ($ million)
- Chart on Precision agriculture and smart farming - Year-over-year growth (2024-2029) (%)
- Data Table on Precision agriculture and smart farming - Year-over-year growth (2024-2029) (%)
- 10.6 Organic and sustainable Farming - Market size and forecast (2024-2029)
- Chart on Organic and sustainable Farming - Market size and forecast (2024-2029) ($ million)
- Data Table on Organic and sustainable Farming - Market size and forecast (2024-2029) ($ million)
- Chart on Organic and sustainable Farming - Year-over-year growth (2024-2029) (%)
- Data Table on Organic and sustainable Farming - Year-over-year growth (2024-2029) (%)
- 10.7 Market opportunity by Technology
- Market opportunity by Technology ($ million)
- Data Table on Market opportunity by Technology ($ million)
11 Market Segmentation by Distribution Channel
- 11.1 Market segments
- Chart on Distribution Channel - Market share (2024-2029) (%)
- Data Table on Distribution Channel - Market share (2024-2029) (%)
- 11.2 Comparison by Distribution Channel
- Chart on Comparison by Distribution Channel
- Data Table on Comparison by Distribution Channel
- 11.3 Retail chains and supermarkets - Market size and forecast (2024-2029)
- Chart on Retail chains and supermarkets - Market size and forecast (2024-2029) ($ million)
- Data Table on Retail chains and supermarkets - Market size and forecast (2024-2029) ($ million)
- Chart on Retail chains and supermarkets - Year-over-year growth (2024-2029) (%)
- Data Table on Retail chains and supermarkets - Year-over-year growth (2024-2029) (%)
- 11.4 Wholesale distribution - Market size and forecast (2024-2029)
- Chart on Wholesale distribution - Market size and forecast (2024-2029) ($ million)
- Data Table on Wholesale distribution - Market size and forecast (2024-2029) ($ million)
- Chart on Wholesale distribution - Year-over-year growth (2024-2029) (%)
- Data Table on Wholesale distribution - Year-over-year growth (2024-2029) (%)
- 11.5 Direct-to-consumer - Market size and forecast (2024-2029)
- Chart on Direct-to-consumer - Market size and forecast (2024-2029) ($ million)
- Data Table on Direct-to-consumer - Market size and forecast (2024-2029) ($ million)
- Chart on Direct-to-consumer - Year-over-year growth (2024-2029) (%)
- Data Table on Direct-to-consumer - Year-over-year growth (2024-2029) (%)
- 11.6 Food processing and manufacturing companies - Market size and forecast (2024-2029)
- Chart on Food processing and manufacturing companies - Market size and forecast (2024-2029) ($ million)
- Data Table on Food processing and manufacturing companies - Market size and forecast (2024-2029) ($ million)
- Chart on Food processing and manufacturing companies - Year-over-year growth (2024-2029) (%)
- Data Table on Food processing and manufacturing companies - Year-over-year growth (2024-2029) (%)
- 11.7 Market opportunity by Distribution Channel
- Market opportunity by Distribution Channel ($ million)
- Data Table on Market opportunity by Distribution Channel ($ million)
12 Market Segmentation by Farm Size
- 12.1 Market segments
- Chart on Farm Size - Market share (2024-2029) (%)
- Data Table on Farm Size - Market share (2024-2029) (%)
- 12.2 Comparison by Farm Size
- Chart on Comparison by Farm Size
- Data Table on Comparison by Farm Size
- 12.3 Small-Scale Farms - Market size and forecast (2024-2029)
- Chart on Small-Scale Farms - Market size and forecast (2024-2029) ($ million)
- Data Table on Small-Scale Farms - Market size and forecast (2024-2029) ($ million)
- Chart on Small-Scale Farms - Year-over-year growth (2024-2029) (%)
- Data Table on Small-Scale Farms - Year-over-year growth (2024-2029) (%)
- 12.4 Medium-Scale Farms - Market size and forecast (2024-2029)
- Chart on Medium-Scale Farms - Market size and forecast (2024-2029) ($ million)
- Data Table on Medium-Scale Farms - Market size and forecast (2024-2029) ($ million)
- Chart on Medium-Scale Farms - Year-over-year growth (2024-2029) (%)
- Data Table on Medium-Scale Farms - Year-over-year growth (2024-2029) (%)
- 12.5 Large-Scale Farms - Market size and forecast (2024-2029)
- Chart on Large-Scale Farms - Market size and forecast (2024-2029) ($ million)
- Data Table on Large-Scale Farms - Market size and forecast (2024-2029) ($ million)
- Chart on Large-Scale Farms - Year-over-year growth (2024-2029) (%)
- Data Table on Large-Scale Farms - Year-over-year growth (2024-2029) (%)
- 12.6 Market opportunity by Farm Size
- Market opportunity by Farm Size ($ million)
- Data Table on Market opportunity by Farm Size ($ million)
13 Customer Landscape
- 13.1 Customer landscape overview
- Analysis of price sensitivity, lifecycle, customer purchase basket, adoption rates, and purchase criteria
14 Geographic Landscape
- 14.1 Geographic segmentation
- Chart on Market share by geography 2024-2029 (%)
- Data Table on Market share by geography 2024-2029 (%)
- 14.2 Geographic comparison
- Chart on Geographic comparison
- Data Table on Geographic comparison
- 14.3 APAC - Market size and forecast 2024-2029
- Chart on APAC - Market size and forecast 2024-2029 ($ million)
- Data Table on APAC - Market size and forecast 2024-2029 ($ million)
- Chart on APAC - Year-over-year growth 2024-2029 (%)
- Data Table on APAC - Year-over-year growth 2024-2029 (%)
- 14.4 North America - Market size and forecast 2024-2029
- Chart on North America - Market size and forecast 2024-2029 ($ million)
- Data Table on North America - Market size and forecast 2024-2029 ($ million)
- Chart on North America - Year-over-year growth 2024-2029 (%)
- Data Table on North America - Year-over-year growth 2024-2029 (%)
- 14.5 Europe - Market size and forecast 2024-2029
- Chart on Europe - Market size and forecast 2024-2029 ($ million)
- Data Table on Europe - Market size and forecast 2024-2029 ($ million)
- Chart on Europe - Year-over-year growth 2024-2029 (%)
- Data Table on Europe - Year-over-year growth 2024-2029 (%)
- 14.6 South America - Market size and forecast 2024-2029
- Chart on South America - Market size and forecast 2024-2029 ($ million)
- Data Table on South America - Market size and forecast 2024-2029 ($ million)
- Chart on South America - Year-over-year growth 2024-2029 (%)
- Data Table on South America - Year-over-year growth 2024-2029 (%)
- 14.7 Middle East and Africa - Market size and forecast 2024-2029
- Chart on Middle East and Africa - Market size and forecast 2024-2029 ($ million)
- Data Table on Middle East and Africa - Market size and forecast 2024-2029 ($ million)
- Chart on Middle East and Africa - Year-over-year growth 2024-2029 (%)
- Data Table on Middle East and Africa - Year-over-year growth 2024-2029 (%)
- 14.8 US - Market size and forecast 2024-2029
- Chart on US - Market size and forecast 2024-2029 ($ million)
- Data Table on US - Market size and forecast 2024-2029 ($ million)
- Chart on US - Year-over-year growth 2024-2029 (%)
- Data Table on US - Year-over-year growth 2024-2029 (%)
- 14.9 China - Market size and forecast 2024-2029
- Chart on China - Market size and forecast 2024-2029 ($ million)
- Data Table on China - Market size and forecast 2024-2029 ($ million)
- Chart on China - Year-over-year growth 2024-2029 (%)
- Data Table on China - Year-over-year growth 2024-2029 (%)
- 14.10 Japan - Market size and forecast 2024-2029
- Chart on Japan - Market size and forecast 2024-2029 ($ million)
- Data Table on Japan - Market size and forecast 2024-2029 ($ million)
- Chart on Japan - Year-over-year growth 2024-2029 (%)
- Data Table on Japan - Year-over-year growth 2024-2029 (%)
- 14.11 India - Market size and forecast 2024-2029
- Chart on India - Market size and forecast 2024-2029 ($ million)
- Data Table on India - Market size and forecast 2024-2029 ($ million)
- Chart on India - Year-over-year growth 2024-2029 (%)
- Data Table on India - Year-over-year growth 2024-2029 (%)
- 14.12 South Korea - Market size and forecast 2024-2029
- Chart on South Korea - Market size and forecast 2024-2029 ($ million)
- Data Table on South Korea - Market size and forecast 2024-2029 ($ million)
- Chart on South Korea - Year-over-year growth 2024-2029 (%)
- Data Table on South Korea - Year-over-year growth 2024-2029 (%)
- 14.13 Germany - Market size and forecast 2024-2029
- Chart on Germany - Market size and forecast 2024-2029 ($ million)
- Data Table on Germany - Market size and forecast 2024-2029 ($ million)
- Chart on Germany - Year-over-year growth 2024-2029 (%)
- Data Table on Germany - Year-over-year growth 2024-2029 (%)
- 14.14 UK - Market size and forecast 2024-2029
- Chart on UK - Market size and forecast 2024-2029 ($ million)
- Data Table on UK - Market size and forecast 2024-2029 ($ million)
- Chart on UK - Year-over-year growth 2024-2029 (%)
- Data Table on UK - Year-over-year growth 2024-2029 (%)
- 14.15 Brazil - Market size and forecast 2024-2029
- Chart on Brazil - Market size and forecast 2024-2029 ($ million)
- Data Table on Brazil - Market size and forecast 2024-2029 ($ million)
- Chart on Brazil - Year-over-year growth 2024-2029 (%)
- Data Table on Brazil - Year-over-year growth 2024-2029 (%)
- 14.16 Canada - Market size and forecast 2024-2029
- Chart on Canada - Market size and forecast 2024-2029 ($ million)
- Data Table on Canada - Market size and forecast 2024-2029 ($ million)
- Chart on Canada - Year-over-year growth 2024-2029 (%)
- Data Table on Canada - Year-over-year growth 2024-2029 (%)
- 14.17 France - Market size and forecast 2024-2029
- Chart on France - Market size and forecast 2024-2029 ($ million)
- Data Table on France - Market size and forecast 2024-2029 ($ million)
- Chart on France - Year-over-year growth 2024-2029 (%)
- Data Table on France - Year-over-year growth 2024-2029 (%)
- 14.18 Market opportunity by geography
- Market opportunity by geography ($ million)
- Data Tables on Market opportunity by geography ($ million)
- 14.19 Argentina - Market size and forecast (2024-2029)
- Chart on Argentina - Market size and forecast (2024-2029) ($ million)
- Data Table on Argentina - Market size and forecast (2024-2029) ($ million)
- Chart on Argentina - Year-over-year growth (2024-2029) (%)
- Data Table on Argentina - Year-over-year growth (2024-2029) (%)
- 14.20 UAE - Market size and forecast (2024-2029)
- Chart on UAE - Market size and forecast (2024-2029) ($ million)
- Data Table on UAE - Market size and forecast (2024-2029) ($ million)
- Chart on UAE - Year-over-year growth (2024-2029) (%)
- Data Table on UAE - Year-over-year growth (2024-2029) (%)
- 14.21 Rest of World (ROW) - Market size and forecast (2024-2029)
- Chart on Rest of World (ROW) - Market size and forecast (2024-2029) ($ million)
- Data Table on Rest of World (ROW) - Market size and forecast (2024-2029) ($ million)
- Chart on Rest of World (ROW) - Year-over-year growth (2024-2029) (%)
- Data Table on Rest of World (ROW) - Year-over-year growth (2024-2029) (%)
15 Drivers, Challenges, and Opportunity/Restraints
- 15.3 Impact of drivers and challenges
- Impact of drivers and challenges in 2024 and 2029
- 15.4 Market opportunities/restraints
16 Competitive Landscape
- 16.2 Competitive Landscape
- Overview on criticality of inputs and factors of differentiation
- 16.3 Landscape disruption
- Overview on factors of disruption
- 16.4 Industry risks
- Impact of key risks on business
17 Competitive Analysis
- 17.2 Company ranking index
- 17.3 Market positioning of companies
- Matrix on companies position and classification
- 17.4 Associated British Foods Plc
- Associated British Foods Plc - Overview
- Associated British Foods Plc - Business segments
- Associated British Foods Plc - Key offerings
- Associated British Foods Plc - Segment focus
- SWOT
- 17.5 Bayer AG
- Bayer AG - Overview
- Bayer AG - Business segments
- Bayer AG - Key news
- Bayer AG - Key offerings
- Bayer AG - Segment focus
- SWOT
- 17.6 BrasilAgro
- BrasilAgro - Overview
- BrasilAgro - Product / Service
- BrasilAgro - Key offerings
- SWOT
- 17.7 Bunge Ltd.
- Bunge Ltd. - Overview
- Bunge Ltd. - Business segments
- Bunge Ltd. - Key news
- Bunge Ltd. - Key offerings
- Bunge Ltd. - Segment focus
- SWOT
- 17.8 Cairo Poultry Co.
- Cairo Poultry Co. - Overview
- Cairo Poultry Co. - Product / Service
- Cairo Poultry Co. - Key offerings
- SWOT
- 17.9 Cargill Inc.
- Cargill Inc. - Overview
- Cargill Inc. - Product / Service
- Cargill Inc. - Key offerings
- SWOT
- 17.10 CHS Inc
- CHS Inc - Overview
- CHS Inc - Business segments
- CHS Inc - Key offerings
- CHS Inc - Segment focus
- SWOT
- 17.11 Dairy Farmers of America Inc.
- Dairy Farmers of America Inc. - Overview
- Dairy Farmers of America Inc. - Product / Service
- Dairy Farmers of America Inc. - Key offerings
- SWOT
- 17.12 DuPont de Nemours Inc.
- DuPont de Nemours Inc. - Overview
- DuPont de Nemours Inc. - Business segments
- DuPont de Nemours Inc. - Key news
- DuPont de Nemours Inc. - Key offerings
- DuPont de Nemours Inc. - Segment focus
- SWOT
- 17.13 Land O Lakes Inc.
- Land O Lakes Inc. - Overview
- Land O Lakes Inc. - Product / Service
- Land O Lakes Inc. - Key offerings
- SWOT
- 17.14 LT Foods
- LT Foods - Overview
- LT Foods - Product / Service
- LT Foods - Key offerings
- SWOT
- 17.15 Nestle SA
- Nestle SA - Overview
- Nestle SA - Business segments
- Nestle SA - Key news
- Nestle SA - Key offerings
- Nestle SA - Segment focus
- SWOT
- 17.16 Syngenta Crop Protection AG
- Syngenta Crop Protection AG - Overview
- Syngenta Crop Protection AG - Product / Service
- Syngenta Crop Protection AG - Key offerings
- SWOT
- 17.17 WH Group Ltd.
- WH Group Ltd. - Overview
- WH Group Ltd. - Business segments
- WH Group Ltd. - Key news
- WH Group Ltd. - Key offerings
- WH Group Ltd. - Segment focus
- SWOT
- 17.18 Wilmar International Ltd.
- Wilmar International Ltd. - Overview
- Wilmar International Ltd. - Business segments
- Wilmar International Ltd. - Key offerings
- Wilmar International Ltd. - Segment focus
- SWOT
18 Appendix
- 18.2 Inclusions and exclusions checklist
- Inclusions checklist
- Exclusions checklist
- 18.3 Currency conversion rates for US$
- Currency conversion rates for US$
- 18.4 Research methodology
- 18.7 Validation techniques employed for market sizing
- Validation techniques employed for market sizing
- 18.9 360 degree market analysis
- 360 degree market analysis
- 18.10 List of abbreviations