Agricultural Drones Market Size 2025-2029
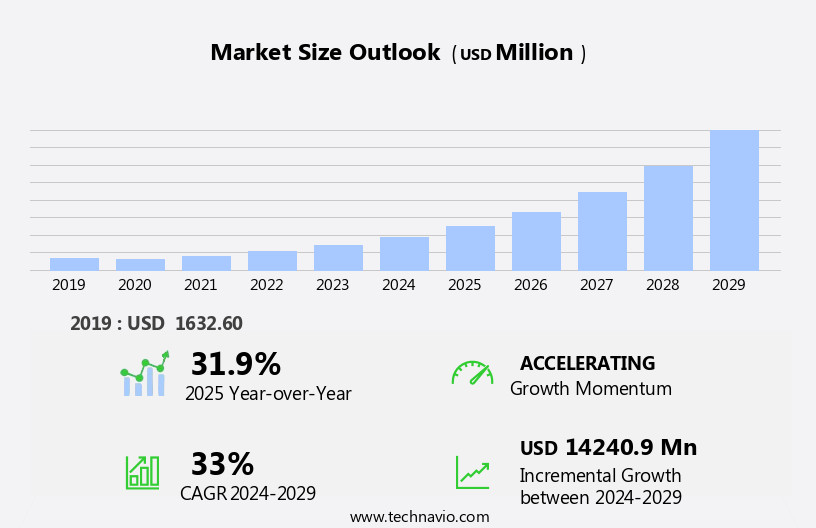
The agricultural drones market size is forecast to increase by USD 14.24 billion at a CAGR of 33% between 2024 and 2029.
- The market is experiencing significant growth, driven by increased funding for UAV manufacturers and the introduction of new agricultural drone models. These innovations offer farmers improved precision in crop monitoring, irrigation management, and yield estimation. However, the market faces challenges, including regulatory restrictions and concerns regarding data privacy and security. This targeted application leads to environmental benefits, including reduced use of agrochemicals and improved resource management. As the industry evolves, companies must navigate these challenges while capitalizing on opportunities for cost savings, increased efficiency, and enhanced agricultural productivity. Strategic partnerships, technological advancements, and a focus on customer needs will be essential for market success. The future of agricultural drones lies In their ability to provide actionable insights and drive sustainable farming practices, making this an exciting and dynamic market for investors and industry players alike.
What will be the Size of the Agricultural Drones Market during the forecast period?

Request Free Sample
- The market is experiencing significant growth due to the increasing adoption of precision agriculture techniques to optimize crop yields and reduce costs. Drones equipped with advanced cameras, sensors, and navigation systems enable farmers to monitor crops in real-time, identify issues, and apply fertilizers, pesticides, and water more precisely and efficiently. The market encompasses both fixed wing and rotary wing drones, each offering unique advantages for various agricultural applications. Flight control systems and propulsion technologies facilitate seamless drone operation. Furthermore, professional and managed services provide farmers with expert assistance in drone acquisition, training, and implementation.
- Data analytics plays a crucial role In the market, as the collected data is used to inform decision-making processes and enhance overall farm productivity. The market's continued expansion is driven by the potential for substantial cost savings, increased efficiency, and the ability to address evolving agricultural challenges.
How is this Agricultural Drones Industry segmented?
The agricultural drones industry research report provides comprehensive data (region-wise segment analysis), with forecasts and estimates in "USD billion" for the period 2025-2029, as well as historical data from 2019-2023 for the following segments.
- Component
- Hardware
- Software
- Services
- Product
- Multi-rotor
- Fixed-wing
- Hybrid
- Deployment
- Application
- Crop management
- Field mapping
- Crop spraying
- Variable rate application
- Livestock monitoring
- Geography
- North America
- Europe
- APAC
- South America
- Middle East and Africa
By Component Insights
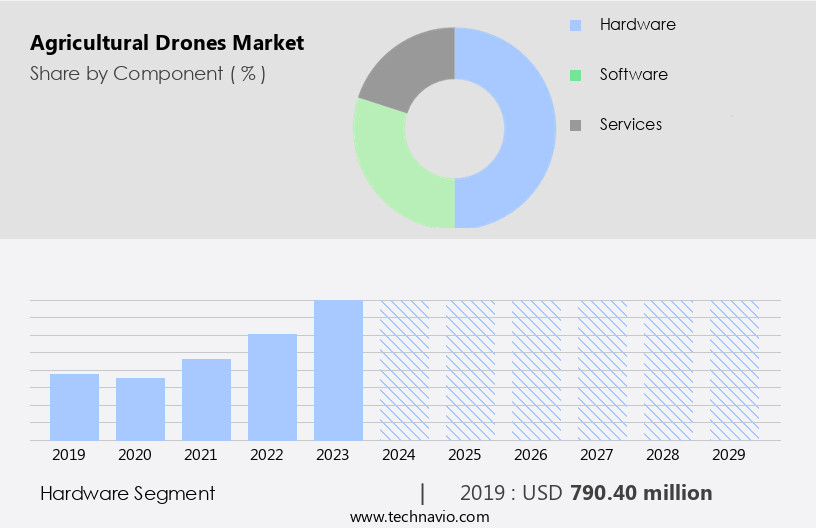
The hardware segment is estimated to witness significant growth during the forecast period. The market encompasses the sales of hardware components, including cameras, sprayers, radio receivers, motors, batteries, sensors, and crop scouting equipment, for customized drone usage in agriculture applications. The demand for advanced hardware components is escalating due to the increasing need to build and fly UAVs for precision agriculture, optimized crop yields, cost savings, and environmental benefits. Companies such as SZ DJI Technology Co. Ltd., Parrot Drones, and AgEagle Aerial Systems provide hardware components for customized drone solutions. DJI, a leading player, offers a range of hardware components, including flight control systems, navigation systems, and propulsion systems, to enhance drone functionality.

Get a glance at the market report of share of various segments Request Free Sample
The hardware segment was valued at USD 790.40 million in 2019 and showed a gradual increase during the forecast period.
Regional Analysis
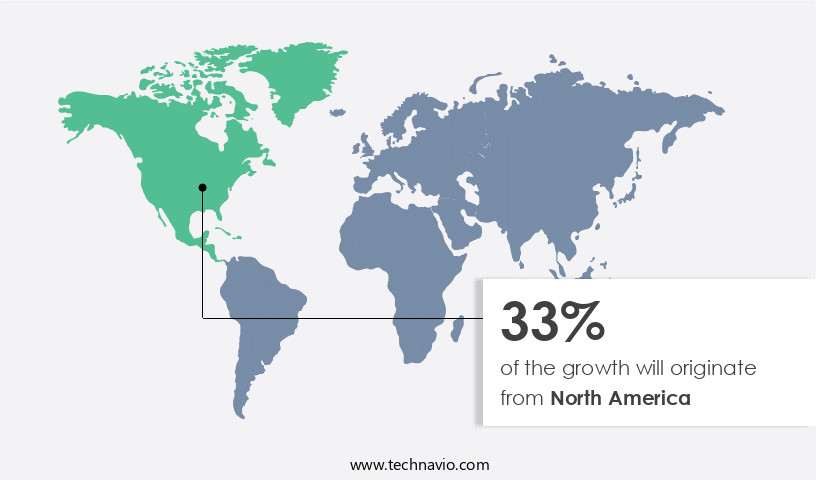
North America is estimated to contribute 33% to the growth of the global market during the forecast period. Technavio's analysts have elaborately explained the regional trends and drivers that shape the market during the forecast period.

For more insights on the market size of various regions, Request Free Sample
The market in the region is experiencing significant growth due to the increasing adoption of precision agriculture for optimized crop yields and cost savings. Agricultural drones are increasingly used for crop monitoring, spraying fertilizers and pesticides, and field mapping, providing real-time data for targeted application and resource allocation. These drones are equipped with advanced features such as flight control systems, navigation systems, and professional services for managed farming operations in both indoor and outdoor environments. The environmental benefits of drone technology, including reduced water usage and improved nutrient efficiency, further contribute to the market's growth.
Market Dynamics
Our researchers analyzed the data with 2024 as the base year, along with the key drivers, trends, and challenges. A holistic analysis of drivers will help companies refine their marketing strategies to gain a competitive advantage.
What are the key market drivers leading to the rise In the adoption of Agricultural Drones Industry?
- Rise in funding for UAV manufacturers is the key driver of the market. The market is experiencing notable expansion due to increased funding for UAV manufacturers. This financial influx permits innovations in drone technology, specifically for agricultural applications, such as precision farming, crop monitoring, and irrigation management. These advancements boost drone efficiency, dependability, and accessibility for farmers, enabling them to assess crop health, optimize resource utilization, and augment yields.
- Furthermore, governments and private investors acknowledge the transformative potential of UAVs in agriculture, offering financial assistance and incentives to fuel progress.The competition among manufacturers, fueled by this investment, results in cost reductions and enhanced features in agricultural drones.
What are the market trends shaping the Agricultural Drones Industry?
- Introduction of new agricultural drones is the upcoming market trend. The market is witnessing significant advancements as major players introduce innovative products to gain a competitive edge. For instance, in November 2023, DJI, a prominent market participant, launched the T60 agriculture drone, featuring a virtual pan-tilt-zoom capability, suitable for farmland spraying and aerial seeding. Similarly, in December 2023, XAG Co Ltd, a significant Chinese agricultural drone manufacturer, introduced the P150 and P60 drones.
- The P150 model offers functions such as spraying, sowing, transportation, and aerial surveying, with a maximum payload of 70 kilograms and a spraying flow rate of 30 liters per minute. These developments underscore the dynamic nature of the market.
What challenges does the Agricultural Drones Industry face during its growth?
- Concerns regarding use of agricultural drones is a key challenge affecting the industry growth. Agricultural drones have gained significant attention due to their potential benefits in farming operations. However, privacy concerns remain a notable challenge. Drones can record audio and video, raising issues about personal freedom and property rights.
- Furthermore, there are allegations that drones might be used for spying purposes by various entities. In response, regulatory bodies have implemented measures to address these concerns. For instance, in India, the Directorate General of Civil Aviation (DGCA) mandates registration of all drones, except for nano drones and non-commercial drones under specific weight thresholds, on the Digital Sky platform. This registration ensures compliance with safety and privacy standards. The DGCA has also introduced stricter guidelines to enhance the security of drone operations and mitigate privacy concerns.
Exclusive Customer Landscape
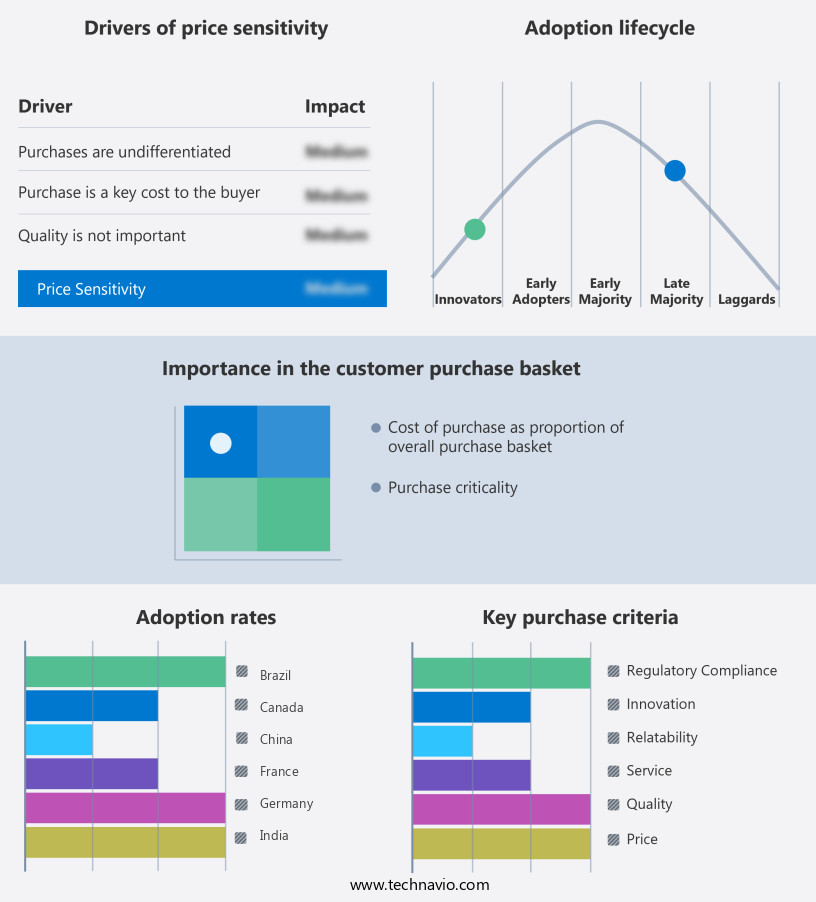
The agricultural drones market forecasting report includes the adoption lifecycle of the market, covering from the innovator's stage to the laggard's stage. It focuses on adoption rates in different regions based on penetration. Furthermore, the agricultural drones market report also includes key purchase criteria and drivers of price sensitivity to help companies evaluate and develop their market growth analysis strategies.

Customer Landscape
Key Companies & Market Insights
Companies are implementing various strategies, such as strategic alliances, agricultural drones market forecast, partnerships, mergers and acquisitions, geographical expansion, and product/service launches, to enhance their presence In the industry.
Aeronavics - The company offers agricultural drones such as Aeronavics Navi mapping and planning drone that can take payload of upto 2 kg, fly for 30 minutes and reaches speed of 100 km per hour.
The industry research and growth report includes detailed analyses of the competitive landscape of the market and information about key companies, including:
- AeroVironment Inc.
- AgEagle Aerial Systems Inc.
- DELAIR SAS
- Drone Volt SA
- FlyGuys
- Harris Aerial
- ideaForge Technologies Pvt. Ltd.
- Kray Technologies
- Nextech
- Parrot Drones SAS
- Sentera Inc.
- Shenzhen GC electronics Co. Ltd.
- Skyfront
- SZ DJI Technology Co. Ltd.
- Vision Aerial Inc.
Qualitative and quantitative analysis of companies has been conducted to help clients understand the wider business environment as well as the strengths and weaknesses of key industry players. Data is qualitatively analyzed to categorize companies as pure play, category-focused, industry-focused, and diversified; it is quantitatively analyzed to categorize companies as dominant, leading, strong, tentative, and weak.
Research Analyst Overview
The agricultural drones market is experiencing significant growth as farmers seek to optimize crop yields and reduce costs through advanced aerial technology. Drones offer numerous benefits for agricultural operations, including real-time data collection, environmental sustainability, and targeted application of fertilizers and pesticides. One of the primary applications of agricultural drones is crop monitoring. These unmanned aerial vehicles (UAVs) equipped with high-resolution cameras and sensors can capture detailed images of crops, allowing farmers to identify nutrient deficiencies, pest infestations, and other issues that may impact yield. By addressing these issues in a timely manner, farmers can minimize losses and maximize their returns.
Another key benefit of agricultural drones is cost savings. Traditional methods of crop monitoring, such as manual inspections or satellite imagery, can be time-consuming and expensive. Drones offer a more cost-effective solution, enabling farmers to survey large areas quickly and efficiently. Additionally, drones can help farmers save on inputs such as fertilizers and pesticides by allowing for targeted application based on real-time data. Environmental benefits are also a significant driver of the agricultural drone market. Drones can help farmers reduce their environmental footprint by providing precise data on crop health and resource allocation. By optimizing the use of fertilizers and water, farmers can minimize waste and reduce the amount of chemicals that leach into the soil and water supply.
Furthermore, the agricultural drone market is diverse, with applications ranging from indoor farming to vertical farming and greenhouse operations. Fixed wing drones are particularly well-suited for large-scale outdoor farming operations due to their long flight times and ability to cover large areas quickly. These drones are equipped with advanced flight control systems and navigation systems, enabling them to fly autonomously and collect high-resolution data. Professional services and managed services are also becoming increasingly important In the agricultural drone market. As the technology becomes more complex, farmers are turning to experts for help with drone selection, training, and maintenance.
In addition, these services can help farmers maximize the value of their investment in drone technology and ensure that they are getting the most accurate and actionable data possible. Drones offer a range of benefits, including real-time data collection, targeted application of inputs, and environmental sustainability. The market is diverse, with applications ranging from indoor farming to large-scale outdoor farming operations, and professional services and managed services are becoming increasingly important to help farmers get the most value from their investment in drone technology.
Market Scope
|
Report Coverage
|
Details
|
Page number
|
238
|
Base year
|
2024
|
Historic period
|
2019-2023 |
Forecast period
|
2025-2029
|
Growth momentum & CAGR
|
Accelerate at a CAGR of 33%
|
Market growth 2025-2029
|
USD 14.24 billion
|
Market structure
|
Fragmented
|
YoY growth 2024-2025(%)
|
31.9
|
Key countries
|
US, Canada, UK, Germany, China, Italy, Brazil, France, Japan, and India
|
Competitive landscape
|
Leading Companies, market growth and forecasting, Market Positioning of Companies, Competitive Strategies, and Industry Risks
|
Request Free Sample
What are the Key Data Covered in this Agricultural Drones Market Research and Growth Report?
- CAGR of the Agricultural Drones industry during the forecast period
- Detailed information on factors that will drive the growth and forecasting between 2025 and 2029
- Precise estimation of the size of the market and its contribution of the industry in focus to the parent market
- Accurate predictions about upcoming growth and trends and changes in consumer behaviour
- Growth of the market across North America, Europe, APAC, South America, and Middle East and Africa
- Thorough analysis of the market's competitive landscape and detailed information about companies
- Comprehensive analysis of factors that will challenge the agricultural drones market growth of industry companies
We can help! Our analysts can customize this agricultural drones market research report to meet your requirements.
Get in touch
1 Executive Summary
- 1.1 Market overview
- Executive Summary - Chart on Market Overview
- Executive Summary - Data Table on Market Overview
- Executive Summary - Chart on Global Market Characteristics
- Executive Summary - Chart on Market by Geography
- Executive Summary - Chart on Market Segmentation by Component
- Executive Summary - Chart on Market Segmentation by Product
- Executive Summary - Chart on Market Segmentation by Deployment
- Executive Summary - Chart on Market Segmentation by Application
- Executive Summary - Chart on Incremental Growth
- Executive Summary - Data Table on Incremental Growth
- Executive Summary - Chart on Company Market Positioning
2 Technavio Analysis
- 2.1 Analysis of price sensitivity, lifecycle, customer purchase basket, adoption rates, and purchase criteria
- Analysis of price sensitivity, lifecycle, customer purchase basket, adoption rates, and purchase criteria
- 2.2 Criticality of inputs and Factors of differentiation
- Overview on criticality of inputs and factors of differentiation
- 2.3 Factors of disruption
- Overview on factors of disruption
- 2.4 Impact of drivers and challenges
- Impact of drivers and challenges in 2024 and 2029
3 Market Landscape
- 3.1 Market ecosystem
- Parent Market
- Data Table on - Parent Market
- 3.2 Market characteristics
- Market characteristics analysis
4 Market Sizing
- 4.1 Market definition
- Offerings of companies included in the market definition
- 4.2 Market segment analysis
- 4.4 Market outlook: Forecast for 2024-2029
- Chart on Global - Market size and forecast 2024-2029 ($ million)
- Data Table on Global - Market size and forecast 2024-2029 ($ million)
- Chart on Global Market: Year-over-year growth 2024-2029 (%)
- Data Table on Global Market: Year-over-year growth 2024-2029 (%)
5 Historic Market Size
- 5.1 Global Agricultural Drones Market 2019 - 2023
- Historic Market Size - Data Table on Global Agricultural Drones Market 2019 - 2023 ($ million)
- 5.2 Component segment analysis 2019 - 2023
- Historic Market Size - Component Segment 2019 - 2023 ($ million)
- 5.3 Product segment analysis 2019 - 2023
- Historic Market Size - Product Segment 2019 - 2023 ($ million)
- 5.4 Deployment segment analysis 2019 - 2023
- Historic Market Size - Deployment Segment 2019 - 2023 ($ million)
- 5.5 Application segment analysis 2019 - 2023
- Historic Market Size - Application Segment 2019 - 2023 ($ million)
- 5.6 Geography segment analysis 2019 - 2023
- Historic Market Size - Geography Segment 2019 - 2023 ($ million)
- 5.7 Country segment analysis 2019 - 2023
- Historic Market Size - Country Segment 2019 - 2023 ($ million)
6 Qualitative Analysis
- 6.1 The AI impact on Global Agricultural Drones Market
7 Five Forces Analysis
- 7.1 Five forces summary
- Five forces analysis - Comparison between 2024 and 2029
- 7.2 Bargaining power of buyers
- Bargaining power of buyers - Impact of key factors 2024 and 2029
- 7.3 Bargaining power of suppliers
- Bargaining power of suppliers - Impact of key factors in 2024 and 2029
- 7.4 Threat of new entrants
- Threat of new entrants - Impact of key factors in 2024 and 2029
- 7.5 Threat of substitutes
- Threat of substitutes - Impact of key factors in 2024 and 2029
- 7.6 Threat of rivalry
- Threat of rivalry - Impact of key factors in 2024 and 2029
- 7.7 Market condition
- Chart on Market condition - Five forces 2024 and 2029
8 Market Segmentation by Component
- 8.1 Market segments
- Chart on Component - Market share 2024-2029 (%)
- Data Table on Component - Market share 2024-2029 (%)
- 8.2 Comparison by Component
- Chart on Comparison by Component
- Data Table on Comparison by Component
- 8.3 Hardware - Market size and forecast 2024-2029
- Chart on Hardware - Market size and forecast 2024-2029 ($ million)
- Data Table on Hardware - Market size and forecast 2024-2029 ($ million)
- Chart on Hardware - Year-over-year growth 2024-2029 (%)
- Data Table on Hardware - Year-over-year growth 2024-2029 (%)
- 8.4 Software - Market size and forecast 2024-2029
- Chart on Software - Market size and forecast 2024-2029 ($ million)
- Data Table on Software - Market size and forecast 2024-2029 ($ million)
- Chart on Software - Year-over-year growth 2024-2029 (%)
- Data Table on Software - Year-over-year growth 2024-2029 (%)
- 8.5 Services - Market size and forecast 2024-2029
- Chart on Services - Market size and forecast 2024-2029 ($ million)
- Data Table on Services - Market size and forecast 2024-2029 ($ million)
- Chart on Services - Year-over-year growth 2024-2029 (%)
- Data Table on Services - Year-over-year growth 2024-2029 (%)
- 8.6 Market opportunity by Component
- Market opportunity by Component ($ million)
- Data Table on Market opportunity by Component ($ million)
9 Market Segmentation by Product
- 9.1 Market segments
- Chart on Product - Market share 2024-2029 (%)
- Data Table on Product - Market share 2024-2029 (%)
- 9.2 Comparison by Product
- Chart on Comparison by Product
- Data Table on Comparison by Product
- 9.3 Multi-rotor - Market size and forecast 2024-2029
- Chart on Multi-rotor - Market size and forecast 2024-2029 ($ million)
- Data Table on Multi-rotor - Market size and forecast 2024-2029 ($ million)
- Chart on Multi-rotor - Year-over-year growth 2024-2029 (%)
- Data Table on Multi-rotor - Year-over-year growth 2024-2029 (%)
- 9.4 Fixed-wing - Market size and forecast 2024-2029
- Chart on Fixed-wing - Market size and forecast 2024-2029 ($ million)
- Data Table on Fixed-wing - Market size and forecast 2024-2029 ($ million)
- Chart on Fixed-wing - Year-over-year growth 2024-2029 (%)
- Data Table on Fixed-wing - Year-over-year growth 2024-2029 (%)
- 9.5 Hybrid - Market size and forecast 2024-2029
- Chart on Hybrid - Market size and forecast 2024-2029 ($ million)
- Data Table on Hybrid - Market size and forecast 2024-2029 ($ million)
- Chart on Hybrid - Year-over-year growth 2024-2029 (%)
- Data Table on Hybrid - Year-over-year growth 2024-2029 (%)
- 9.6 Market opportunity by Product
- Market opportunity by Product ($ million)
- Data Table on Market opportunity by Product ($ million)
10 Market Segmentation by Deployment
- 10.1 Market segments
- Chart on Deployment - Market share 2024-2029 (%)
- Data Table on Deployment - Market share 2024-2029 (%)
- 10.2 Comparison by Deployment
- Chart on Comparison by Deployment
- Data Table on Comparison by Deployment
- 10.3 Outdoor - Market size and forecast 2024-2029
- Chart on Outdoor - Market size and forecast 2024-2029 ($ million)
- Data Table on Outdoor - Market size and forecast 2024-2029 ($ million)
- Chart on Outdoor - Year-over-year growth 2024-2029 (%)
- Data Table on Outdoor - Year-over-year growth 2024-2029 (%)
- 10.4 Indoor - Market size and forecast 2024-2029
- Chart on Indoor - Market size and forecast 2024-2029 ($ million)
- Data Table on Indoor - Market size and forecast 2024-2029 ($ million)
- Chart on Indoor - Year-over-year growth 2024-2029 (%)
- Data Table on Indoor - Year-over-year growth 2024-2029 (%)
- 10.5 Market opportunity by Deployment
- Market opportunity by Deployment ($ million)
- Data Table on Market opportunity by Deployment ($ million)
11 Market Segmentation by Application
- 11.1 Market segments
- Chart on Application - Market share 2024-2029 (%)
- Data Table on Application - Market share 2024-2029 (%)
- 11.2 Comparison by Application
- Chart on Comparison by Application
- Data Table on Comparison by Application
- 11.3 Crop management - Market size and forecast 2024-2029
- Chart on Crop management - Market size and forecast 2024-2029 ($ million)
- Data Table on Crop management - Market size and forecast 2024-2029 ($ million)
- Chart on Crop management - Year-over-year growth 2024-2029 (%)
- Data Table on Crop management - Year-over-year growth 2024-2029 (%)
- 11.4 Field mapping - Market size and forecast 2024-2029
- Chart on Field mapping - Market size and forecast 2024-2029 ($ million)
- Data Table on Field mapping - Market size and forecast 2024-2029 ($ million)
- Chart on Field mapping - Year-over-year growth 2024-2029 (%)
- Data Table on Field mapping - Year-over-year growth 2024-2029 (%)
- 11.5 Crop spraying - Market size and forecast 2024-2029
- Chart on Crop spraying - Market size and forecast 2024-2029 ($ million)
- Data Table on Crop spraying - Market size and forecast 2024-2029 ($ million)
- Chart on Crop spraying - Year-over-year growth 2024-2029 (%)
- Data Table on Crop spraying - Year-over-year growth 2024-2029 (%)
- 11.6 Variable rate application - Market size and forecast 2024-2029
- Chart on Variable rate application - Market size and forecast 2024-2029 ($ million)
- Data Table on Variable rate application - Market size and forecast 2024-2029 ($ million)
- Chart on Variable rate application - Year-over-year growth 2024-2029 (%)
- Data Table on Variable rate application - Year-over-year growth 2024-2029 (%)
- 11.7 Livestock monitoring - Market size and forecast 2024-2029
- Chart on Livestock monitoring - Market size and forecast 2024-2029 ($ million)
- Data Table on Livestock monitoring - Market size and forecast 2024-2029 ($ million)
- Chart on Livestock monitoring - Year-over-year growth 2024-2029 (%)
- Data Table on Livestock monitoring - Year-over-year growth 2024-2029 (%)
- 11.8 Market opportunity by Application
- Market opportunity by Application ($ million)
- Data Table on Market opportunity by Application ($ million)
12 Customer Landscape
- 12.1 Customer landscape overview
- Analysis of price sensitivity, lifecycle, customer purchase basket, adoption rates, and purchase criteria
13 Geographic Landscape
- 13.1 Geographic segmentation
- Chart on Market share by geography 2024-2029 (%)
- Data Table on Market share by geography 2024-2029 (%)
- 13.2 Geographic comparison
- Chart on Geographic comparison
- Data Table on Geographic comparison
- 13.3 North America - Market size and forecast 2024-2029
- Chart on North America - Market size and forecast 2024-2029 ($ million)
- Data Table on North America - Market size and forecast 2024-2029 ($ million)
- Chart on North America - Year-over-year growth 2024-2029 (%)
- Data Table on North America - Year-over-year growth 2024-2029 (%)
- 13.4 Europe - Market size and forecast 2024-2029
- Chart on Europe - Market size and forecast 2024-2029 ($ million)
- Data Table on Europe - Market size and forecast 2024-2029 ($ million)
- Chart on Europe - Year-over-year growth 2024-2029 (%)
- Data Table on Europe - Year-over-year growth 2024-2029 (%)
- 13.5 APAC - Market size and forecast 2024-2029
- Chart on APAC - Market size and forecast 2024-2029 ($ million)
- Data Table on APAC - Market size and forecast 2024-2029 ($ million)
- Chart on APAC - Year-over-year growth 2024-2029 (%)
- Data Table on APAC - Year-over-year growth 2024-2029 (%)
- 13.6 South America - Market size and forecast 2024-2029
- Chart on South America - Market size and forecast 2024-2029 ($ million)
- Data Table on South America - Market size and forecast 2024-2029 ($ million)
- Chart on South America - Year-over-year growth 2024-2029 (%)
- Data Table on South America - Year-over-year growth 2024-2029 (%)
- 13.7 Middle East and Africa - Market size and forecast 2024-2029
- Chart on Middle East and Africa - Market size and forecast 2024-2029 ($ million)
- Data Table on Middle East and Africa - Market size and forecast 2024-2029 ($ million)
- Chart on Middle East and Africa - Year-over-year growth 2024-2029 (%)
- Data Table on Middle East and Africa - Year-over-year growth 2024-2029 (%)
- 13.8 US - Market size and forecast 2024-2029
- Chart on US - Market size and forecast 2024-2029 ($ million)
- Data Table on US - Market size and forecast 2024-2029 ($ million)
- Chart on US - Year-over-year growth 2024-2029 (%)
- Data Table on US - Year-over-year growth 2024-2029 (%)
- 13.9 China - Market size and forecast 2024-2029
- Chart on China - Market size and forecast 2024-2029 ($ million)
- Data Table on China - Market size and forecast 2024-2029 ($ million)
- Chart on China - Year-over-year growth 2024-2029 (%)
- Data Table on China - Year-over-year growth 2024-2029 (%)
- 13.10 Canada - Market size and forecast 2024-2029
- Chart on Canada - Market size and forecast 2024-2029 ($ million)
- Data Table on Canada - Market size and forecast 2024-2029 ($ million)
- Chart on Canada - Year-over-year growth 2024-2029 (%)
- Data Table on Canada - Year-over-year growth 2024-2029 (%)
- 13.11 UK - Market size and forecast 2024-2029
- Chart on UK - Market size and forecast 2024-2029 ($ million)
- Data Table on UK - Market size and forecast 2024-2029 ($ million)
- Chart on UK - Year-over-year growth 2024-2029 (%)
- Data Table on UK - Year-over-year growth 2024-2029 (%)
- 13.12 Germany - Market size and forecast 2024-2029
- Chart on Germany - Market size and forecast 2024-2029 ($ million)
- Data Table on Germany - Market size and forecast 2024-2029 ($ million)
- Chart on Germany - Year-over-year growth 2024-2029 (%)
- Data Table on Germany - Year-over-year growth 2024-2029 (%)
- 13.13 Japan - Market size and forecast 2024-2029
- Chart on Japan - Market size and forecast 2024-2029 ($ million)
- Data Table on Japan - Market size and forecast 2024-2029 ($ million)
- Chart on Japan - Year-over-year growth 2024-2029 (%)
- Data Table on Japan - Year-over-year growth 2024-2029 (%)
- 13.14 India - Market size and forecast 2024-2029
- Chart on India - Market size and forecast 2024-2029 ($ million)
- Data Table on India - Market size and forecast 2024-2029 ($ million)
- Chart on India - Year-over-year growth 2024-2029 (%)
- Data Table on India - Year-over-year growth 2024-2029 (%)
- 13.15 Brazil - Market size and forecast 2024-2029
- Chart on Brazil - Market size and forecast 2024-2029 ($ million)
- Data Table on Brazil - Market size and forecast 2024-2029 ($ million)
- Chart on Brazil - Year-over-year growth 2024-2029 (%)
- Data Table on Brazil - Year-over-year growth 2024-2029 (%)
- 13.16 France - Market size and forecast 2024-2029
- Chart on France - Market size and forecast 2024-2029 ($ million)
- Data Table on France - Market size and forecast 2024-2029 ($ million)
- Chart on France - Year-over-year growth 2024-2029 (%)
- Data Table on France - Year-over-year growth 2024-2029 (%)
- 13.17 Italy - Market size and forecast 2024-2029
- Chart on Italy - Market size and forecast 2024-2029 ($ million)
- Data Table on Italy - Market size and forecast 2024-2029 ($ million)
- Chart on Italy - Year-over-year growth 2024-2029 (%)
- Data Table on Italy - Year-over-year growth 2024-2029 (%)
- 13.18 Market opportunity by geography
- Market opportunity by geography ($ million)
- Data Tables on Market opportunity by geography ($ million)
14 Drivers, Challenges, and Opportunity/Restraints
- 14.3 Impact of drivers and challenges
- Impact of drivers and challenges in 2024 and 2029
- 14.4 Market opportunities/restraints
15 Competitive Landscape
- 15.2 Competitive Landscape
- Overview on criticality of inputs and factors of differentiation
- 15.3 Landscape disruption
- Overview on factors of disruption
- 15.4 Industry risks
- Impact of key risks on business
16 Competitive Analysis
- 16.2 Company ranking index
- 16.3 Market positioning of companies
- Matrix on companies position and classification
- 16.4 Aeronavics
- Aeronavics - Overview
- Aeronavics - Product / Service
- Aeronavics - Key offerings
- SWOT
- 16.5 AeroVironment Inc.
- AeroVironment Inc. - Overview
- AeroVironment Inc. - Business segments
- AeroVironment Inc. - Key news
- AeroVironment Inc. - Key offerings
- AeroVironment Inc. - Segment focus
- SWOT
- 16.6 AgEagle Aerial Systems Inc.
- AgEagle Aerial Systems Inc. - Overview
- AgEagle Aerial Systems Inc. - Product / Service
- AgEagle Aerial Systems Inc. - Key offerings
- SWOT
- 16.7 Drone Volt SA
- Drone Volt SA - Overview
- Drone Volt SA - Product / Service
- Drone Volt SA - Key offerings
- SWOT
- 16.8 FlyGuys
- FlyGuys - Overview
- FlyGuys - Product / Service
- FlyGuys - Key offerings
- SWOT
- 16.9 Harris Aerial
- Harris Aerial - Overview
- Harris Aerial - Product / Service
- Harris Aerial - Key offerings
- SWOT
- 16.10 ideaForge Technologies Pvt. Ltd.
- ideaForge Technologies Pvt. Ltd. - Overview
- ideaForge Technologies Pvt. Ltd. - Product / Service
- ideaForge Technologies Pvt. Ltd. - Key offerings
- SWOT
- 16.11 Kray Technologies
- Kray Technologies - Overview
- Kray Technologies - Product / Service
- Kray Technologies - Key offerings
- SWOT
- 16.12 Nextech
- Nextech - Overview
- Nextech - Product / Service
- Nextech - Key offerings
- SWOT
- 16.13 Parrot Drones SAS
- Parrot Drones SAS - Overview
- Parrot Drones SAS - Product / Service
- Parrot Drones SAS - Key offerings
- SWOT
- 16.14 Sentera Inc.
- Sentera Inc. - Overview
- Sentera Inc. - Product / Service
- Sentera Inc. - Key offerings
- SWOT
- 16.15 Shenzhen GC electronics Co. Ltd.
- Shenzhen GC electronics Co. Ltd. - Overview
- Shenzhen GC electronics Co. Ltd. - Product / Service
- Shenzhen GC electronics Co. Ltd. - Key offerings
- SWOT
- 16.16 Skyfront
- Skyfront - Overview
- Skyfront - Product / Service
- Skyfront - Key offerings
- SWOT
- 16.17 SZ DJI Technology Co. Ltd.
- SZ DJI Technology Co. Ltd. - Overview
- SZ DJI Technology Co. Ltd. - Product / Service
- SZ DJI Technology Co. Ltd. - Key news
- SZ DJI Technology Co. Ltd. - Key offerings
- SWOT
- 16.18 Vision Aerial Inc.
- Vision Aerial Inc. - Overview
- Vision Aerial Inc. - Product / Service
- Vision Aerial Inc. - Key offerings
- SWOT
17 Appendix
- 17.2 Inclusions and exclusions checklist
- Inclusions checklist
- Exclusions checklist
- 17.3 Currency conversion rates for US$
- Currency conversion rates for US$
- 17.4 Research methodology
- 17.7 Validation techniques employed for market sizing
- Validation techniques employed for market sizing
- 17.9 360 degree market analysis
- 360 degree market analysis
- 17.10 List of abbreviations