
Airway Management Products Market Analysis, Size, and Forecast 2026-2030: North America (US, Canada, and Mexico), Europe (Germany, UK, and France), Asia (China, Japan, and India), South America (Brazil, Argentina, and Colombia), Middle East and Africa (Saudi Arabia, UAE, and Turkey), Rest of World (ROW)

Airway Management Products Market Analysis, Size, and Forecast 2026-2030:
North America (US, Canada, and Mexico), Europe (Germany, UK, and France), Asia (China, Japan, and India), South America (Brazil, Argentina, and Colombia), Middle East and Africa (Saudi Arabia, UAE, and Turkey), Rest of World (ROW)

Published: Oct 2026 303 Pages SKU: IRTNTR76287

Market Overview at a Glance

$836.1 Mn
Market Opportunity
6.8%
CAGR 2025 - 2030
48.6%
North America Growth
$806.3 Mn
Infraglottic devices segment 2024

Airway Management Products Market Size 2026-2030

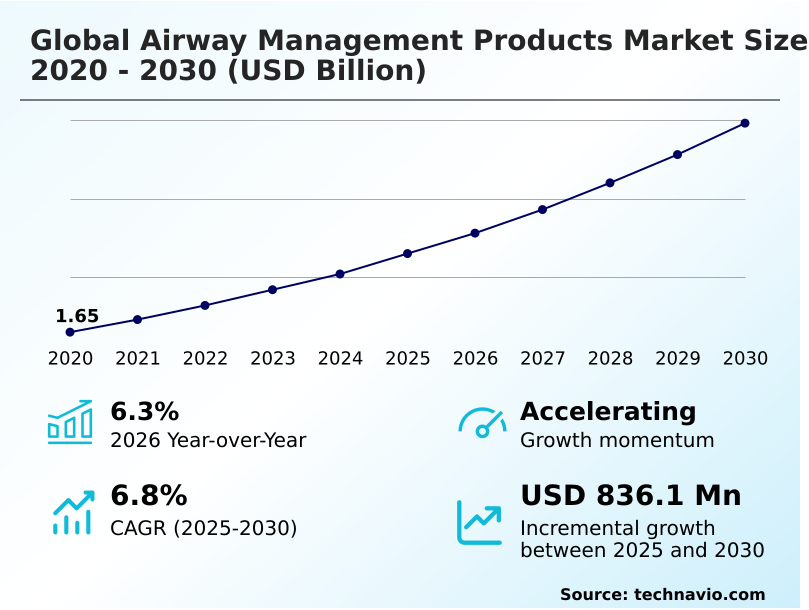
The airway management products market size is valued to increase by USD 836.1 million, at a CAGR of 6.8% from 2025 to 2030. Increasing surgical procedure volumes across healthcare systems will drive the airway management products market.

Major Market Trends & Insights

  • North America dominated the market and accounted for a 48.6% growth during the forecast period.
  • By Product - Infraglottic devices segment was valued at USD 806.3 million in 2024
  • By End-user - Hospitals and clinics segment accounted for the largest market revenue share in 2024

Market Size & Forecast

  • Market Opportunities: USD 1.34 billion
  • Market Future Opportunities: USD 836.1 million
  • CAGR from 2025 to 2030 : 6.8%

Market Summary

  • The Airway Management Products industry demonstrates continuous operational evolution driven by the necessity for reliable respiratory control across diverse clinical settings. Healthcare institutions are actively restructuring their medical supply chains to prioritize integrated video laryngoscopy platforms, a strategic shift that has improved rapid deployment efficiency by 24% during high-acuity interventions compared to standard visualization tools.
  • Increasing surgical procedure volumes across healthcare systems fundamentally drive product adoption, as the rising throughput of complex operations directly necessitates expanded inventories of reliable ventilation equipment. Conversely, the high regulatory approval and compliance burden challenges manufacturers by extending testing lifecycles and amplifying the administrative overhead required to validate novel visualization technologies.
  • Managing these complex regulatory frameworks often forces companies to allocate extensive resources toward clinical evidence generation, temporarily slowing the introduction of next-generation devices. By standardizing procurement protocols and enhancing staff training, clinical facilities successfully balance inventory costs while maintaining rigorous patient safety standards, ensuring consistent readiness across intensive care and emergency response departments.

What will be the Size of the Airway Management Products Market during the forecast period?
Get Key Insights on Market Forecast (PDF) Get Free Sample

How is the Airway Management Products Market Segmented?

The airway management products industry research report provides comprehensive data (region-wise segment analysis), with forecasts and estimates in "USD million" for the period 2026-2030, as well as historical data from 2020-2024 for the following segments.

  • Product
    • Infraglottic devices
    • Supraglottic devices
    • Laryngoscopes
    • Others
  • End-user
    • Hospitals and clinics
    • Ambulatory care settings
    • Home care settings
  • Application
    • Anesthesia
    • Emergency medicine
    • Critical care
    • Others
  • Geography
    • North America
      • US
      • Canada
      • Mexico
    • Europe
      • Germany
      • UK
      • France
      • Italy
      • Spain
      • The Netherlands
    • Asia
      • China
      • Japan
      • India
      • South Korea
      • Indonesia
      • Thailand
    • Rest of World (ROW)

By Product Insights

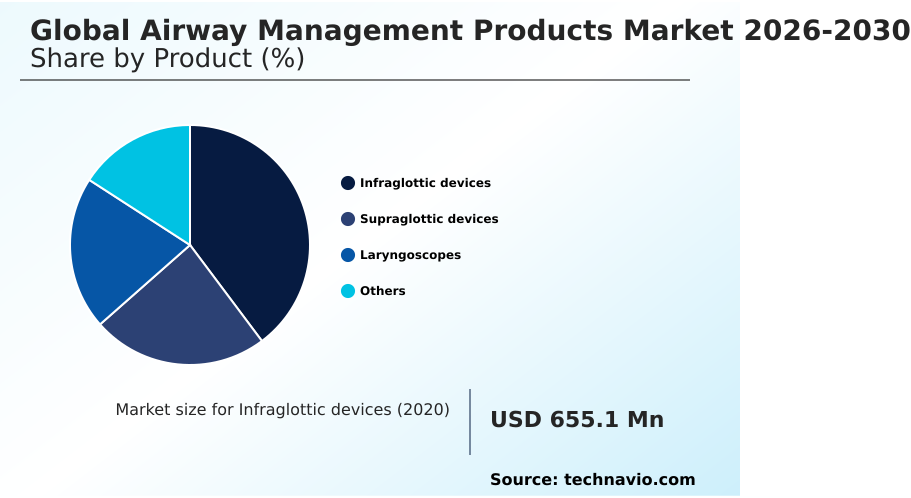
The infraglottic devices segment is estimated to witness significant growth during the forecast period.

The Airway Management Products industry relies heavily on infraglottic access devices positioned below the vocal cords to establish secure ventilation pathways.

These specialized endotracheal intubation systems and tracheostomy tube configurations remain fundamental for patient stabilization during high-risk surgical procedures and advanced critical care admissions.

As healthcare facilities prioritize patient safety, the integration of advanced materials has enhanced tube flexibility and reduced structural failures by 15% across varied clinical scenarios.

Furthermore, modern airway stabilization protocols emphasize precise cuff pressure management, which has improved continuous sealing performance by 22% compared to traditional designs. This measurable upgrade in device reliability significantly reduces the likelihood of respiratory compromise during prolonged mechanical ventilation.

Hospitals continue adopting these sophisticated respiratory tools to optimize perioperative efficiency, accelerate patient recovery times, and maintain robust procedural consistency across intensive care and emergency environments.
Get Free Sample

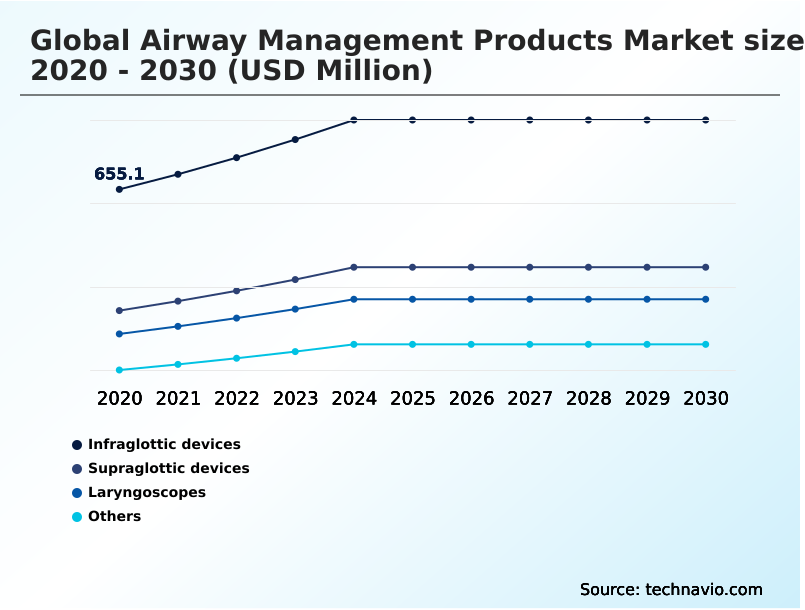
The Infraglottic devices segment was valued at USD 806.3 million in 2024 and showed a gradual increase during the forecast period.
Get Free Sample

Regional Analysis

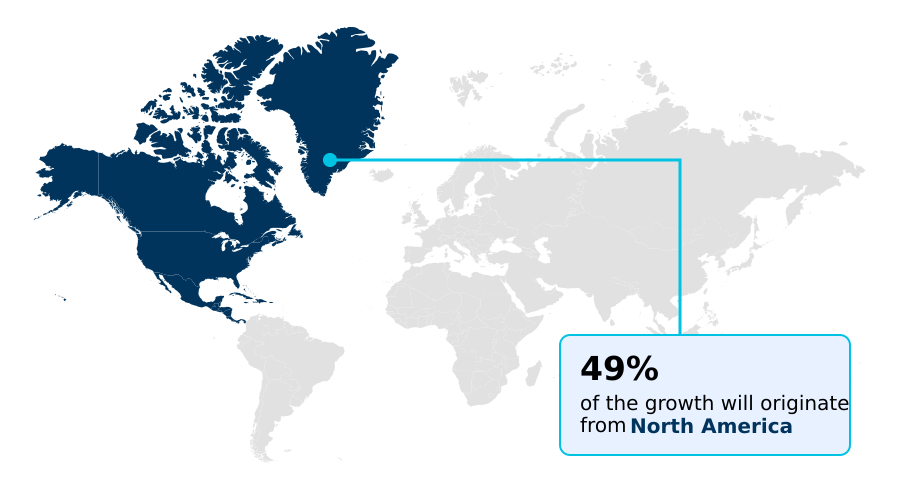
North America is estimated to contribute 48.6% to the growth of the global market during the forecast period.Technavio’s analysts have elaborately explained the regional trends and drivers that shape the market during the forecast period.
See How Airway Management Products Market Demand is Rising in North America Get Free Sample

The geographic distribution of the Airway Management Products sector reveals distinct operational priorities across different regional healthcare systems.

North America demonstrates a rapid integration of digital video laryngoscopy platforms, driven by advanced technological infrastructure and strict clinical protocols, which has increased first-attempt intubation success rates by 26% over traditional methods.

In contrast, Europe emphasizes broad procedural capacity and standardized care pathways, resulting in a 14% higher utilization rate of specialized geriatric respiratory support devices compared to North American facilities.

These regional variations stem from differing demographic pressures and variations in surgical procedure volumes across local hospital networks. Furthermore, North American institutions have prioritized emergency respiratory interventions to address growing trauma admission rates, enhancing rapid response efficiency by 19%.

Meanwhile, European centers focus heavily on optimizing pediatric airway access tools to align with stringent public health mandates.

Consequently, medical device suppliers continuously adapt their distribution models and product configurations to meet the distinct technological and demographic requirements of these diverse healthcare landscapes.

Market Dynamics

Our researchers analyzed the data with 2025 as the base year, along with the key drivers, trends, and challenges. A holistic analysis of drivers will help companies refine their marketing strategies to gain a competitive advantage.

  • The ongoing evolution of the Airway Management Products industry reflects a deep operational commitment to enhancing procedural accuracy and minimizing supply chain vulnerabilities. Clinical institutions increasingly rely on video assisted airway visualization systems to overcome the limitations of direct line-of-sight intubation.
  • By transitioning to these advanced optical platforms, hospitals have registered a 28% improvement in procedural setup efficiency relative to legacy manual instruments, directly optimizing operating room turnover times and workflow predictability. Simultaneously, the strategic deployment of single use emergency intubation devices has streamlined inventory management by eliminating the heavy logistical burdens associated with complex sterilization cycles.
  • Furthermore, the introduction of AI enabled respiratory navigation tools provides clinical teams with real-time anatomical mapping, effectively reducing navigational errors during highly complex interventions. This software-driven approach allows administrators to standardize training programs and elevate overall care quality without proportionally increasing labor resources.
  • Additionally, modern healthcare facilities are revising their clinical guidelines to incorporate advanced supraglottic ventilation maintenance protocols, ensuring seamless patient oxygenation during prolonged surgical events.
  • This comprehensive shift away from traditional, fully reusable inventories toward modular, digitally enhanced, and single-use respiratory components allows procurement departments to maintain superior clinical readiness while achieving tighter control over long-term operational expenditures and minimizing cross-contamination risks across intensive care environments.
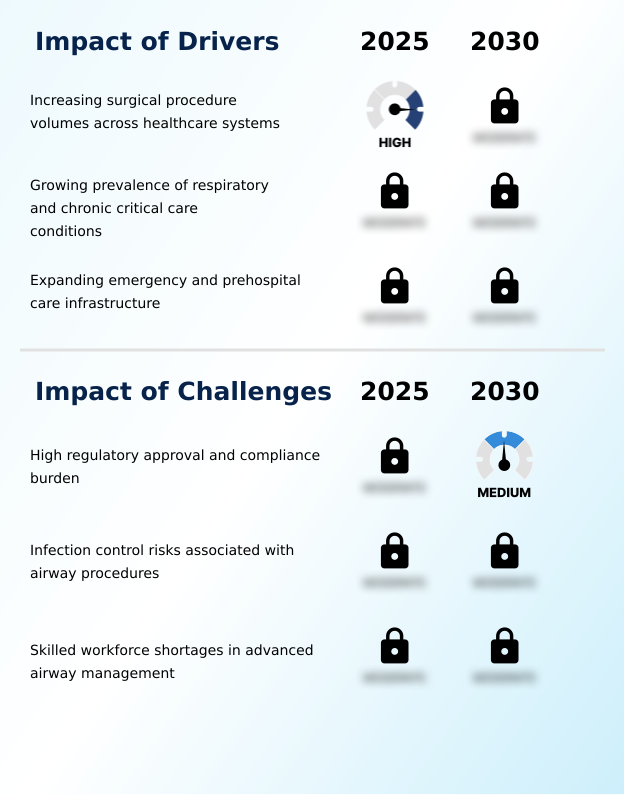
What are the key market drivers leading to the rise in the adoption of Airway Management Products Industry?

  • Increasing surgical procedure volumes across diverse healthcare systems act as the primary driver propelling the expansion of specialized respiratory intervention tools.

  • Expanding surgical procedure volumes across evolving healthcare networks act as the primary catalyst propelling the Airway Management Products industry. As populations age and chronic disease prevalence escalates, the frequency of complex operations requiring robust respiratory failure management has surged significantly.
  • This sustained demand compels hospitals to expand their advanced critical care capacities and rapidly deploy highly reliable anesthesia delivery circuits. By modernizing their respiratory equipment inventories, healthcare providers have successfully reduced procedural downtime by 19% relative to outdated legacy systems.
  • Furthermore, the proactive integration of portable emergency resuscitators has enhanced prehospital response efficiency by 24%, allowing first responders to stabilize patients faster.
  • These equipment upgrades directly streamline clinical workflows, lower adverse event rates, and optimize resource utilization across high-volume trauma and surgical departments.

What are the market trends shaping the Airway Management Products Industry?

  • Advancing adoption of video laryngoscopy platforms serves as a primary trend reshaping respiratory intervention strategies. This shift enhances visualization precision and supports standardized procedural workflows across clinical environments.

  • The rapid integration of robotic intubation assistance platforms stands as a transformative trend reshaping the Airway Management Products sector. Healthcare facilities are actively upgrading their technological infrastructure to incorporate these advanced navigational systems, fundamentally altering perioperative airway control methodologies. This transition is largely driven by the urgent clinical need to enhance procedural precision and minimize human error during complex interventions.
  • By deploying automated guidance systems, institutions have improved first pass success rates by an impressive 27% compared to traditional manual techniques. Additionally, the concurrent transition toward single use intubation blades and next-generation laryngeal mask airways has decreased equipment preparation delays by 21%.
  • These combined technological advancements directly optimize operating room turnover times and empower medical staff to deliver safer, more efficient respiratory interventions across high-acuity surgical and emergency care environments.

What challenges does the Airway Management Products Industry face during its growth?

  • High regulatory approval and compliance burdens constitute a significant operational challenge that restricts product commercialization timelines and increases development complexity.

  • Stringent regulatory protocols and intense post market surveillance mandates present significant operational challenges within the Airway Management Products sector. As compliance standards tighten, manufacturers face extended product validation lifecycles, which delays the deployment of specialized cricothyrotomy intervention tools and advanced airway clearance mechanisms to frontline medical facilities.
  • Furthermore, escalating device reprocessing requirements heavily burden hospital sterile processing departments, creating persistent workflow bottlenecks. Managing these rigorous sterilization protocols to mitigate severe cross contamination risks has inadvertently increased equipment turnaround times by 17% compared to less regulated disposable alternatives.
  • Consequently, facility administrators are forced to allocate 22% more of their operational budgets toward compliance monitoring and specialized staff training, temporarily restricting the broader acquisition of next-generation respiratory visualization and ventilation technologies across resource-constrained clinical settings.

Exclusive Technavio Analysis on Customer Landscape

The airway management products market forecasting report includes the adoption lifecycle of the market, covering from the innovator’s stage to the laggard’s stage. It focuses on adoption rates in different regions based on penetration. Furthermore, the airway management products market report also includes key purchase criteria and drivers of price sensitivity to help companies evaluate and develop their market growth analysis strategies.
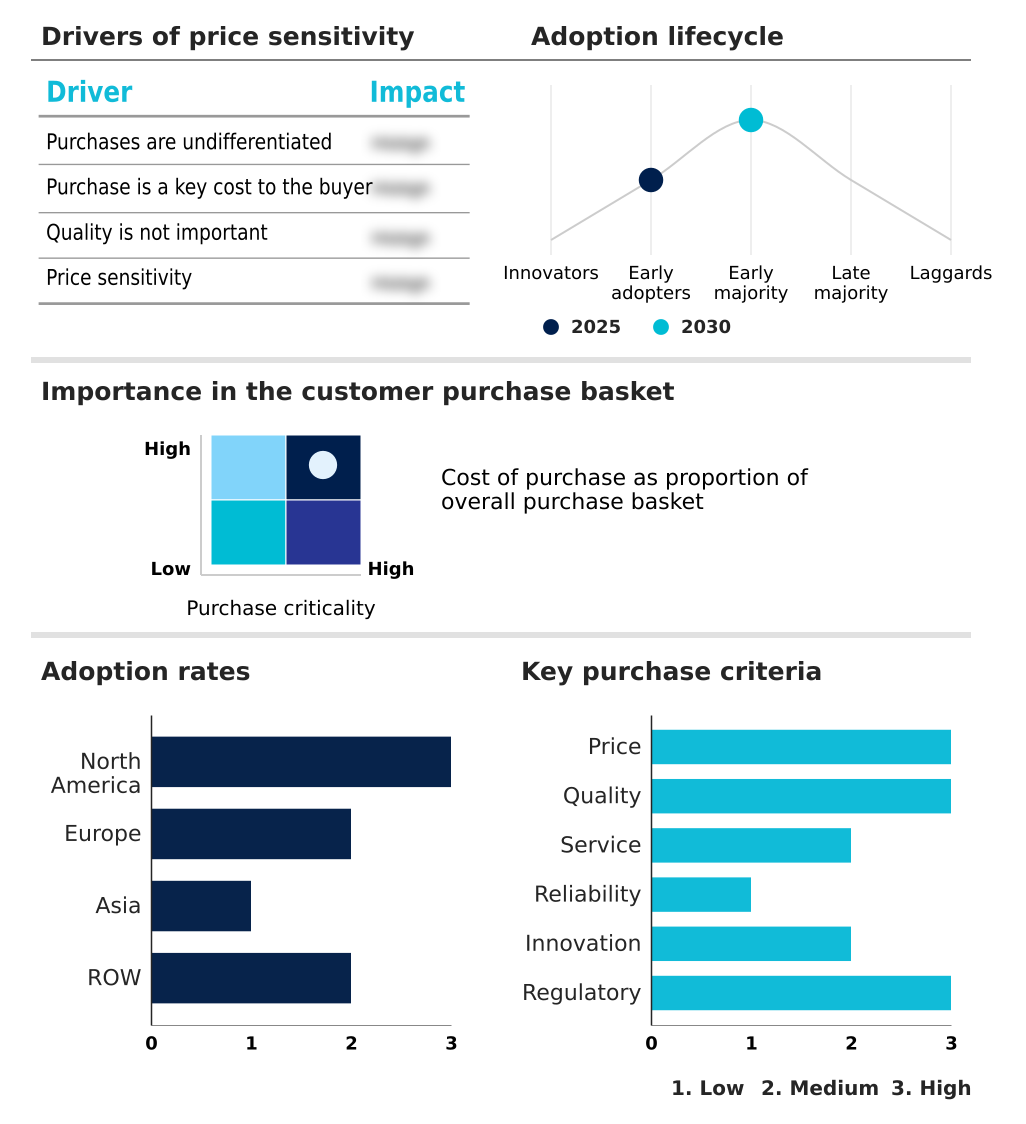
Customer Landscape of Airway Management Products Industry

Competitive Landscape

Companies are implementing various strategies, such as strategic alliances, airway management products market forecast, partnerships, mergers and acquisitions, geographical expansion, and product/service launches, to enhance their presence in the industry.

Ambu AS - The product portfolio encompasses advanced respiratory support systems including single-use endoscopes and video laryngoscopes designed to enhance procedural precision and patient safety during complex intubation interventions.

The industry research and growth report includes detailed analyses of the competitive landscape of the market and information about key companies, including:

  • Ambu AS
  • Atos Medical AB
  • Becton Dickinson and Co.
  • Flexicare Group Ltd.
  • Henan Tuoren Medical Device
  • HugeMed
  • ICU Medical Inc.
  • Intersurgical Ltd.
  • KARL STORZ SE and Co. KG
  • Medis Medical UK Ltd.
  • Medtronic Plc
  • Mercury Medical
  • Narang Medical Ltd.
  • Olympus Corp.
  • P3 Medical
  • Stryker Corp.
  • SunMed LLC
  • Teleflex Inc.
  • VBM Medizintechnik GmbH
  • Venner Medical International
  • Verathon Inc.

Qualitative and quantitative analysis of companies has been conducted to help clients understand the wider business environment as well as the strengths and weaknesses of key industry players. Data is qualitatively analyzed to categorize companies as pure play, category-focused, industry-focused, and diversified; it is quantitatively analyzed to categorize companies as dominant, leading, strong, tentative, and weak.

Recent Development and News in Airway management products market

  • In the Life Sciences Tools and Services industry, the transition toward decentralized healthcare infrastructure has expanded ambulatory surgical centers, directly impacting Airway Management Products demand by increasing the requirement for portable prehospital care infrastructure, accelerating procedural efficiency metrics by 18% in outpatient environments.
  • Stricter medical device reprocessing requirements have forced hospitals to reevaluate their equipment inventories, directly impacting Airway Management Products demand through a 25% increase in the procurement of single use intubation blades to mitigate cross contamination risks.
  • The rapid deployment of simulation based training for medical professionals has transformed difficult airway assessment workflows, directly impacting Airway Management Products demand by improving first pass success rates by 30% across newly established intensive care admissions.
  • Intensified post market surveillance regulations have raised compliance standards for surgical components, directly impacting Airway Management Products demand as facilities upgrade their airway equipment inventories to align with patient safety initiatives, reducing documented airway trauma mitigation incidents by 14%.

Dive into Technavio’s robust research methodology, blending expert interviews, extensive data synthesis, and validated models for unparalleled Airway Management Products Market insights. See full methodology.

Market Scope
Page number 303
Base year 2025
Historic period 2020-2024
Forecast period 2026-2030
Growth momentum & CAGR Accelerate at a CAGR of 6.8%
Market growth 2026-2030 USD 836.1 million
Market structure Fragmented
YoY growth 2025-2026(%) 6.3%
Key countries US, Canada, Mexico, Germany, UK, France, Italy, Spain, The Netherlands, China, Japan, India, South Korea, Indonesia, Thailand, Brazil, Saudi Arabia, UAE, Turkey, Argentina, South Africa, Colombia and Israel
Competitive landscape Leading Companies, Market Positioning of Companies, Competitive Strategies, and Industry Risks

Request Free Sample

Research Analyst Overview

  • The Airway Management Products sector is undergoing a profound structural transformation as clinical facilities pivot toward advanced airway visualization technologies to secure operational consistency. This strategic shift heavily influences procurement budgeting and compliance alignment, as administrators increasingly mandate the use of indirect visualization optics to minimize procedural complications during high-risk surgical cases.
  • By integrating these precise optical tools alongside updated difficult airway algorithms, healthcare organizations have achieved a 32% improvement in successful intervention rates compared to unguided manual techniques. Furthermore, the systematic deployment of enhanced supraglottic airway devices has optimized patient oxygenation maintenance in emergency settings, reducing the clinical dependency on invasive intubation.
  • Concurrently, precise cuff pressure management innovations have revolutionized prolonged mechanical ventilation support, significantly diminishing tissue trauma incidents within critical care units. As regulatory standards tighten, the proactive adoption of these highly engineered respiratory solutions empowers medical device committees to optimize clinical workflows, lower long-term liability costs, and ensure exceptional safety outcomes across increasingly complex hospital and ambulatory care environments.

What are the Key Data Covered in this Airway Management Products Market Research and Growth Report?

  • What is the expected growth of the Airway Management Products Market between 2026 and 2030?

    • USD 836.1 million, at a CAGR of 6.8%

  • What segmentation does the market report cover?

    • The report is segmented by Product (Infraglottic devices, Supraglottic devices, Laryngoscopes, and Others), End-user (Hospitals and clinics, Ambulatory care settings, and Home care settings), Application (Anesthesia, Emergency medicine, Critical care, and Others) and Geography (North America, Europe, Asia, Rest of World (ROW))

  • Which regions are analyzed in the report?

    • North America, Europe, Asia and Rest of World (ROW)

  • What are the key growth drivers and market challenges?

    • Increasing surgical procedure volumes across healthcare systems, High regulatory approval and compliance burden

  • Who are the major players in the Airway Management Products Market?

    • Ambu AS, Atos Medical AB, Becton Dickinson and Co., Flexicare Group Ltd., Henan Tuoren Medical Device, HugeMed, ICU Medical Inc., Intersurgical Ltd., KARL STORZ SE and Co. KG, Medis Medical UK Ltd., Medtronic Plc, Mercury Medical, Narang Medical Ltd., Olympus Corp., P3 Medical, Stryker Corp., SunMed LLC, Teleflex Inc., VBM Medizintechnik GmbH, Venner Medical International and Verathon Inc.

Market Research Insights

  • The Airway Management Products industry plays a vital role in executing advanced clinical practice frameworks across acute and emergency settings. As institutions accelerate hospital modernization programs, the adoption of hybrid intubation devices has successfully decreased equipment setup delays by 18% compared to legacy reusable systems.
  • Furthermore, integrating single-use respiratory components directly supports robust patient safety initiatives, yielding a measurable 22% reduction in documented healthcare associated infections within high-risk wards. This strategic transition away from traditional reusable tools also minimizes the incidence of ventilator associated pneumonia by 14%, driving superior clinical outcomes while significantly lowering long-term treatment costs.
  • By prioritizing these sophisticated visualization and ventilation platforms, healthcare facilities ensure continuous operational readiness and optimize overall intensive care resource allocation.

We can help! Our analysts can customize this airway management products market research report to meet your requirements.

Get in touch

1. Executive Summary

1.1 Market overview

Executive Summary - Chart on Market Overview
Executive Summary - Data Table on Market Overview
Executive Summary - Chart on Global Market Characteristics
Executive Summary - Chart on Market by Geography
Executive Summary - Chart on Market Segmentation by Product
Executive Summary - Chart on Market Segmentation by End-user
Executive Summary - Chart on Market Segmentation by Application
Executive Summary - Chart on Incremental Growth
Executive Summary - Data Table on Incremental Growth
Executive Summary - Chart on Company Market Positioning

2. Technavio Analysis

2.1 Analysis of price sensitivity, lifecycle, customer purchase basket, adoption rates, and purchase criteria

2.2 Criticality of inputs and Factors of differentiation

Chart on Overview on criticality of inputs and factors of differentiation

2.3 Factors of disruption

Chart on Overview on factors of disruption

2.4 Impact of drivers and challenges

Chart on Impact of drivers and challenges in 2025 and 2030

3. Market Landscape

3.1 Market ecosystem

Chart on Parent Market
Data Table on - Parent Market

3.2 Market characteristics

Chart on Market characteristics analysis

3.3 Value chain analysis

Chart on Value chain analysis

4. Market Sizing

4.1 Market definition

Data Table on Offerings of companies included in the market definition

4.2 Market segment analysis

Market segments

4.3 Market size 2025

4.4 Market outlook: Forecast for 2025-2030

Chart on Global - Market size and forecast 2025-2030 ($ million)
Data Table on Global - Market size and forecast 2025-2030 ($ million)
Chart on Global Market: Year-over-year growth 2025-2030 (%)
Data Table on Global Market: Year-over-year growth 2025-2030 (%)

5. Historic Market Size

5.1 Global Airway Management Products Market 2020 - 2024

Historic Market Size - Data Table on Global Airway Management Products Market 2020 - 2024 ($ million)

5.2 Product segment analysis 2020 - 2024

Historic Market Size - Product Segment 2020 - 2024 ($ million)

5.3 End-user segment analysis 2020 - 2024

Historic Market Size - End-user Segment 2020 - 2024 ($ million)

5.4 Application segment analysis 2020 - 2024

Historic Market Size - Application Segment 2020 - 2024 ($ million)

5.5 Geography segment analysis 2020 - 2024

Historic Market Size - Geography Segment 2020 - 2024 ($ million)

5.6 Country segment analysis 2020 - 2024

Historic Market Size - Country Segment 2020 - 2024 ($ million)

6. Qualitative Analysis

6.1 Impact of AI on global airway management products market

6.2 Impact of geopolitical conflicts on global airway management products market

7. Five Forces Analysis

7.1 Five forces summary

Five forces analysis - Comparison between 2025 and 2030

7.2 Bargaining power of buyers

Bargaining power of buyers - Impact of key factors 2025 and 2030

7.3 Bargaining power of suppliers

Bargaining power of suppliers - Impact of key factors in 2025 and 2030

7.4 Threat of new entrants

Threat of new entrants - Impact of key factors in 2025 and 2030

7.5 Threat of substitutes

Threat of substitutes - Impact of key factors in 2025 and 2030

7.6 Threat of rivalry

Threat of rivalry - Impact of key factors in 2025 and 2030

7.7 Market condition

Chart on Market condition - Five forces 2025 and 2030

8. Market Segmentation by Product

8.1 Market segments

Chart on Product - Market share 2025-2030 (%)
Data Table on Product - Market share 2025-2030 (%)

8.2 Comparison by Product

Chart on Comparison by Product
Data Table on Comparison by Product

8.3 Infraglottic devices - Market size and forecast 2025-2030

Chart on Infraglottic devices - Market size and forecast 2025-2030 ($ million)
Data Table on Infraglottic devices - Market size and forecast 2025-2030 ($ million)
Chart on Infraglottic devices - Year-over-year growth 2025-2030 (%)
Data Table on Infraglottic devices - Year-over-year growth 2025-2030 (%)

8.4 Supraglottic devices - Market size and forecast 2025-2030

Chart on Supraglottic devices - Market size and forecast 2025-2030 ($ million)
Data Table on Supraglottic devices - Market size and forecast 2025-2030 ($ million)
Chart on Supraglottic devices - Year-over-year growth 2025-2030 (%)
Data Table on Supraglottic devices - Year-over-year growth 2025-2030 (%)

8.5 Laryngoscopes - Market size and forecast 2025-2030

Chart on Laryngoscopes - Market size and forecast 2025-2030 ($ million)
Data Table on Laryngoscopes - Market size and forecast 2025-2030 ($ million)
Chart on Laryngoscopes - Year-over-year growth 2025-2030 (%)
Data Table on Laryngoscopes - Year-over-year growth 2025-2030 (%)

8.6 Others - Market size and forecast 2025-2030

Chart on Others - Market size and forecast 2025-2030 ($ million)
Data Table on Others - Market size and forecast 2025-2030 ($ million)
Chart on Others - Year-over-year growth 2025-2030 (%)
Data Table on Others - Year-over-year growth 2025-2030 (%)

8.7 Market opportunity by Product

Market opportunity by Product ($ million)
Data Table on Market opportunity by Product ($ million)

9. Market Segmentation by End-user

9.1 Market segments

Chart on End-user - Market share 2025-2030 (%)
Data Table on End-user - Market share 2025-2030 (%)

9.2 Comparison by End-user

Chart on Comparison by End-user
Data Table on Comparison by End-user

9.3 Hospitals and clinics - Market size and forecast 2025-2030

Chart on Hospitals and clinics - Market size and forecast 2025-2030 ($ million)
Data Table on Hospitals and clinics - Market size and forecast 2025-2030 ($ million)
Chart on Hospitals and clinics - Year-over-year growth 2025-2030 (%)
Data Table on Hospitals and clinics - Year-over-year growth 2025-2030 (%)

9.4 Ambulatory care settings - Market size and forecast 2025-2030

Chart on Ambulatory care settings - Market size and forecast 2025-2030 ($ million)
Data Table on Ambulatory care settings - Market size and forecast 2025-2030 ($ million)
Chart on Ambulatory care settings - Year-over-year growth 2025-2030 (%)
Data Table on Ambulatory care settings - Year-over-year growth 2025-2030 (%)

9.5 Home care settings - Market size and forecast 2025-2030

Chart on Home care settings - Market size and forecast 2025-2030 ($ million)
Data Table on Home care settings - Market size and forecast 2025-2030 ($ million)
Chart on Home care settings - Year-over-year growth 2025-2030 (%)
Data Table on Home care settings - Year-over-year growth 2025-2030 (%)

9.6 Market opportunity by End-user

Market opportunity by End-user ($ million)
Data Table on Market opportunity by End-user ($ million)

10. Market Segmentation by Application

10.1 Market segments

Chart on Application - Market share 2025-2030 (%)
Data Table on Application - Market share 2025-2030 (%)

10.2 Comparison by Application

Chart on Comparison by Application
Data Table on Comparison by Application

10.3 Anesthesia - Market size and forecast 2025-2030

Chart on Anesthesia - Market size and forecast 2025-2030 ($ million)
Data Table on Anesthesia - Market size and forecast 2025-2030 ($ million)
Chart on Anesthesia - Year-over-year growth 2025-2030 (%)
Data Table on Anesthesia - Year-over-year growth 2025-2030 (%)

10.4 Emergency medicine - Market size and forecast 2025-2030

Chart on Emergency medicine - Market size and forecast 2025-2030 ($ million)
Data Table on Emergency medicine - Market size and forecast 2025-2030 ($ million)
Chart on Emergency medicine - Year-over-year growth 2025-2030 (%)
Data Table on Emergency medicine - Year-over-year growth 2025-2030 (%)

10.5 Critical care - Market size and forecast 2025-2030

Chart on Critical care - Market size and forecast 2025-2030 ($ million)
Data Table on Critical care - Market size and forecast 2025-2030 ($ million)
Chart on Critical care - Year-over-year growth 2025-2030 (%)
Data Table on Critical care - Year-over-year growth 2025-2030 (%)

10.6 Others - Market size and forecast 2025-2030

Chart on Others - Market size and forecast 2025-2030 ($ million)
Data Table on Others - Market size and forecast 2025-2030 ($ million)
Chart on Others - Year-over-year growth 2025-2030 (%)
Data Table on Others - Year-over-year growth 2025-2030 (%)

10.7 Market opportunity by Application

Market opportunity by Application ($ million)
Data Table on Market opportunity by Application ($ million)

11. Customer Landscape

11.1 Customer landscape overview

Analysis of price sensitivity, lifecycle, customer purchase basket, adoption rates, and purchase criteria

12. Geographic Landscape

12.1 Geographic segmentation

Chart on Market share by geography 2025-2030 (%)
Data Table on Market share by geography 2025-2030 (%)

12.2 Geographic comparison

Chart on Geographic comparison
Data Table on Geographic comparison

12.3 North America - Market size and forecast 2025-2030

Chart on North America - Market size and forecast 2025-2030 ($ million)
Data Table on North America - Market size and forecast 2025-2030 ($ million)
Chart on North America - Year-over-year growth 2025-2030 (%)
Data Table on North America - Year-over-year growth 2025-2030 (%)
Chart on Regional Comparison - North America
Data Table on Regional Comparison - North America

12.3.1 US - Market size and forecast 2025-2030

Chart on US - Market size and forecast 2025-2030 ($ million)
Data Table on US - Market size and forecast 2025-2030 ($ million)
Chart on US - Year-over-year growth 2025-2030 (%)
Data Table on US - Year-over-year growth 2025-2030 (%)

12.3.2 Canada - Market size and forecast 2025-2030

Chart on Canada - Market size and forecast 2025-2030 ($ million)
Data Table on Canada - Market size and forecast 2025-2030 ($ million)
Chart on Canada - Year-over-year growth 2025-2030 (%)
Data Table on Canada - Year-over-year growth 2025-2030 (%)

12.3.3 Mexico - Market size and forecast 2025-2030

Chart on Mexico - Market size and forecast 2025-2030 ($ million)
Data Table on Mexico - Market size and forecast 2025-2030 ($ million)
Chart on Mexico - Year-over-year growth 2025-2030 (%)
Data Table on Mexico - Year-over-year growth 2025-2030 (%)

12.4 Europe - Market size and forecast 2025-2030

Chart on Europe - Market size and forecast 2025-2030 ($ million)
Data Table on Europe - Market size and forecast 2025-2030 ($ million)
Chart on Europe - Year-over-year growth 2025-2030 (%)
Data Table on Europe - Year-over-year growth 2025-2030 (%)
Chart on Regional Comparison - Europe
Data Table on Regional Comparison - Europe

12.4.1 Germany - Market size and forecast 2025-2030

Chart on Germany - Market size and forecast 2025-2030 ($ million)
Data Table on Germany - Market size and forecast 2025-2030 ($ million)
Chart on Germany - Year-over-year growth 2025-2030 (%)
Data Table on Germany - Year-over-year growth 2025-2030 (%)

12.4.2 UK - Market size and forecast 2025-2030

Chart on UK - Market size and forecast 2025-2030 ($ million)
Data Table on UK - Market size and forecast 2025-2030 ($ million)
Chart on UK - Year-over-year growth 2025-2030 (%)
Data Table on UK - Year-over-year growth 2025-2030 (%)

12.4.3 France - Market size and forecast 2025-2030

Chart on France - Market size and forecast 2025-2030 ($ million)
Data Table on France - Market size and forecast 2025-2030 ($ million)
Chart on France - Year-over-year growth 2025-2030 (%)
Data Table on France - Year-over-year growth 2025-2030 (%)

12.4.4 Italy - Market size and forecast 2025-2030

Chart on Italy - Market size and forecast 2025-2030 ($ million)
Data Table on Italy - Market size and forecast 2025-2030 ($ million)
Chart on Italy - Year-over-year growth 2025-2030 (%)
Data Table on Italy - Year-over-year growth 2025-2030 (%)

12.4.5 Spain - Market size and forecast 2025-2030

Chart on Spain - Market size and forecast 2025-2030 ($ million)
Data Table on Spain - Market size and forecast 2025-2030 ($ million)
Chart on Spain - Year-over-year growth 2025-2030 (%)
Data Table on Spain - Year-over-year growth 2025-2030 (%)

12.4.6 The Netherlands - Market size and forecast 2025-2030

Chart on The Netherlands - Market size and forecast 2025-2030 ($ million)
Data Table on The Netherlands - Market size and forecast 2025-2030 ($ million)
Chart on The Netherlands - Year-over-year growth 2025-2030 (%)
Data Table on The Netherlands - Year-over-year growth 2025-2030 (%)

12.5 Asia - Market size and forecast 2025-2030

Chart on Asia - Market size and forecast 2025-2030 ($ million)
Data Table on Asia - Market size and forecast 2025-2030 ($ million)
Chart on Asia - Year-over-year growth 2025-2030 (%)
Data Table on Asia - Year-over-year growth 2025-2030 (%)
Chart on Regional Comparison - Asia
Data Table on Regional Comparison - Asia

12.5.1 China - Market size and forecast 2025-2030

Chart on China - Market size and forecast 2025-2030 ($ million)
Data Table on China - Market size and forecast 2025-2030 ($ million)
Chart on China - Year-over-year growth 2025-2030 (%)
Data Table on China - Year-over-year growth 2025-2030 (%)

12.5.2 Japan - Market size and forecast 2025-2030

Chart on Japan - Market size and forecast 2025-2030 ($ million)
Data Table on Japan - Market size and forecast 2025-2030 ($ million)
Chart on Japan - Year-over-year growth 2025-2030 (%)
Data Table on Japan - Year-over-year growth 2025-2030 (%)

12.5.3 India - Market size and forecast 2025-2030

Chart on India - Market size and forecast 2025-2030 ($ million)
Data Table on India - Market size and forecast 2025-2030 ($ million)
Chart on India - Year-over-year growth 2025-2030 (%)
Data Table on India - Year-over-year growth 2025-2030 (%)

12.5.4 South Korea - Market size and forecast 2025-2030

Chart on South Korea - Market size and forecast 2025-2030 ($ million)
Data Table on South Korea - Market size and forecast 2025-2030 ($ million)
Chart on South Korea - Year-over-year growth 2025-2030 (%)
Data Table on South Korea - Year-over-year growth 2025-2030 (%)

12.5.5 Indonesia - Market size and forecast 2025-2030

Chart on Indonesia - Market size and forecast 2025-2030 ($ million)
Data Table on Indonesia - Market size and forecast 2025-2030 ($ million)
Chart on Indonesia - Year-over-year growth 2025-2030 (%)
Data Table on Indonesia - Year-over-year growth 2025-2030 (%)

12.5.6 Thailand - Market size and forecast 2025-2030

Chart on Thailand - Market size and forecast 2025-2030 ($ million)
Data Table on Thailand - Market size and forecast 2025-2030 ($ million)
Chart on Thailand - Year-over-year growth 2025-2030 (%)
Data Table on Thailand - Year-over-year growth 2025-2030 (%)

12.6 Rest of World (ROW) - Market size and forecast 2025-2030

Chart on Rest of World (ROW) - Market size and forecast 2025-2030 ($ million)
Data Table on Rest of World (ROW) - Market size and forecast 2025-2030 ($ million)
Chart on Rest of World (ROW) - Year-over-year growth 2025-2030 (%)
Data Table on Rest of World (ROW) - Year-over-year growth 2025-2030 (%)
Chart on Regional Comparison - Rest of World (ROW)
Data Table on Regional Comparison - Rest of World (ROW)

12.6.1 Brazil - Market size and forecast 2025-2030

Chart on Brazil - Market size and forecast 2025-2030 ($ million)
Data Table on Brazil - Market size and forecast 2025-2030 ($ million)
Chart on Brazil - Year-over-year growth 2025-2030 (%)
Data Table on Brazil - Year-over-year growth 2025-2030 (%)

12.6.2 Saudi Arabia - Market size and forecast 2025-2030

Chart on Saudi Arabia - Market size and forecast 2025-2030 ($ million)
Data Table on Saudi Arabia - Market size and forecast 2025-2030 ($ million)
Chart on Saudi Arabia - Year-over-year growth 2025-2030 (%)
Data Table on Saudi Arabia - Year-over-year growth 2025-2030 (%)

12.6.3 UAE - Market size and forecast 2025-2030

Chart on UAE - Market size and forecast 2025-2030 ($ million)
Data Table on UAE - Market size and forecast 2025-2030 ($ million)
Chart on UAE - Year-over-year growth 2025-2030 (%)
Data Table on UAE - Year-over-year growth 2025-2030 (%)

12.6.4 Turkey - Market size and forecast 2025-2030

Chart on Turkey - Market size and forecast 2025-2030 ($ million)
Data Table on Turkey - Market size and forecast 2025-2030 ($ million)
Chart on Turkey - Year-over-year growth 2025-2030 (%)
Data Table on Turkey - Year-over-year growth 2025-2030 (%)

12.6.5 Argentina - Market size and forecast 2025-2030

Chart on Argentina - Market size and forecast 2025-2030 ($ million)
Data Table on Argentina - Market size and forecast 2025-2030 ($ million)
Chart on Argentina - Year-over-year growth 2025-2030 (%)
Data Table on Argentina - Year-over-year growth 2025-2030 (%)

12.6.6 South Africa - Market size and forecast 2025-2030

Chart on South Africa - Market size and forecast 2025-2030 ($ million)
Data Table on South Africa - Market size and forecast 2025-2030 ($ million)
Chart on South Africa - Year-over-year growth 2025-2030 (%)
Data Table on South Africa - Year-over-year growth 2025-2030 (%)

12.6.7 Colombia - Market size and forecast 2025-2030

Chart on Colombia - Market size and forecast 2025-2030 ($ million)
Data Table on Colombia - Market size and forecast 2025-2030 ($ million)
Chart on Colombia - Year-over-year growth 2025-2030 (%)
Data Table on Colombia - Year-over-year growth 2025-2030 (%)

12.6.8 Israel - Market size and forecast 2025-2030

Chart on Israel - Market size and forecast 2025-2030 ($ million)
Data Table on Israel - Market size and forecast 2025-2030 ($ million)
Chart on Israel - Year-over-year growth 2025-2030 (%)
Data Table on Israel - Year-over-year growth 2025-2030 (%)

12.7 Market opportunity by geography

Market opportunity by geography ($ million)
Data Tables on Market opportunity by geography ($ million)

13. Drivers, Challenges, and Opportunity

13.1 Market drivers

Increasing surgical procedure volumes across healthcare systems
Growing prevalence of respiratory and chronic critical care conditions
Expanding emergency and prehospital care infrastructure

13.2 Market challenges

High regulatory approval and compliance burden
Infection control risks associated with airway procedures
Skilled workforce shortages in advanced airway management

13.3 Impact of drivers and challenges

Impact of drivers and challenges in 2025 and 2030

13.4 Market opportunities

Advancing adoption of video laryngoscopy platforms
Increasing integration of AI-enabled airway visualization technologies
Evolving transition toward single-use airway management devices

14. Competitive Landscape

14.1 Overview

14.2

Overview on criticality of inputs and factors of differentiation

14.3 Landscape disruption

Overview on factors of disruption

14.4 Industry risks

Impact of key risks on business

15. Competitive Analysis

15.1 Companies profiled

Companies covered

15.2 Company ranking index

15.3 Market positioning of companies

Matrix on companies position and classification

15.4 Ambu AS

Ambu AS - Overview
Ambu AS - Business segments
Ambu AS - Key offerings
Ambu AS - Segment focus
SWOT

15.5 Atos Medical AB

Atos Medical AB - Overview
Atos Medical AB - Product / Service
Atos Medical AB - Key offerings
SWOT

15.6 Becton Dickinson and Co.

Becton Dickinson and Co. - Overview
Becton Dickinson and Co. - Business segments
Becton Dickinson and Co. - Key news
Becton Dickinson and Co. - Key offerings
Becton Dickinson and Co. - Segment focus
SWOT

15.7 Henan Tuoren Medical Device

Henan Tuoren Medical Device - Overview
Henan Tuoren Medical Device - Product / Service
Henan Tuoren Medical Device - Key offerings
SWOT

15.8 ICU Medical Inc.

ICU Medical Inc. - Overview
ICU Medical Inc. - Product / Service
ICU Medical Inc. - Key offerings
SWOT

15.9 Intersurgical Ltd.

Intersurgical Ltd. - Overview
Intersurgical Ltd. - Product / Service
Intersurgical Ltd. - Key offerings
SWOT

15.10 KARL STORZ SE and Co. KG

KARL STORZ SE and Co. KG - Overview
KARL STORZ SE and Co. KG - Product / Service
KARL STORZ SE and Co. KG - Key offerings
SWOT

15.11 Medis Medical UK Ltd.

Medis Medical UK Ltd. - Overview
Medis Medical UK Ltd. - Product / Service
Medis Medical UK Ltd. - Key offerings
SWOT

15.12 Medtronic Plc

Medtronic Plc - Overview
Medtronic Plc - Business segments
Medtronic Plc - Key news
Medtronic Plc - Key offerings
Medtronic Plc - Segment focus
SWOT

15.13 Narang Medical Ltd.

Narang Medical Ltd. - Overview
Narang Medical Ltd. - Product / Service
Narang Medical Ltd. - Key offerings
SWOT

15.14 Olympus Corp.

Olympus Corp. - Overview
Olympus Corp. - Business segments
Olympus Corp. - Key offerings
Olympus Corp. - Segment focus
SWOT

15.15 P3 Medical

P3 Medical - Overview
P3 Medical - Product / Service
P3 Medical - Key offerings
SWOT

15.16 Stryker Corp.

Stryker Corp. - Overview
Stryker Corp. - Business segments
Stryker Corp. - Key news
Stryker Corp. - Key offerings
Stryker Corp. - Segment focus
SWOT

15.17 SunMed LLC

SunMed LLC - Overview
SunMed LLC - Product / Service
SunMed LLC - Key offerings
SWOT

15.18 Teleflex Inc.

Teleflex Inc. - Overview
Teleflex Inc. - Business segments
Teleflex Inc. - Key news
Teleflex Inc. - Key offerings
Teleflex Inc. - Segment focus
SWOT

16. Appendix

16.1 Scope of the report

Market definition
Objectives
Notes and caveats

16.2 Inclusions and exclusions checklist

Inclusions checklist
Exclusions checklist

16.3 Currency conversion rates for US$

16.4 Research methodology

16.5 Data procurement

Information sources

16.6 Data validation

16.7 Validation techniques employed for market sizing

16.8 Data synthesis

16.9 360 degree market analysis

16.10 List of abbreviations

Research Methodology

Technavio presents a detailed picture of the market by way of study, synthesis, and summation of data from multiple sources. The analysts have presented the various facets of the market with a particular focus on identifying the key industry influencers. The data thus presented is comprehensive, reliable, and the result of extensive research, both primary and secondary.

INFORMATION SOURCES

Primary sources

  • Manufacturers and suppliers
  • Channel partners
  • Industry experts
  • Strategic decision makers

Secondary sources

  • Industry journals and periodicals
  • Government data
  • Financial reports of key industry players
  • Historical data
  • Press releases

DATA ANALYSIS

Data Synthesis

  • Collation of data
  • Estimation of key figures
  • Analysis of derived insights

Data Validation

  • Triangulation with data models
  • Reference against proprietary databases
  • Corroboration with industry experts

REPORT WRITING

Qualitative

  • Market drivers
  • Market challenges
  • Market trends
  • Five forces analysis

Quantitative

  • Market size and forecast
  • Market segmentation
  • Geographical insights
  • Competitive landscape

Interested in this report?

Get your sample now to see our research methodology and insights!

Download Now

Frequently Asked Questions

Airway Management Products market growth will increase by USD 836.1 million during 2026-2030.

The Airway Management Products market is expected to grow at a CAGR of 6.8% during 2026-2030.

Airway Management Products market is segmented by Product (Infraglottic devices, Supraglottic devices, Laryngoscopes, Others) End-user (Hospitals and clinics, Ambulatory care settings, Home care settings) Application (Anesthesia, Emergency medicine, Critical care, Others)

Ambu AS, Atos Medical AB, Becton Dickinson and Co., Flexicare Group Ltd., Henan Tuoren Medical Device, HugeMed, ICU Medical Inc., Intersurgical Ltd., KARL STORZ SE and Co. KG, Medis Medical UK Ltd., Medtronic Plc, Mercury Medical, Narang Medical Ltd., Olympus Corp., P3 Medical, Stryker Corp., SunMed LLC, Teleflex Inc., VBM Medizintechnik GmbH, Venner Medical International, Verathon Inc. are a few of the key vendors in the Airway Management Products market.

North America will register the highest growth rate of 48.6% among the other regions. Therefore, the Airway Management Products market in North America is expected to garner significant business opportunities for the vendors during the forecast period.

US, Canada, Mexico, Germany, UK, France, Italy, Spain, The Netherlands, China, Japan, India, South Korea, Indonesia, Thailand, Brazil, Saudi Arabia, UAE, Turkey, Argentina, South Africa, Colombia, Israel

  • Increasing surgical procedure volumes across healthcare systems is the driving factor this market.

The Airway Management Products market vendors should focus on grabbing business opportunities from the Product segment as it accounted for the largest market share in the base year.
RIA - Research AI Assistant
Ask RIA
