Alcoholic Drinks Market Size 2025-2029
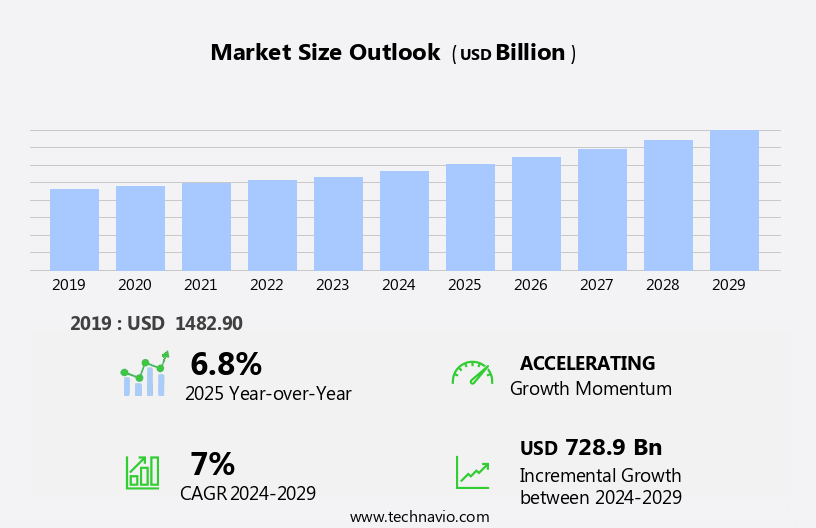
The alcoholic drinks market size is forecast to increase by USD 728.9 billion, at a CAGR of 7% between 2024 and 2029.
- The market is experiencing significant growth, driven by the increasing popularity of the craft alcoholic beverage segment and the rising consumption of alcoholic drinks worldwide. The craft beer and spirits industry, in particular, has seen a wave in demand due to consumers' shifting preferences towards unique, artisanal products. This trend is expected to continue, providing ample opportunities for new entrants and established players alike. However, the market also faces challenges, including the prevalence of counterfeit products, which undermines the reputation and revenue of legitimate players. Regulatory compliance and the rising costs of raw materials are additional challenges that require strategic planning and innovation to mitigate their impact on profitability.
- Companies seeking to capitalize on market opportunities and navigate challenges effectively should focus on product differentiation, supply chain transparency, and regulatory compliance. Additionally, partnerships and collaborations with local distributors and retailers can help expand market reach and enhance brand visibility. The market encompasses a diverse range of products, including beer, wine, and spirits, sold through various channels such as convenience stores, specialty stores, online retailers, and direct-to-consumer sales.
What will be the Size of the Alcoholic Drinks Market during the forecast period?
- According to market research, the global alcoholic beverages market size was valued at over USD 1 trillion in 2020 and is projected to grow at a steady pace. Beer remains the largest segment, accounting for over half of the market share, with mild-lager beer being the most popular variety. Wine and spirits, including craft beer and premium and super-premium offerings of whiskey, wine, and other spirits, also contribute significantly to the market's growth.
- Product innovation, consumer preferences for premium and flavored beverages, and the increasing popularity of online sales channels are key trends driving market expansion. The market's size and diversity offer opportunities for both established and new players, with continued innovation and consumer education key to success.
How is this Alcoholic Drinks Industry segmented?
The alcoholic drinks industry research report provides comprehensive data (region-wise segment analysis), with forecasts and estimates in "USD billion" for the period 2025-2029, as well as historical data from 2019-2023 for the following segments.
- Distribution Channel
- Liquor stores
- Pubs/bars and restaurants
- Internet retailing
- Type
- Beer
- Wine
- Spirits
- RTD pre-mixes
- Cider
- End-Use
- Retail
- Hospitality
- Food Service
- Consumer Segment
- Premium
- Mid-Range
- Economy
- Production Method
- Fermented
- Distilled
- Application
- Social Consumption
- Culinary Use
- Medicinal Use
- Geography
- APAC
- China
- India
- Japan
- South Korea
- Europe
- France
- Germany
- Italy
- UK
- North America
- US
- Canada
- South America
- Middle East and Africa
- APAC
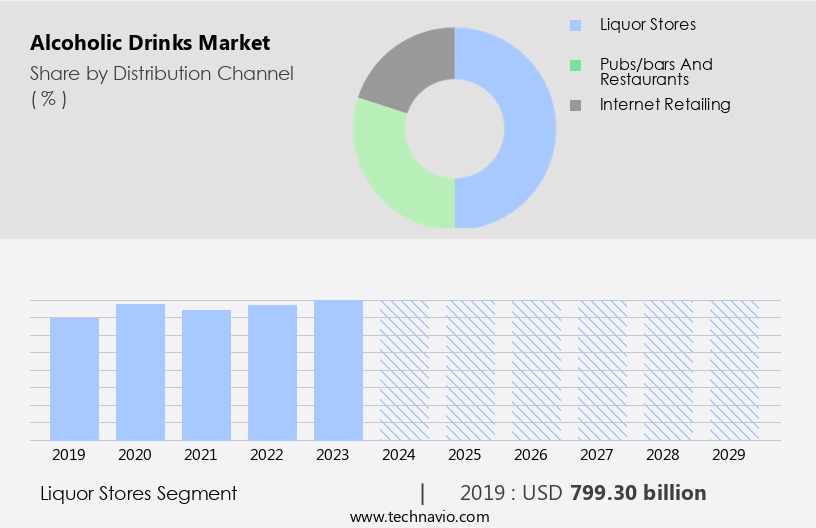
By Distribution Channel Insights
The liquor stores segment is estimated to witness significant growth during the forecast period. The liquor stores segment holds a significant position in The market, acting as specialized retailers catering to consumers seeking a wide array of spirits, wines, and beers. Operating in both urban and rural areas, they serve as a primary channel for procuring alcoholic beverages, offering curated selections, dedicated customer service, and a tailored shopping experience. Liquor stores adhere to specific regulations and licensing requirements, shaping their operational structures. In the market, liquor stores contribute substantially to distribution and accessibility. They provide consumers with a diverse range of product varieties, including premium products, flavored alcohol, light alcoholic beverages, and non-alcoholic drinks.
Consumer preferences for product innovation, health awareness, and natural or exotic ingredients continue to shape market trends. The alcoholic beverages market encompasses various segments, including convenience stores, specialty stores, online retailers, commercial stores, on-premises, and grocery shops. Internet retailing, craft beer, online platforms, hybrid beverages, sparkling wine, fortified wine, and premium alcoholic beverages are other notable segments. The beer market, wine market, and spirits market each exhibit unique growth dynamics, influenced by factors such as social media influence, urban areas, high-pressure jobs, and health consciousness. Alcoholic beverage manufacturers continue to innovate, offering low alcohol content and packaging formats to cater to evolving consumer preferences.
Alcoholic beverages, including flavored wine, premium alcoholic beverages, and super-premium alcoholic beverages, are popular choices for night parties and various social occasions. However, health concerns, such as chronic illnesses like high blood pressure, heart disease, liver disease, and digestive issues, influence consumer choices and market trends. The liquor stores segment plays a crucial role in The market, offering a specialized retail experience and contributing significantly to distribution and accessibility. Consumer preferences, product innovation, and health awareness continue to shape market trends across various segments, including beer, wine, and spirits.
Get a glance at the market report of share of various segments Request Free Sample
The liquor stores segment was valued at USD 799.30 billion in 2019 and showed a gradual increase during the forecast period.
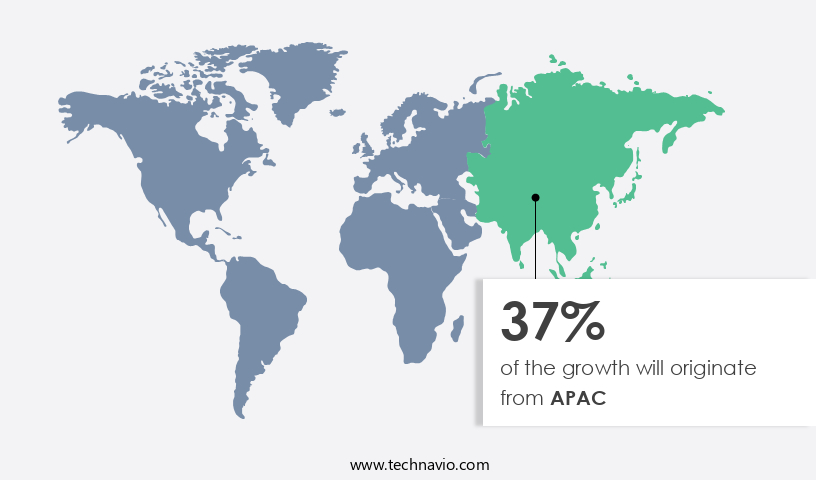
Regional Analysis
APAC is estimated to contribute 37% to the growth of the global market during the forecast period. Technavio's analysts have elaborately explained the regional trends and drivers that shape the market during the forecast period.
For more insights on the market size of various regions, Request Free Sample
The market in APAC is experiencing significant growth due to increasing disposable income, Westernization, and lifestyle changes. India is a significant contributor to this market, particularly in the whiskey segment, which holds a substantial share in APAC. Key countries, including China, Japan, Australia, South Korea, Vietnam, Taiwan, and others, are also driving market expansion. India ranks as the second-largest importer of Scotch whiskey, following France and the US. Consumer preferences lean towards premium and super-premium spirits, with millennials showing a notable inclination. Product innovation, health awareness, and the rise of online sales further influence market trends. The market encompasses beer, wine, spirits, flavored alcohol, non-alcoholic beverages, and others.
Packaging formats, such as plastic bottles and glass bottles, cater to diverse consumer preferences. Online platforms, convenience stores, specialty stores, liquor stores, grocery shops, and commercial stores are key distribution channels. Health consciousness and chronic illnesses, including high blood pressure, heart disease, and liver disease, are influencing consumer choices. Distilled spirits, craft beer, fortified wine, sparkling wine, and hybrid beverages are popular categories. Alcoholic content, natural and exotic ingredients, and social media influence are shaping market dynamics.
Market Dynamics
Our researchers analyzed the data with 2024 as the base year, along with the key drivers, trends, and challenges. A holistic analysis of drivers will help companies refine their marketing strategies to gain a competitive advantage.
What are the key market drivers leading to the rise in the adoption of Alcoholic Drinks Industry?
- The increase in popularity of the craft alcoholic beverage segment is the key driver of the market. The craft alcoholic beverage segment is experiencing significant growth in consumer preference due to the unique tastes and flavors it offers. This segment includes craft beer, spirits, and cider. Craft brewers, often small and independent, innovate by interpreting and reimagining traditional styles to create new ones. The distinct flavors of craft beer differentiate it from traditional varieties, making it a preferred choice for consumers seeking product diversity.
- Craft beer is brewed using different methods and served fresh in various packaging options such as cans, bottles, and kegs. Popular craft beer styles include American Amber Ale, American Barley Wine, American Sour, Barrel-Aged Beer, and English-Style Pale Ale, among others. The popularity of craft alcoholic beverages is driven by their unique characteristics and the desire for product differentiation.
What are the market trends shaping the Alcoholic Drinks Industry?
- Increasing consumption of alcoholic drinks is the upcoming market trend. In developing economies, including India, China, Indonesia, and Singapore, the demand for alcoholic drinks is experiencing significant growth. Key factors fueling this trend are the increasing preference for premium alcoholic beverages and the expanding middle-class population with higher disposable incomes.
- Producers' initiatives to expand distribution channels, such as online stores and convenience stores, are also driving market expansion. Urbanization and evolving social norms have led to a greater acceptance of alcoholic drinks at social events and gatherings. This dynamic market is witnessing continuous growth due to these significant factors.
What challenges does the Alcoholic Drinks Industry face during its growth?
- The prominence of counterfeit products is a key challenge affecting the industry growth. The market faces a significant challenge from the proliferation of counterfeit alcoholic beverages. These products, made from substandard raw materials, pose health risks to consumers and result in substantial revenue losses for manufacturers worldwide. Counterfeit alcoholic beverages, also known as unrecorded or non-commercial alcoholic beverages, tarnish brand reputation and impede sales.
- The market for these illicit items is rampant in numerous countries and frequently reported through various channels, including news outlets, social media platforms, and public announcements. The health hazards associated with consuming counterfeit alcoholic beverages are a major concern, as they can lead to serious health issues. The impact on sales is equally detrimental, as manufacturers lose revenue to counterfeiters and legitimate sales are hindered.
Exclusive Customer Landscape
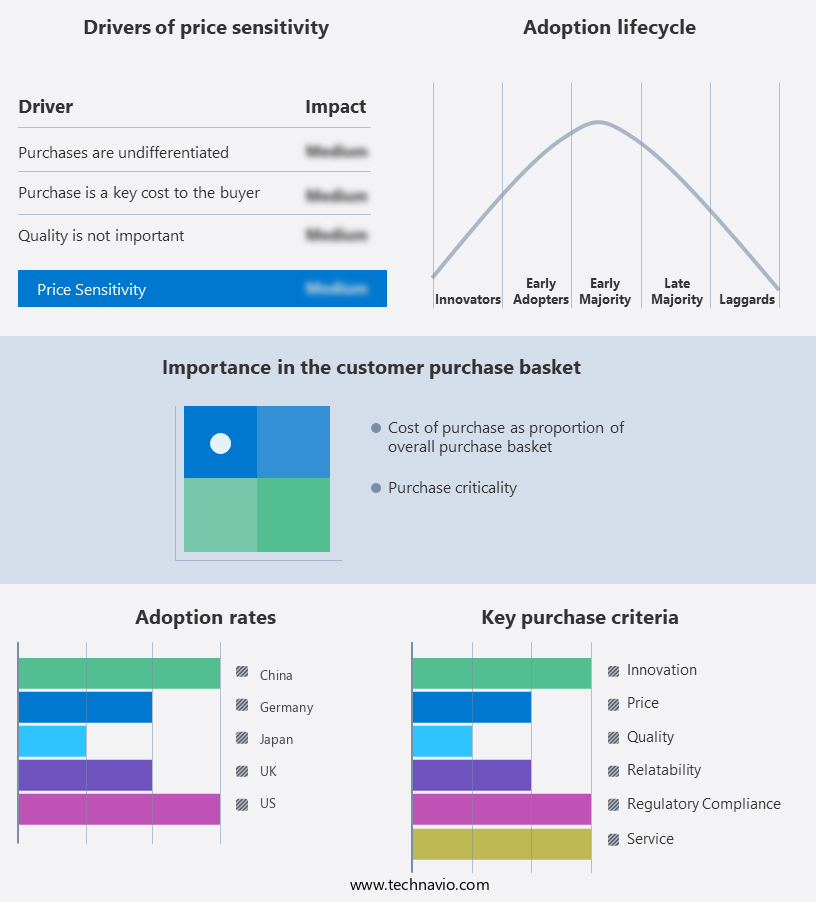
The alcoholic drinks market forecasting report includes the adoption lifecycle of the market, covering from the innovator's stage to the laggard's stage. It focuses on adoption rates in different regions based on penetration. Furthermore, the alcoholic drinks market report also includes key purchase criteria and drivers of price sensitivity to help companies evaluate and develop their market growth analysis strategies.
Customer Landscape
Key Companies & Market Insights
Companies are implementing various strategies, such as strategic alliances, alcoholic drinks market forecast, partnerships, mergers and acquisitions, geographical expansion, and product/service launches, to enhance their presence in the industry.
Aceo Ltd. - The company offers alcoholic drinks such as The Glenlee whisky, Coleburn Selection and Emerald Isle.
The industry research and growth report includes detailed analyses of the competitive landscape of the market and information about key companies, including:
- Allied Blenders and Distillers Ltd
- Bacardi and Co. Ltd.
- Budweiser
- Carlsberg Breweries AS
- Concha y Toro
- Diageo PLC
- E. and J. Gallo Winery
- Heineken NV
- Jack Daniels
- Koskenkorva Vodka
- Molson Coors Beverage Co.
- Pernod Ricard France
- Pierre Chainier SAS
- Suntory Beverage and Food Ltd.
- SVEDKA Vodka
- The Boston Beer Co. Inc.
- The Edrington Group Ltd.
- The Wine Group LLC
- Treasury Wine Estates Ltd.
Qualitative and quantitative analysis of companies has been conducted to help clients understand the wider business environment as well as the strengths and weaknesses of key industry players. Data is qualitatively analyzed to categorize companies as pure play, category-focused, industry-focused, and diversified; it is quantitatively analyzed to categorize companies as dominant, leading, strong, tentative, and weak.
Research Analyst Overview
The market encompasses a wide array of product categories, including beer, wine, and spirits, each exhibiting unique market dynamics. These beverages are retailed through various channels, such as convenience stores, specialty stores, commercial stores, on-premises establishments, and online retailers. Beer, a popular choice among consumers, continues to dominate the market due to its wide appeal and versatility. Consumers' preferences for product varieties, including craft beer and flavored beer, drive innovation within the beer market. Wine, another significant segment, is experiencing growth due to the increasing popularity of sparkling wine and fortified wine. The spirits market, which includes premium products like whiskey and vodka, benefits from the health-conscious trend, with consumers opting for super-premium alcoholic beverages.
Further, the emergence of hybrid beverages, which combine alcoholic and non-alcoholic components, offers an intriguing alternative for consumers seeking to reduce their alcohol intake. Non-alcoholic beverages, including energy drinks and non-alcoholic spirits, cater to the growing health and well-being trend. These beverages address various health concerns, such as chronic illnesses like high blood pressure, heart disease, and liver disease, as well as digestive issues. The advent of online platforms and sales channels has significantly impacted the alcoholic beverages industry. Consumers' increasing reliance on the internet for purchasing alcoholic beverages, particularly during the pandemic, has led to a wave in online sales.
Additionally, the convenience and accessibility offered by online retailers have attracted a younger demographic, including the youth population. Product innovation remains a key driver in the alcoholic beverages market. Manufacturers continue to introduce new product lines, focusing on natural and exotic ingredients, to cater to evolving consumer preferences. The use of sustainable packaging formats, such as plastic and glass bottles, further enhances the appeal of these products. Health awareness and concerns regarding alcohol poisoning have led to a growing trend toward low-alcohol and light-alcoholic beverages. Social media influence and urban areas, characterized by high-pressure jobs, contribute to the popularity of these beverages among the younger population.
|
Market Scope |
|
|
Report Coverage |
Details |
|
Page number |
207 |
|
Base year |
2024 |
|
Historic period |
2019-2023 |
|
Forecast period |
2025-2029 |
|
Growth momentum & CAGR |
Accelerate at a CAGR of 7% |
|
Market Growth 2025-2029 |
USD 728.9 billion |
|
Market structure |
Fragmented |
|
YoY growth 2024-2025(%) |
6.8 |
|
Key countries |
US, China, Germany, Japan, UK, India, Canada, France, South Korea, and Italy |
|
Competitive landscape |
Leading Companies, Market Positioning of Companies, Competitive Strategies, and Industry Risks |
What are the Key Data Covered in this Alcoholic Drinks Market Research and Growth Report?
- CAGR of the Alcoholic Drinks industry during the forecast period
- Detailed information on factors that will drive the market growth and forecasting between 2025 and 2029
- Precise estimation of the size of the market and its contribution to the industry in focus on the parent market
- Accurate predictions about upcoming growth trends and changes in consumer behavior
- Growth of the market across APAC, Europe, North America, South America, and the Middle East and Africa
- A thorough analysis of the market's competitive landscape and detailed information about companies
- Comprehensive analysis of factors that will challenge the alcoholic drinks market growth and forecasting
We can help! Our analysts can customize this alcoholic drinks market research report to meet your requirements.
 RIA -
RIA - 
