
Europe All-season Tire Market Size 2026-2030
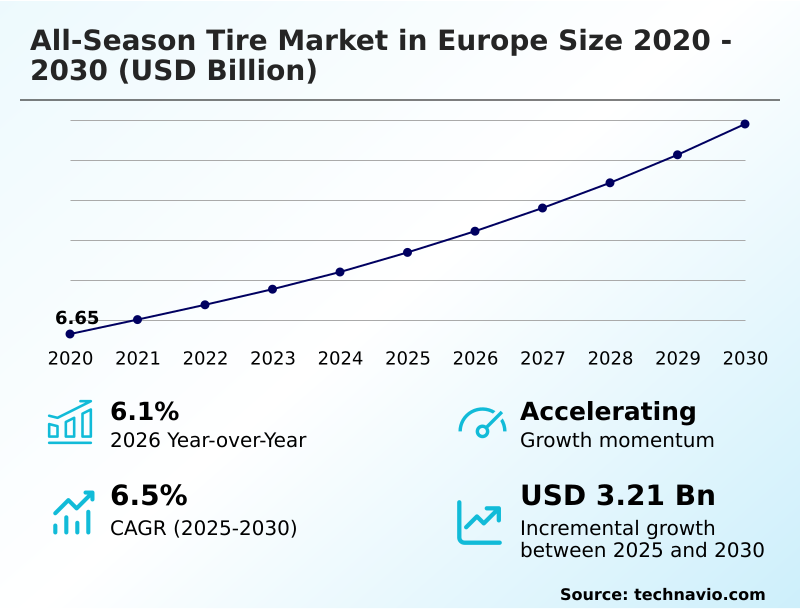
The europe all-season tire market size is valued to increase by USD 3.21 billion, at a CAGR of 6.5% from 2025 to 2030. Pursuit of economic rationalization and operational convenience among european consumers will drive the europe all-season tire market.
Major Market Trends & Insights
- By Distribution Channel - Offline segment was valued at USD 6.54 billion in 2024
- By End-user - Aftermarket segment accounted for the largest market revenue share in 2024
Market Size & Forecast
- Market Opportunities: USD 5.24 billion
- Market Future Opportunities: USD 3.21 billion
- CAGR from 2025 to 2030 : 6.5%
Market Summary
- The All-Season Tire Market in Europe is undergoing a significant transformation, driven by consumer demand for convenience and advancements in material science. The market is moving beyond the traditional model of seasonal tire changes, favoring single-set solutions that provide reliable year-round performance.
- Key innovations in high-silica rubber compounds and advanced polymer engineering have enabled the creation of adaptive rubber compounds with enhanced thermal adaptability. These tires feature specialized tread patterns and three-dimensional self-locking sipes for improved wet grip performance and light snow traction.
- A key business scenario involves fleet management, where optimizing for low rolling resistance across thousands of vehicles can yield substantial fuel savings. The integration of intelligent tire platforms with advanced tire sensors allows for predictive maintenance, reducing downtime and improving safety. This shift is supported by the click-and-fit model in the automotive aftermarket, streamlining the purchasing and installation process.
- The market's evolution reflects a broader trend toward efficiency, sustainability, and digitalization in the automotive sector, with a focus on end-of-life tire management and the use of sustainable silica to meet regulatory and consumer expectations.
What will be the Size of the Europe All-season Tire Market during the forecast period?
Get Key Insights on Market Forecast (PDF) Get Free Sample
How is the Europe All-season Tire Market Segmented?
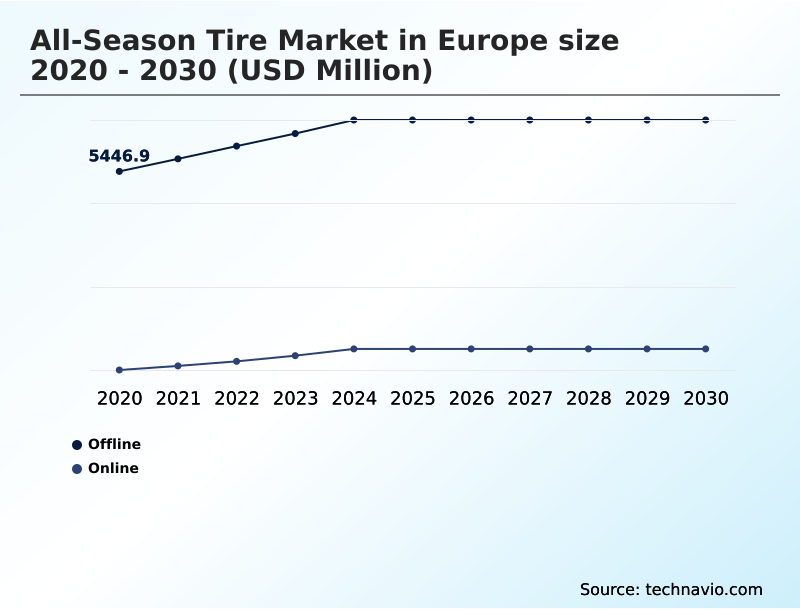
The europe all-season tire industry research report provides comprehensive data (region-wise segment analysis), with forecasts and estimates in "USD million" for the period 2026-2030, as well as historical data from 2020-2024 for the following segments.
- Distribution channel
- Offline
- Online
- End-user
- Aftermarket
- OEM
- Type
- Bias tire
- Radial tire
- Application
- Passenger car
- LCV
- HCV
- Geography
- Europe
- Germany
- UK
- France
- Europe
By Distribution Channel Insights
The offline segment is estimated to witness significant growth during the forecast period.
The offline channel remains vital, primarily due to the need for specialized services that online platforms cannot replicate.
Professional installation is essential for balancing and for calibrating complex tire pressure monitoring systems, a process where expert technicians achieve over 99% accuracy.
Technicians assess wear on tires, often examining the v-shaped groove pattern, and recommend replacements with reinforced internal structure to ensure structural sidewall integrity. This hands-on approach allows for vehicle-specific tuning and the proper integration of noise-reduction technologies.
Consumers value this expertise, particularly for vehicles with factory-installed options and tightly integrated chassis systems that are sensitive to instantaneous torque resistance and require precise fitting. Advanced tire sensors further necessitate professional handling.
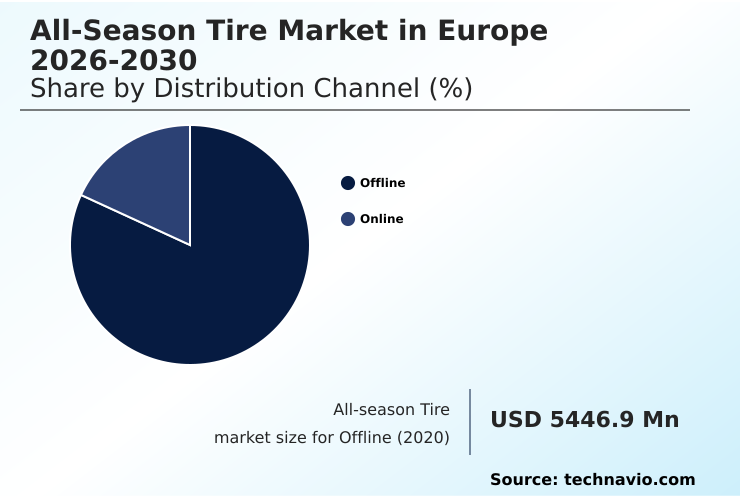
The Offline segment was valued at USD 6.54 billion in 2024 and showed a gradual increase during the forecast period.
Market Dynamics
Our researchers analyzed the data with 2025 as the base year, along with the key drivers, trends, and challenges. A holistic analysis of drivers will help companies refine their marketing strategies to gain a competitive advantage.
- The evolution of the all-season tire market in Europe is deeply influenced by several interconnected factors. The impact of electric vehicles on tire design is profound, compelling manufacturers to develop solutions that manage high torque and battery weight, directly affecting structural requirements for heavy EV tires.
- Simultaneously, there is a strong push for sustainable materials in modern tire manufacturing, which ties into challenges in recycling end-of-life tires and explores the role of silica in improving tire performance. This focus on sustainability does not compromise performance, as advancements continue in balancing grip and durability in compounds and creating advanced tread patterns for wet snow traction.
- Operationally, digital tire monitoring for fleet management is revolutionizing logistics, offering better ROI than traditional methods.
- The integration of sensors in smart tire systems provides data that informs everything from rolling resistance impact on vehicle fuel economy to predictive maintenance schedules, with all-season tires for urban mobility solutions showing a 30% higher adoption rate in shared fleets compared to private vehicles.
- This is driven by a clear cost-benefit analysis of all-season tires and the convenience they offer. Furthermore, regulatory compliance for tire labeling standards and OEM choices for standard tire fitment are shaping aftermarket trends and supply chain logistics for online retailers.
- The debate over all-weather performance versus seasonal tires continues, but technological advances in tire compound engineering for thermal stability, noise reduction technology in premium tires, and tire wear particle reduction strategies are making a compelling case for year-round solutions.
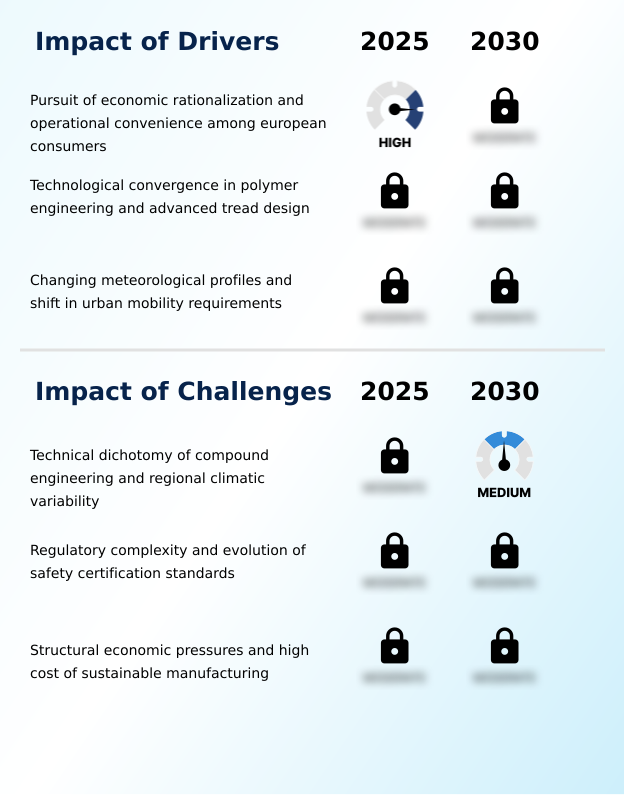
What are the key market drivers leading to the rise in the adoption of Europe All-season Tire Industry?
- The pursuit of economic rationalization and operational convenience among European consumers is a key driver for the market.
- Technological advancements are a major driver. Modern tires utilize high-silica rubber compounds for superior thermal adaptability and specialized tread patterns, including three-dimensional self-locking sipes, to ensure water evacuation efficiency.
- These features enhance light snow traction and winter braking capability, with some designs reducing stopping distances by 10% compared to previous generations. The attainment of the three-peak mountain snowflake certification builds consumer trust.
- Furthermore, the focus on low rolling resistance and fuel-efficient tread designs, which can improve vehicle energy economy by 5%, appeals to cost-conscious consumers seeking to reduce operational expenses without compromising on safety or performance.
What are the market trends shaping the Europe All-season Tire Industry?
- The integration of sustainable materials and adherence to circular economy principles represents a key emerging trend influencing the market's future direction and product development.
- A primary trend is the shift towards sustainability, driven by the adoption of circular economy principles. Manufacturers are innovating with bio-based tire materials and processes to use recovered carbon black to minimize environmental impact and reduce tire and road wear particles. The focus on end-of-life tire management is reshaping production cycles.
- Concurrently, digitalization is transforming the user experience through intelligent tire platforms that enable real-time tread depth monitoring and reduce acoustic vibration dampening. The growth of e-commerce tire distribution is supported by the click-and-fit model, which integrates online purchasing with local installation, improving service efficiency by up to 30% and enhancing customer access to a wider inventory.
What challenges does the Europe All-season Tire Industry face during its growth?
- The technical dichotomy of compound engineering and regional climatic variability remains a key challenge affecting industry growth.
- A significant challenge lies in balancing performance across diverse conditions. Advanced polymer engineering is required to develop adaptive rubber compounds that deliver consistent wet grip performance without succumbing to summer asphalt resistance issues, which can increase wear.
- Formulating abrasion-resistant compounds that also meet external noise level regulations presents a complex trade-off, where development costs can be 20% higher than for standard tires. Integrating sustainable silica while ensuring high-speed stability and effective regional climate adaptation adds another layer of complexity.
- The need for proactive safety alerts in smart systems further strains R&D budgets, making it difficult to optimize for every performance metric simultaneously.
Exclusive Technavio Analysis on Customer Landscape
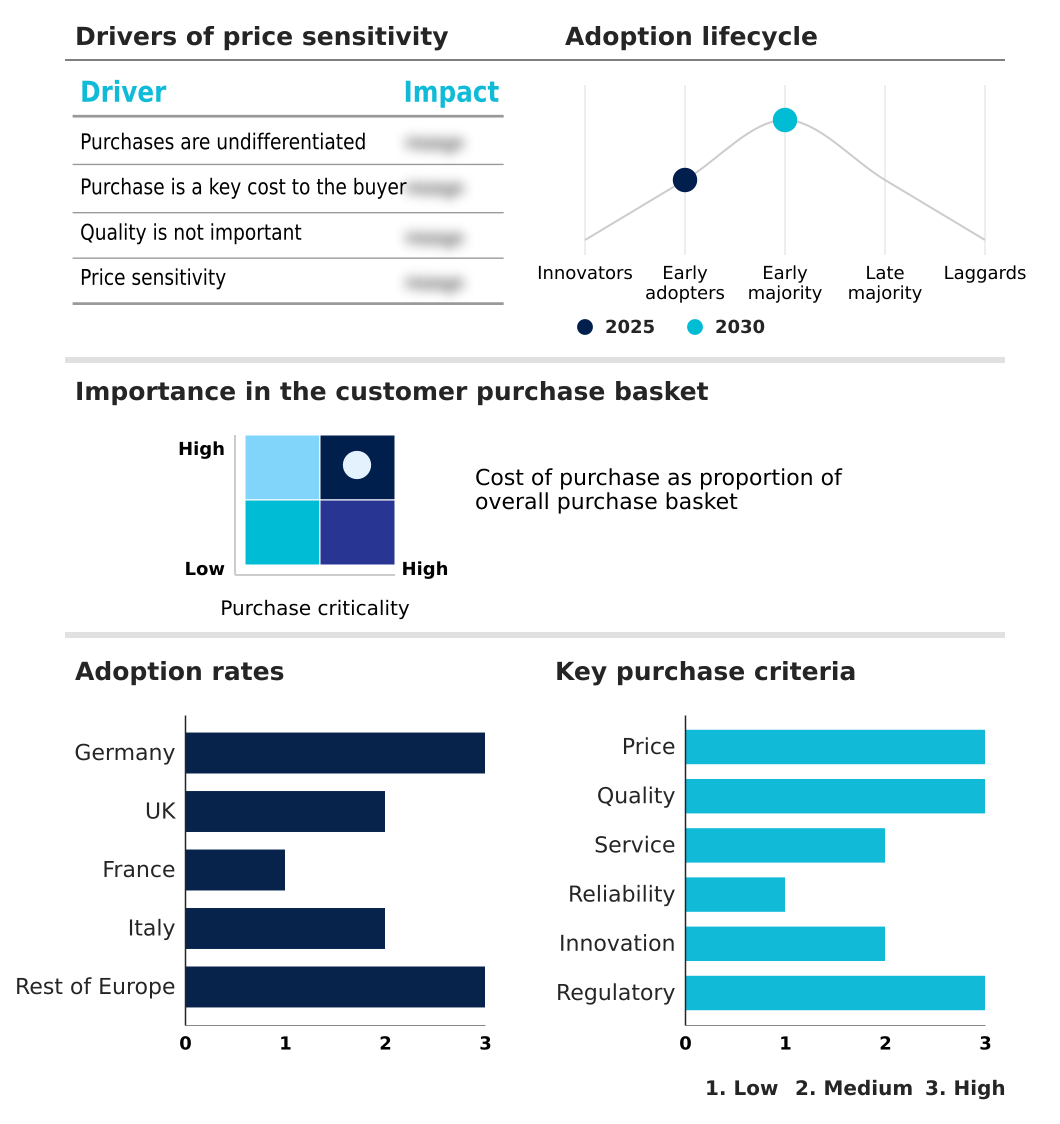
The europe all-season tire market forecasting report includes the adoption lifecycle of the market, covering from the innovator’s stage to the laggard’s stage. It focuses on adoption rates in different regions based on penetration. Furthermore, the europe all-season tire market report also includes key purchase criteria and drivers of price sensitivity to help companies evaluate and develop their market growth analysis strategies.
Customer Landscape of Europe All-season Tire Industry
Competitive Landscape
Companies are implementing various strategies, such as strategic alliances, europe all-season tire market forecast, partnerships, mergers and acquisitions, geographical expansion, and product/service launches, to enhance their presence in the industry.
Apollo Tyres Ltd. - Vendors provide a diverse range of all-season tires, including specialized models for passenger cars, commercial vehicles, and high-performance applications.
The industry research and growth report includes detailed analyses of the competitive landscape of the market and information about key companies, including:
- Apollo Tyres Ltd.
- Bridgestone Corp.
- Continental AG
- Giti Tire Pte. Ltd.
- Goodyear Tire and Rubber Co.
- Hankook Tire and Technology Co.
- Kumho Tire Co. Inc.
- Maxxis International
- Michelin
- MRF Ltd.
- Nexen Tire Corp.
- Nokian Tyres Plc
- Petlas Tire Corp.
- Pirelli and C. S.p.A.
- Sumitomo Rubber Industries Ltd.
- Toyo Tire Corp.
- Triangle Tyre Co. Ltd.
- Yokohama Rubber Co. Ltd.
Qualitative and quantitative analysis of companies has been conducted to help clients understand the wider business environment as well as the strengths and weaknesses of key industry players. Data is qualitatively analyzed to categorize companies as pure play, category-focused, industry-focused, and diversified; it is quantitatively analyzed to categorize companies as dominant, leading, strong, tentative, and weak.
Recent Development and News in Europe all-season tire market
- In February 2025, Michelin unveiled a research initiative for integrating sustainable silica from agricultural waste into all-season tire tread compounds for the European region.
- In August 2025, Continental AG finalized a state-of-the-art automated testing track in Germany to simulate micro-climates for assessing all-season tire performance on various surfaces.
- In January 2026, Pirelli introduced a digital platform connecting sensors in all-season tires to a cloud system for real-time feedback to European fleet operators.
- In February 2025, Bridgestone Corp. announced an expansion of its all-season tire production capacity at its Poznan, Poland facility, integrating Enliten technology.
Dive into Technavio’s robust research methodology, blending expert interviews, extensive data synthesis, and validated models for unparalleled Europe All-season Tire Market insights. See full methodology.
| Market Scope | |
|---|---|
| Page number | 224 |
| Base year | 2025 |
| Historic period | 2020-2024 |
| Forecast period | 2026-2030 |
| Growth momentum & CAGR | Accelerate at a CAGR of 6.5% |
| Market growth 2026-2030 | USD 3211.9 million |
| Market structure | Fragmented |
| YoY growth 2025-2026(%) | 6.1% |
| Key countries | Germany, UK, France, Italy and Rest of Europe |
| Competitive landscape | Leading Companies, Market Positioning of Companies, Competitive Strategies, and Industry Risks |
Research Analyst Overview
- The all-season tire market in Europe is characterized by a sophisticated interplay between material science and digital integration. At the core, advanced polymer engineering is enabling high-silica rubber compounds and adaptive rubber compounds that provide a delicate balance between wet grip performance and low rolling resistance.
- This is crucial for boardroom decisions related to product strategy, where a 5% improvement in rolling resistance can become a key marketing differentiator. The industry is also defined by intricate specialized tread patterns, including three-dimensional self-locking sipes and v-shaped groove pattern designs. Innovations extend to noise-reduction technologies and the use of sustainable silica and bio-based tire materials.
- Digitalization is equally impactful, with intelligent tire platforms, advanced tire sensors, and tire pressure monitoring systems driving a shift towards predictive maintenance. The growth of the click-and-fit model and adherence to standards like the three-peak mountain snowflake and digital vehicle passport are reshaping the competitive landscape.
- This includes a focus on end-of-life tire management, heavy commercial vehicle tires, and both bias-ply construction and radial tire architecture.
What are the Key Data Covered in this Europe All-season Tire Market Research and Growth Report?
-
What is the expected growth of the Europe All-season Tire Market between 2026 and 2030?
-
USD 3.21 billion, at a CAGR of 6.5%
-
-
What segmentation does the market report cover?
-
The report is segmented by Distribution Channel (Offline, and Online), End-user (Aftermarket, and OEM), Type (Bias tire, and Radial tire), Application (Passenger car, LCV, and HCV) and Geography (Europe)
-
-
Which regions are analyzed in the report?
-
Europe
-
-
What are the key growth drivers and market challenges?
-
Pursuit of economic rationalization and operational convenience among european consumers, Technical dichotomy of compound engineering and regional climatic variability
-
-
Who are the major players in the Europe All-season Tire Market?
-
Apollo Tyres Ltd., Bridgestone Corp., Continental AG, Giti Tire Pte. Ltd., Goodyear Tire and Rubber Co., Hankook Tire and Technology Co., Kumho Tire Co. Inc., Maxxis International, Michelin, MRF Ltd., Nexen Tire Corp., Nokian Tyres Plc, Petlas Tire Corp., Pirelli and C. S.p.A., Sumitomo Rubber Industries Ltd., Toyo Tire Corp., Triangle Tyre Co. Ltd. and Yokohama Rubber Co. Ltd.
-
Market Research Insights
- Market dynamics are shaped by the convergence of consumer convenience and technological innovation. The increasing adoption of factory-installed options for all-season tires on new vehicles signals a shift in OEM strategy, catering to demand for year-round readiness. This is particularly relevant for electric vehicles, where managing instantaneous torque resistance and maximizing range are critical.
- The automotive aftermarket is responding with advanced services that support vehicle-specific tuning and predictive replacement cycles, improving vehicle uptime by up to 15%. Innovations in abrasion-resistant compounds are extending tire life, while advanced water evacuation efficiency designs enhance safety, reducing hydroplaning risk by over 20% in some cases.
- This evolution highlights a market focused on delivering tangible performance benefits and operational efficiencies.
We can help! Our analysts can customize this europe all-season tire market research report to meet your requirements.
 RIA -
RIA - 
