Aluminum Scrap Recycling Market Size 2026-2030
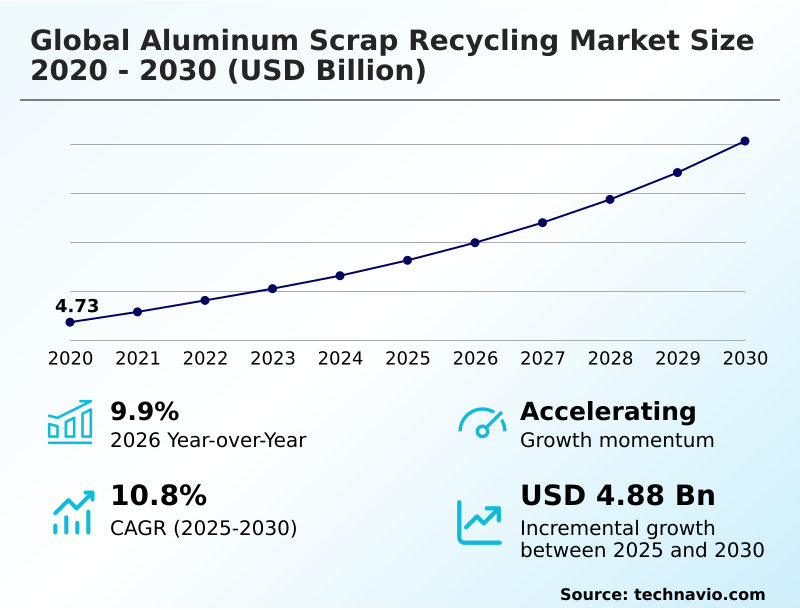
The aluminum scrap recycling market size is valued to increase by USD 4.88 billion, at a CAGR of 10.8% from 2025 to 2030. Superior economic viability and energy conservation imperatives will drive the aluminum scrap recycling market.
Major Market Trends & Insights
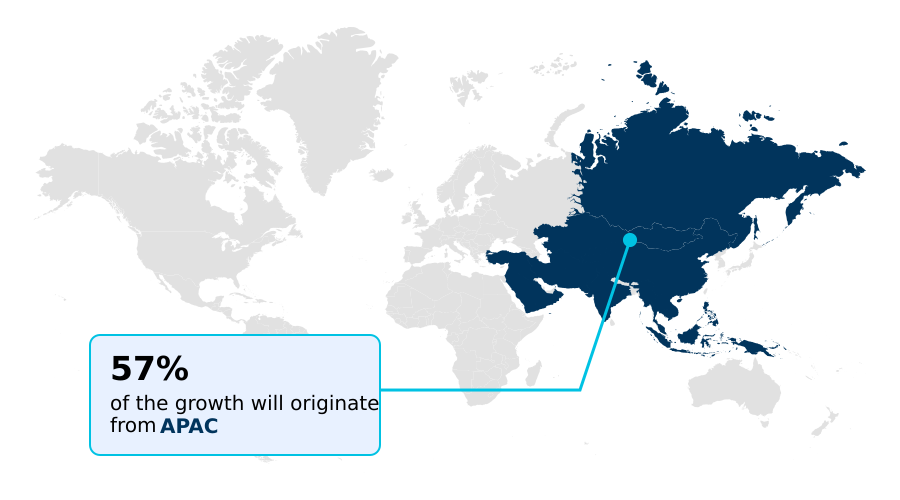
- APAC dominated the market and accounted for a 56.9% growth during the forecast period.
- By End-user - Casting segment was valued at USD 4.35 billion in 2024
- By Type - Old scrap segment accounted for the largest market revenue share in 2024
Market Size & Forecast
- Market Opportunities: USD 7.41 billion
- Market Future Opportunities: USD 4.88 billion
- CAGR from 2025 to 2030 : 10.8%
Market Summary
- The aluminum scrap recycling market is undergoing a strategic transformation, driven by the global imperative for decarbonization and a circular economy. Superior economic viability and significant energy savings make secondary aluminum production a compelling alternative to primary smelting.
- This shift is supported by intensifying regulatory frameworks, including recycled content mandates and extended producer responsibility schemes, which create secure demand for furnace-ready materials. However, the industry grapples with persistent challenges, primarily scrap contamination and alloy heterogeneity, which complicate wrought alloy recovery and risk downcycling.
- For instance, an automotive manufacturer aiming for closed-loop recycling systems must implement rigorous post-industrial scrap segregation at its stamping plants to prevent alloy cross-contamination. Success hinges on advanced sorting technologies like laser-induced breakdown spectroscopy and X-ray fluorescence to ensure high-purity alloy segregation and maintain material value, reinforcing resource security enhancement and circular supply chain development.
What will be the Size of the Aluminum Scrap Recycling Market during the forecast period?
Get Key Insights on Market Forecast (PDF) Get Free Sample
How is the Aluminum Scrap Recycling Market Segmented?
The aluminum scrap recycling industry research report provides comprehensive data (region-wise segment analysis), with forecasts and estimates in "USD million" for the period 2026-2030, as well as historical data from 2020-2024 for the following segments.
- End-user
- Casting
- Downstream
- Type
- Old scrap
- New scrap
- Application
- Building and construction
- Automotive
- Electrical and electronics
- Aerospace and defense
- Others
- Geography
- APAC
- China
- India
- Japan
- North America
- US
- Canada
- Mexico
- Europe
- Germany
- UK
- The Netherlands
- Middle East and Africa
- UAE
- Saudi Arabia
- Turkey
- South America
- Brazil
- Argentina
- Rest of World (ROW)
- APAC
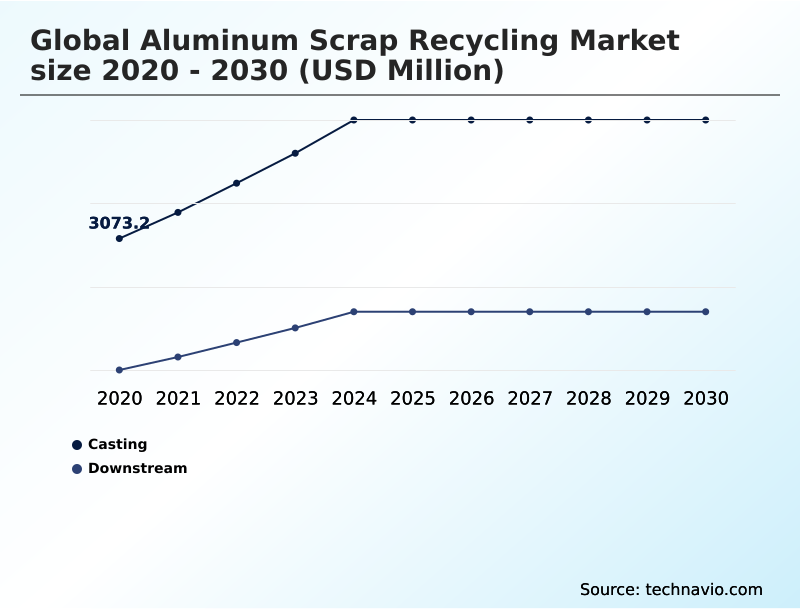
By End-user Insights
The casting segment is estimated to witness significant growth during the forecast period.
The casting segment is a cornerstone of secondary aluminum production, absorbing varied scrap grades, including mixed post-consumer material unsuitable for more demanding wrought alloy recovery.
Its pivotal role is defined by the inherent tolerance of secondary casting alloys to certain tramp elements, making it an essential destination for complex feedstocks from end-of-life vehicles and demolition.
Demand is robust, driven by the automotive sector's need for components like engine blocks and transmission housings. Advanced shredding technology and Zorba fraction processing are vital for preparing this material.
Successful operations achieve high metallic yields, with some facilities improving dross processing optimization by over 15%, which is crucial for profitability and downcycling prevention in the aluminum scrap recycling market.
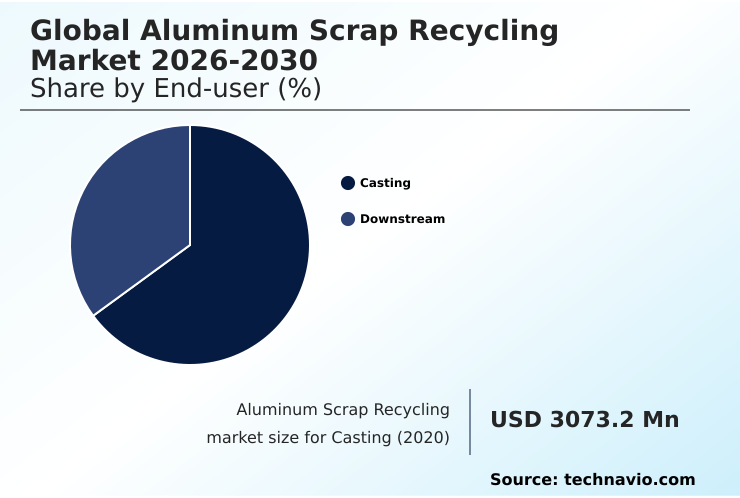
The Casting segment was valued at USD 4.35 billion in 2024 and showed a gradual increase during the forecast period.
Regional Analysis
APAC is estimated to contribute 56.9% to the growth of the global market during the forecast period.Technavio’s analysts have elaborately explained the regional trends and drivers that shape the market during the forecast period.
See How Aluminum Scrap Recycling Market Demand is Rising in APAC Get Free Sample
The geographic landscape is led by APAC, which accounts for 56.9% of the market's incremental growth, driven by its massive manufacturing base and rapid urbanization.
China and India are pivotal, with government initiatives promoting a circular economy and resource security enhancement. North America, contributing 18.34% of growth, benefits from a mature scrap collection infrastructure and advanced secondary aluminum production.
The region's focus on automotive lightweighting creates strong demand for high-quality recycled alloys.
Europe's market is defined by stringent environmental regulations, including recycled content mandates, which support robust post-consumer scrap valorization and investment in advanced sorting technologies like eddy current separators to improve Zorba fraction processing.
Market Dynamics
Our researchers analyzed the data with 2025 as the base year, along with the key drivers, trends, and challenges. A holistic analysis of drivers will help companies refine their marketing strategies to gain a competitive advantage.
- The global aluminum scrap recycling market is increasingly shaped by the economic viability of secondary aluminum production and the need to overcome challenges in recycling post-consumer aluminum scrap. Advancements in laser-induced breakdown spectroscopy and other technologies for segregating wrought and cast alloys are critical for success.
- The role of recycled aluminum in automotive lightweighting is a primary driver, compelling the industry to refine strategies for managing alloy cross-contamination and increasing recycled content in aluminum packaging. Geopolitical risks in global scrap trade and the impact of trade policies on scrap availability remain significant concerns, pushing nations toward urban mining for sustainable raw materials and greater resource security.
- Comparing old scrap vs. new scrap processing highlights the capital investment in advanced sorting equipment required to handle complex streams. Effective management of dross formation in remelting processes and meeting quality specifications for furnace-ready scrap are vital for profitability.
- Supply chain integration for closed-loop systems is now a competitive differentiator, especially as secondary aluminum is crucial for green building certifications, delivering environmental benefits that aluminum scrap recycling cannot match. This integration has been shown to improve feedstock consistency by over 20% in some automotive supply chains.
- The future hinges on optimizing energy use in secondary aluminum smelters and the broader valorization of complex aluminum scrap streams, driven by regulatory drivers for aluminum recycling rates.
What are the key market drivers leading to the rise in the adoption of Aluminum Scrap Recycling Industry?
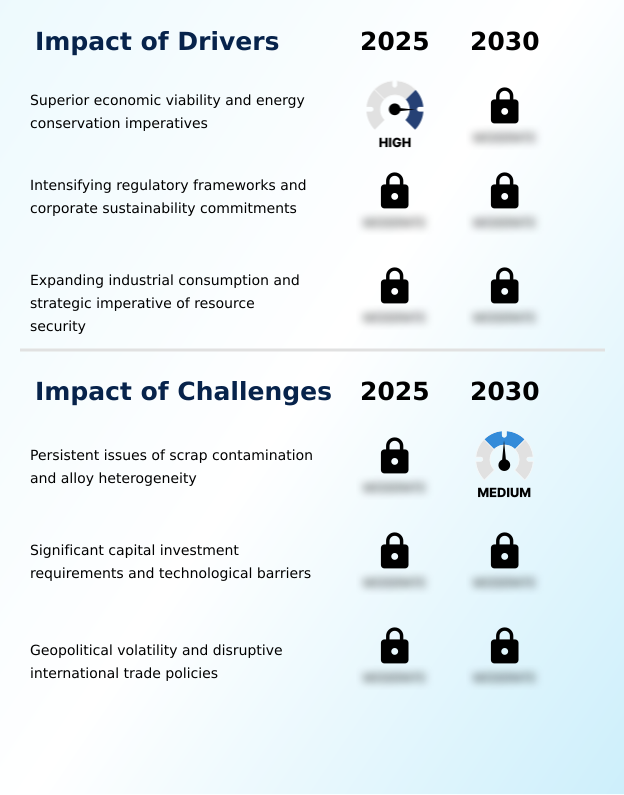
- The superior economic viability of secondary production, coupled with significant energy conservation imperatives, serves as a foundational driver for the market.
- Market growth is propelled by powerful economic and environmental drivers. The superior economic viability and energy conservation of secondary aluminum production—requiring up to 95% less energy than primary production—create a persistent commercial incentive.
- This advantage is amplified by intensifying regulatory frameworks and corporate sustainability commitments, including recycled content mandates that secure demand. Furthermore, expanding industrial consumption and the strategic imperative of resource security are crucial.
- A robust domestic recycling industry, which leverages urban mining feedstock, insulates economies from geopolitical risks associated with bauxite supply chains, improving national resource security by more than 20% in some import-dependent regions.
What are the market trends shaping the Aluminum Scrap Recycling Industry?
- The proliferation of advanced sorting and purification technologies is a transformative trend. It signals a move toward highly automated, sensor-based systems that enhance segregation accuracy and efficiency.
- Key trends are reshaping the market, led by the strategic shift toward integrated, closed-loop recycling systems and supply chain integration. This approach preserves the value of high-performance alloys and has been shown to reduce the need for primary metal inputs by up to 40% in certain automotive manufacturing loops.
- Concurrently, there is an intensified focus on urban mining and post-consumer scrap valorization, essential for expanding the resource base. This is enabled by the proliferation of advanced sorting and purification technologies, including laser-induced breakdown spectroscopy and X-ray fluorescence, which improve sorting accuracy by over 98%. These trends enhance resource efficiency metrics and support sustainable materials sourcing.
What challenges does the Aluminum Scrap Recycling Industry face during its growth?
- Persistent issues of scrap contamination and alloy heterogeneity present a core challenge, constraining the profitability and full potential of the sector.
- The industry faces significant operational and financial challenges. Persistent issues of scrap contamination and alloy heterogeneity, particularly in post-consumer streams, constrain the production of high-quality secondary metal and can reduce metallic yield by up to 15%. This is compounded by the significant capital investment requirements and technological barriers associated with state-of-the-art sorting and purification equipment.
- Geopolitical volatility and disruptive international trade policies, such as sudden scrap import/export regulations, create further uncertainty. These policies can alter aluminum scrap trade flows overnight, causing price volatility and disrupting established circular supply chain development efforts.
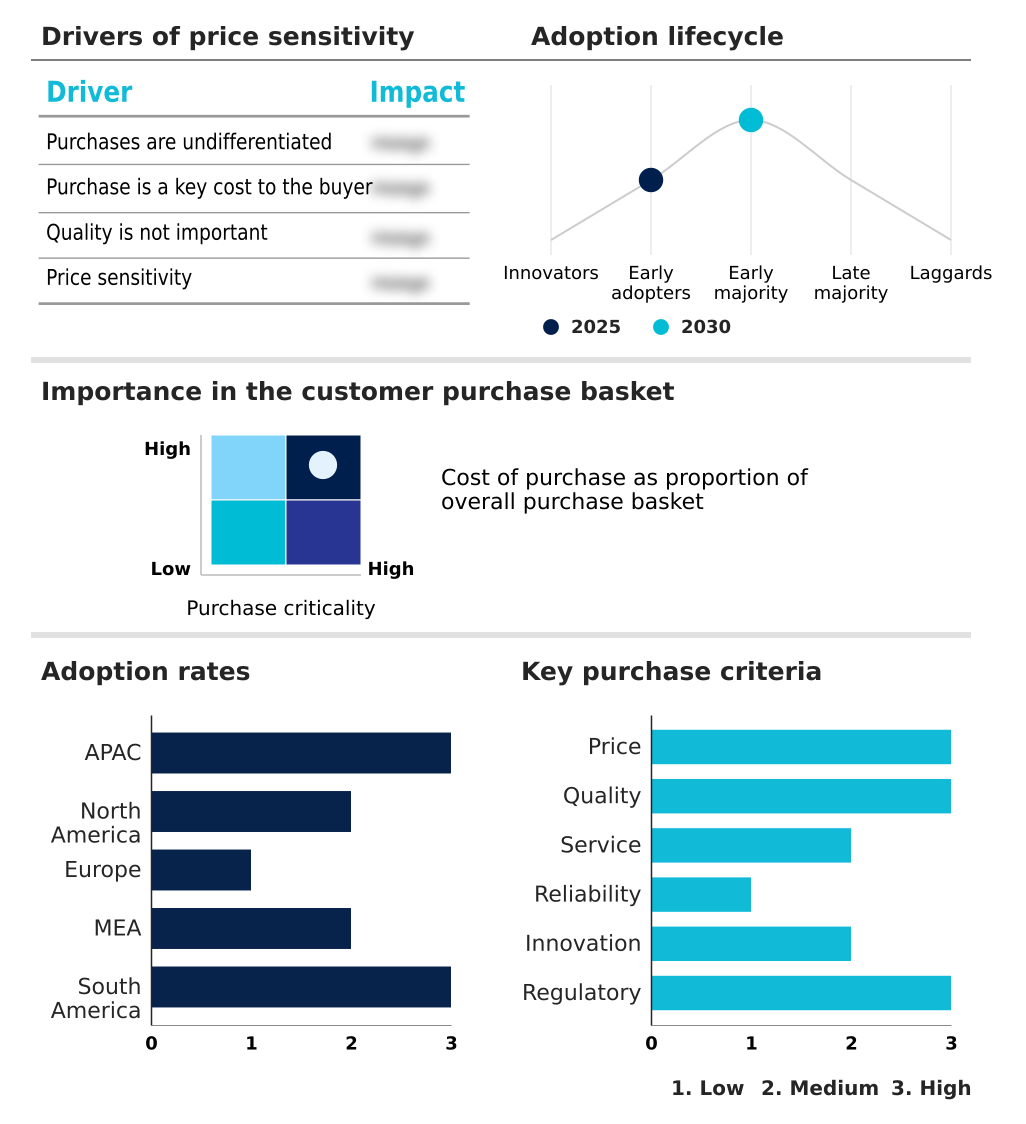
Exclusive Technavio Analysis on Customer Landscape
The aluminum scrap recycling market forecasting report includes the adoption lifecycle of the market, covering from the innovator’s stage to the laggard’s stage. It focuses on adoption rates in different regions based on penetration. Furthermore, the aluminum scrap recycling market report also includes key purchase criteria and drivers of price sensitivity to help companies evaluate and develop their market growth analysis strategies.
Customer Landscape of Aluminum Scrap Recycling Industry
Competitive Landscape
Companies are implementing various strategies, such as strategic alliances, aluminum scrap recycling market forecast, partnerships, mergers and acquisitions, geographical expansion, and product/service launches, to enhance their presence in the industry.
Alcoa Corp. - Expertise in aluminum scrap recycling provides processed recycled aluminum for casting and downstream applications, aligning with circular economy initiatives and sustainable materials sourcing.
The industry research and growth report includes detailed analyses of the competitive landscape of the market and information about key companies, including:
- Alcoa Corp.
- CASS Inc.
- Chiho Environmental Group Ltd
- Commercial Metals Co.
- Constellium SE
- Crestwood Metal Corp.
- European Metal Recycling Ltd.
- Hindalco Industries
- Koch Enterprises Inc.
- Kuusakoski Oy
- Metal Exchange Corp.
- Norsk Hydro ASA
- Nucor Corp.
- Real Alloy
- RETHMANN SE and Co. KG
- Rio Tinto Ltd.
- Sims Ltd.
- Steel Dynamics Inc.
- Triple M Metal LP
- Ye Chiu Metal Recycling China
Qualitative and quantitative analysis of companies has been conducted to help clients understand the wider business environment as well as the strengths and weaknesses of key industry players. Data is qualitatively analyzed to categorize companies as pure play, category-focused, industry-focused, and diversified; it is quantitatively analyzed to categorize companies as dominant, leading, strong, tentative, and weak.
Recent Development and News in Aluminum scrap recycling market
- In August 2024, Spectro Alloys, part of Emirates Global Aluminium (EGA), initiated expanded production at its Minnesota facility, boosting its role in the global recycling market and deepening its technological expertise.
- In November 2024, the European Union announced forthcoming restrictive measures on aluminum scrap exports, set for spring 2025, to secure regional supply chains and support domestic recycling operations.
- In February 2025, Steel Dynamics' subsidiary, Aluminum Dynamics, launched its $362 million slab-casting and aluminum recycling plant in Villa de Reyes, Mexico, to supply advanced materials for the automotive industry.
- In May 2025, Emirates Global Aluminium (EGA) reported its new 170,000-tonne capacity aluminum recycling facility in the UAE reached 50% completion, marking a major step toward a domestic circular economy.
Dive into Technavio’s robust research methodology, blending expert interviews, extensive data synthesis, and validated models for unparalleled Aluminum Scrap Recycling Market insights. See full methodology.
| Market Scope | |
|---|---|
| Page number | 300 |
| Base year | 2025 |
| Historic period | 2020-2024 |
| Forecast period | 2026-2030 |
| Growth momentum & CAGR | Accelerate at a CAGR of 10.8% |
| Market growth 2026-2030 | USD 4877.5 million |
| Market structure | Fragmented |
| YoY growth 2025-2026(%) | 9.9% |
| Key countries | China, India, Japan, South Korea, Australia, Indonesia, US, Canada, Mexico, Germany, UK, The Netherlands, France, Italy, Spain, UAE, Saudi Arabia, Turkey, South Africa, Israel, Brazil, Argentina and Chile |
| Competitive landscape | Leading Companies, Market Positioning of Companies, Competitive Strategies, and Industry Risks |
Research Analyst Overview
- The aluminum scrap recycling market is advancing beyond simple collection toward sophisticated resource management, essential for industrial decarbonization. Core to this evolution is the deployment of advanced technologies such as sensor-based sorting, laser-induced breakdown spectroscopy, and X-ray fluorescence, which are crucial for alloy heterogeneity management and downcycling prevention.
- These systems enable high-purity alloy segregation, facilitating wrought alloy recovery and the creation of furnace-ready materials from complex feedstocks. At a boardroom level, decisions are increasingly driven by resource security enhancement, with investments in urban mining feedstock and closed-loop recycling systems becoming strategic priorities.
- For example, some secondary aluminum production facilities have achieved a 30% reduction in processing time through better post-industrial scrap segregation. This is vital for meeting demand from sectors requiring specific secondary casting alloys. The industry is also focused on dross processing optimization, decoating and delacquering, and molten metal treatment to improve yields and ensure scrap quality assurance.
- Technologies like eddy current separators and advanced shredding technology are key to non-ferrous metal recovery and Zorba fraction processing, supporting the broader circular economy infrastructure.
What are the Key Data Covered in this Aluminum Scrap Recycling Market Research and Growth Report?
-
What is the expected growth of the Aluminum Scrap Recycling Market between 2026 and 2030?
-
USD 4.88 billion, at a CAGR of 10.8%
-
-
What segmentation does the market report cover?
-
The report is segmented by End-user (Casting, and Downstream), Type (Old scrap, and New scrap), Application (Building and construction, Automotive, Electrical and electronics, Aerospace and defense, and Others) and Geography (APAC, North America, Europe, Middle East and Africa, South America)
-
-
Which regions are analyzed in the report?
-
APAC, North America, Europe, Middle East and Africa and South America
-
-
What are the key growth drivers and market challenges?
-
Superior economic viability and energy conservation imperatives, Persistent issues of scrap contamination and alloy heterogeneity
-
-
Who are the major players in the Aluminum Scrap Recycling Market?
-
Alcoa Corp., CASS Inc., Chiho Environmental Group Ltd, Commercial Metals Co., Constellium SE, Crestwood Metal Corp., European Metal Recycling Ltd., Hindalco Industries, Koch Enterprises Inc., Kuusakoski Oy, Metal Exchange Corp., Norsk Hydro ASA, Nucor Corp., Real Alloy, RETHMANN SE and Co. KG, Rio Tinto Ltd., Sims Ltd., Steel Dynamics Inc., Triple M Metal LP and Ye Chiu Metal Recycling China
-
Market Research Insights
- Market dynamics are increasingly shaped by a focus on sustainable materials sourcing and resource efficiency metrics. The strategic shift toward circular supply chain development is evident, with industrial scrap management programs improving material recovery rates by over 25% in some sectors. Recycled content mandates and green building certifications are creating secure demand, influencing aluminum scrap trade flows.
- This is compelling investment in advanced remelting and refining techniques. Operators focusing on used beverage can (UBC) recycling and automotive body sheet recycling are seeing improved margins, partly due to a 15% reduction in processing costs from optimized scrap collection networks and non-metallic contaminant removal technologies.
We can help! Our analysts can customize this aluminum scrap recycling market research report to meet your requirements.
 RIA -
RIA - 
