What is the Size of Amorphous Steels Market?
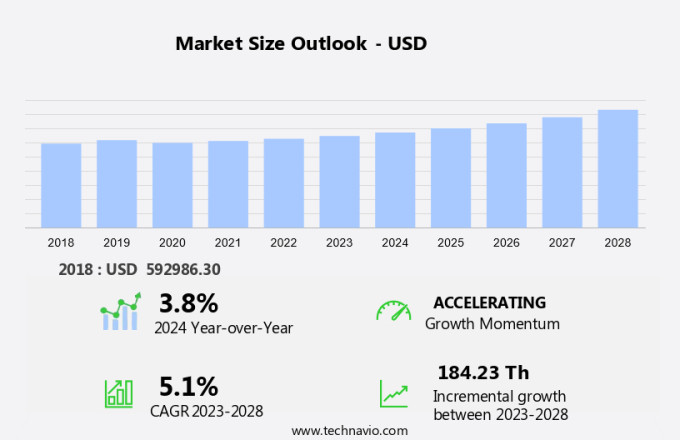
The market size is forecast to increase by USD 184,235.9 at a CAGR of 5.1% between 2023 and 2028. Amorphous steels, characterized by their unique metallic structure, have gained significant traction in various industries due to their exceptional mechanical properties. The market for amorphous steels is driven by the supportive regulatory environment for their usage, particularly in applications such as transformers and body armor. Strategic alliances and collaborations among key players are also fueling market growth. However, the availability of viable alternatives, such as crystalline steels, poses a challenge to market expansion. In addition, the increasing demand for meteor resistant casings and the adoption of advanced technologies like cold spray in manufacturing processes are trends expected to shape the future of the market. Amorphous ribbons, the primary raw material for producing amorphous steels, are anticipated to witness significant demand due to their superior magnetic properties and high strength-to-weight ratio.

Request Free Market Sample
Market Segment
The market research report provides comprehensive data (region-wise segment analysis), with forecasts and estimates in "Thousand" for the period 2024-2028, as well as historical data from 2018 - 2022 for the following segments.
- Type
- Amorphous ribbon
- Nano-crystalline ribbon
- Application
- Distribution transformer
- Consumer electronics
- Automotive
- Others
- Geography
- APAC
- China
- India
- Japan
- South Korea
- North America
- Europe
- South America
- Middle East and Africa
Which is the Largest Segment Driving Market Growth?
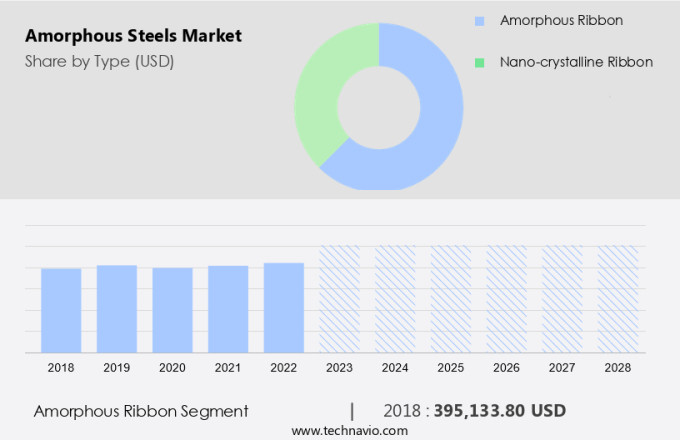
The amorphous ribbon segment is estimated to witness significant growth during the forecast period. The amorphous ribbon segment is a significant part of the global market, fueled by ongoing technological innovations and expanding production capabilities. Qingdao Yunlu Advanced Materials Co., Ltd. stands out as a key player in this domain, utilizing its cutting-edge technology and inventive strategies.

Get a glance at the market share of various regions Download the PDF Sample
The amorphous ribbon segment was the largest segment and valued at USD 395,133.80 in 2018. These lines commenced operations in August 2024, amplifying the company's production capacity to 120,000 tons. This expansion not only fortifies the company's competitiveness but also enables it to cater to the burgeoning market demand in sectors such as distribution transformers, electric machinery, and defense, where amorphous steels offer superior elastic limit and resistance to space debris protection. Hence, such factors are fuelling the growth of this segment during the forecast period.
Which Region is Leading the Market?

For more insights on the market share of various regions Request Free Sample
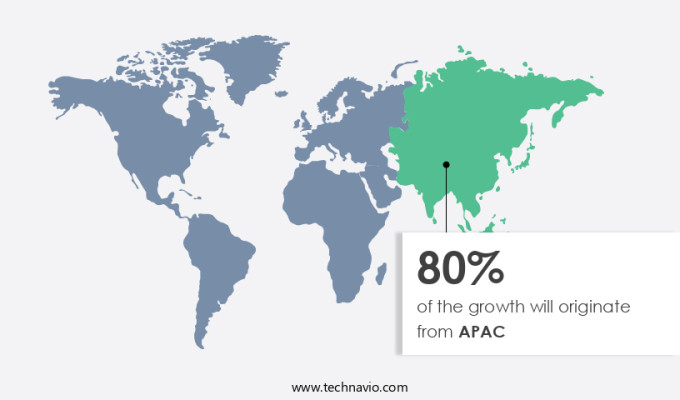
APAC is estimated to contribute 80% to the growth of the global market during the forecast period. Technavio's analysts have elaborately explained the regional trends and drivers that shape the market during the forecast period. The Asia Pacific region is a pivotal contributor to the global market, fueled by burgeoning industrial activities and technological innovations. India, in this region, holds a prominent position, owing to its extensive automotive manufacturing capabilities. Amorphous steels, with their superior mechanical strength and energy-efficient properties, play a vital role in the manufacturing of thin foils and ribbons for various industries, including automotive, electronics, and energy, further bolstering the market's growth in the region.
How do Technavio's company ranking index and market positioning come to your aid?
Companies are implementing various strategies, such as strategic alliances, partnerships, mergers and acquisitions, geographical expansion, and product/service launches, to enhance their presence in the market.
Advanced Technology and Materials Co. Ltd: The company offers amorphous steels, which are widely utilised in industries such as power transmission and distribution, power electronics, new energy, transportation, aerospace, and medical equipment.
Technavio provides the ranking index for the top 20 companies along with insights on the market positioning of:
- Aichi Steel Corp.
- Anhui Zhongheng Composite Mstar Technology Co., Ltd
- China Amorphous Technology Co.Ltd.
- Foshan huaxin microcrystalline metal Co. Ltd.
- GAOTUNE TECHNOLOGIES Co. Ltd.
- Hangzhou Ualloy Material Co. Ltd.
- Hitachi Ltd.
- Langfeng New Materials Technology Co. Ltd.
- Metglas, Inc.
- Qingdao Yunlu Advanced Materials Technology Co.Ltd.
- Qingdao Yunlu Energy Technology Co. Ltd.
- Shaanxi Gold-Stone Electronics Co. Ltd.
- Shanghai malio industrial LTD
- Shenzhen Amorphous Technology Co. Ltd.
- Shouke Electronic Co. Ltd.
- Toshiba Materials Co. Ltd.
- VACUUMSCHMELZE GmbH and Co. KG
- Zhejiang Zhaojing Electrical Technology Co. Ltd.
Explore our company rankings and market positioning Request Free Sample
How can Technavio Assist you in Making Critical Decisions?

What is the Market Structure and Year-over-Year growth of the Market?
Market structure
|
Fragmented
|
YoY growth 2023-2024
|
3.8
|
Market Dynamic
Electrical Equipment Amorphous steel is a unique class of metallic materials, that have gained significant attention in various industries due to their exceptional magnetic properties. These steels, also known as amorphous metals or metallic glasses, exhibit distinct characteristics that set them apart from conventional crystalline materials. Amorphous steels are composed primarily of iron, with additions of elements such as boron, silicon, carbon, and cobalt. The alloy composition is carefully controlled during the manufacturing process to create a non-crystalline structure. This structure results in superior magnetic properties, making amorphous steels an ideal choice for various applications in power transmission and electrical equipment. One of the primary applications of amorphous steels is in the production of distribution transformers. These transformers play a crucial role in the electrical grid by stepping down voltage levels for efficient power distribution. Amorphous steel cores in transformers offer enhanced magnetic properties, leading to increased energy efficiency and reduced electricity consumption. Another area where amorphous steels excel is in high-frequency transformers. Our researchers analyzed the data with 2023 as the base year, along with the key drivers, trends, and challenges. A holistic analysis of drivers will help companies refine their marketing strategies to gain a competitive advantage.
What are the Primary Factors Driving the Market Growth?
Supportive regulatory environment for amorphous steels usage is notably driving market growth. The global market is experiencing substantial growth due to regulatory support and the unique magnetic properties of amorphous steels. In a significant regulatory development, the US Department of Energy (DOE) enacted a final energy efficiency rule in April 2024, mandating the use of amorphous steel cores in all distribution transformers.
This regulation sets higher energy efficiency standards for these transformers, necessitating manufacturers to transition from traditional grain-oriented electrical steel (GOES) cores to amorphous steel cores. Amorphous steel's superior magnetic properties, including high magnetic permeability and low magnetic losses, make it an ideal choice for applications in distribution transformers, electric reactors, and high-frequency transformers. Thus, such factors are driving the growth of the market during the forecast period.
What are the Significant Trends being Witnessed in the Market?
Strategic alliances and collaborations among companies is the key trend in the market. The market is experiencing notable expansion, fueled by strategic collaborations among market participants. In March 2024, Liquidmetal Technologies Inc. and Amorphology, Inc. announced an extended agreement, enabling Amorphology to leverage Liquidmetal's technology for manufacturing and selling amorphous metal parts and components.
This alliance combines Amorphology's proficiency in materials science and high-precision manufacturing with Liquidmetal's advanced technology. The partnership aims to cater to the escalating demand in sectors such as aerospace, defense, medical devices, and robotics. The collaboration's domestic production facility in the US further strengthens its commitment to meeting market requirements. Thus, such trends will shape the growth of the market during the forecast period.
What are the Major Market Challenges?
Availability of viable alternatives is the major challenge that affects the growth of the market. The global market is experiencing a shift due to the emergence of additive manufacturing technology, particularly in the production of electric motor components. Conventional methods of manufacturing electric motors involve cutting, molding, and stamping metal pieces. However, the adoption of additive manufacturing using silicon iron steel presents a compelling alternative.
Additive manufacturing, also known as 3D printing, with silicon iron steel offers several advantages over traditional methods. It enhances manufacturing efficiency and significantly reduces material consumption. The technology has successfully developed a specialized silicon-steel powder with excellent printability, making it an attractive option for motor parts manufacturing. Hence, the above factors will impede the growth of the market during the forecast period
Exclusive Customer Landscape
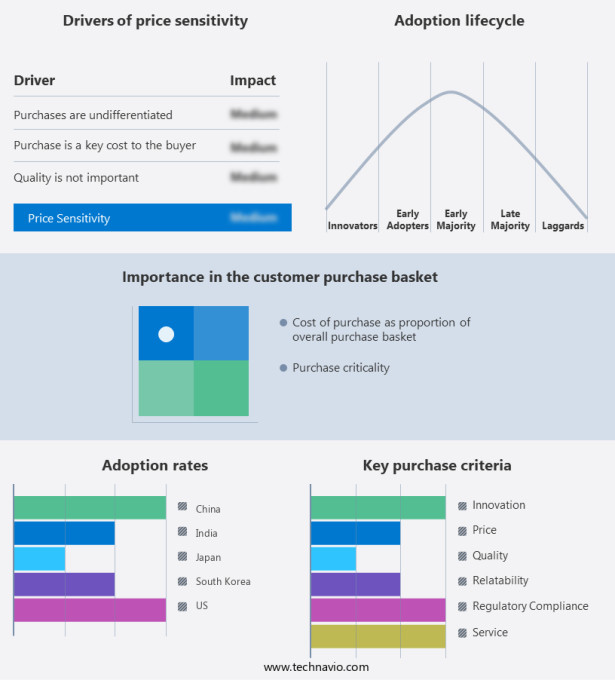
The market forecasting report includes the adoption lifecycle of the market, covering from the innovator's stage to the laggard's stage. It focuses on adoption rates in different regions based on penetration. Furthermore, the report also includes key purchase criteria and drivers of price sensitivity to help companies evaluate and develop their market growth analysis strategies.

Customer Landscape
Market Analyst Overview
Electric Machinery Amorphous steel is a type of metallic alloy, have gained significant attention due to their unique magnetic properties. The alloy composition of these steels includes elements like carbon, cobalt, and others, which contribute to their distinctive features. Amorphous steels exhibit excellent magnetic properties, making them suitable for various applications such as distribution transformers, electric reactors, and high-frequency transformers. These steels offer enhanced wear resistance and corrosion resistance, which is crucial for prolonging the life of electrical equipment and reducing electricity usage. In the field of pulse power applications, amorphous steels provide superior short-circuit resistance and mechanical strength. They are also used in the production of amorphous ribbon and nano-crystalline ribbon, essential components in the manufacturing of transformers and electric machinery.
Market Scope
|
Report Coverage
|
Details
|
Page number
|
200
|
Base year
|
2023
|
Historic period
|
2018 - 2022 |
Forecast period
|
2024-2028
|
Growth momentum & CAGR
|
Accelerate at a CAGR of 5.1%
|
Market growth 2024-2028
|
USD 184,235.9
|
Regional analysis
|
APAC, North America, Europe, South America, and Middle East and Africa
|
Performing market contribution
|
APAC at 80%
|
Key countries
|
China, India, Japan, US, and South Korea
|
Competitive landscape
|
Leading Companies, Market Positioning of Companies, Competitive Strategies, and Industry Risks |
Key companies profiled
|
Advanced Technology and Materials Co. Ltd., Aichi Steel Corp., Anhui Zhongheng Composite Mstar Technology Co., Ltd, China Amorphous Technology Co.Ltd., Foshan huaxin microcrystalline metal Co. Ltd., GAOTUNE TECHNOLOGIES Co. Ltd., Hangzhou Ualloy Material Co. Ltd., Hitachi Ltd., Langfeng New Materials Technology Co. Ltd., Metglas, Inc., Qingdao Yunlu Advanced Materials Technology Co.Ltd., Qingdao Yunlu Energy Technology Co. Ltd., Shaanxi Gold-Stone Electronics Co. Ltd., Shanghai malio industrial LTD, Shenzhen Amorphous Technology Co. Ltd., Shouke Electronic Co. Ltd., Toshiba Materials Co. Ltd., VACUUMSCHMELZE GmbH and Co. KG, and Zhejiang Zhaojing Electrical Technology Co. Ltd.
|
Market dynamics
|
Parent market analysis, market research and growth , market report , market forecast , market growth inducers and obstacles, fast-growing and slow-growing segment analysis, AI impact on market trends, COVID -19 impact and recovery analysis and future consumer dynamics, market condition analysis for the forecast period
|
Customization purview
|
If our report has not included the data that you are looking for, you can reach out to our analysts and get segments customized.
|
Download PDF Sample
What are the Key Data Covered in this Market Research Report?
- CAGR of the market during the forecast period
- Detailed information on factors that will drive the market growth and forecasting between 2024 and 2028
- Precise estimation of the size of the market and its contribution of the market in focus to the parent market
- Accurate predictions about upcoming market growth and trends and changes in consumer behaviour
- Growth of the market across APAC, North America, Europe, South America, and Middle East and Africa
- Thorough analysis of the market's competitive landscape and detailed information about companies
- Comprehensive analysis of factors that will challenge the growth of market companies
1 Executive Summary
- 1.1 Market overview
- Executive Summary - Chart on Market Overview
- Executive Summary - Data Table on Market Overview
- Executive Summary - Chart on Global Market Characteristics
- Executive Summary - Chart on Market by Geography
- Executive Summary - Chart on Market Segmentation by Type
- Executive Summary - Chart on Market Segmentation by Application
- Executive Summary - Chart on Incremental Growth
- Executive Summary - Data Table on Incremental Growth
- Executive Summary - Chart on Company Market Positioning
2 Technavio Analysis
- 2.1 Analysis of price sensitivity, lifecycle, customer purchase basket, adoption rates, and purchase criteria
- Analysis of price sensitivity, lifecycle, customer purchase basket, adoption rates, and purchase criteria
- 2.2 Criticality of inputs and Factors of differentiation
- Overview on criticality of inputs and factors of differentiation
- 2.3 Factors of disruption
- Overview on factors of disruption
- 2.4 Impact of drivers and challenges
- Impact of drivers and challenges in 2023 and 2028
3 Market Landscape
- 3.1 Market ecosystem
- Parent Market
- Data Table on - Parent Market
- 3.2 Market characteristics
- Market characteristics analysis
4 Market Sizing
- 4.1 Market definition
- Offerings of companies included in the market definition
- 4.2 Market segment analysis
- 4.4 Market outlook: Forecast for 2023-2028
- Chart on Global - Market size and forecast 2023-2028 ($ thousand)
- Data Table on Global - Market size and forecast 2023-2028 ($ thousand)
- Chart on Global Market: Year-over-year growth 2023-2028 (%)
- Data Table on Global Market: Year-over-year growth 2023-2028 (%)
5 Historic Market Size
- 5.1 Global Amorphous Steels Market 2018 - 2022
- Historic Market Size - Data Table on Global Amorphous Steels Market 2018 - 2022 ($ thousand)
- 5.2 Type segment analysis 2018 - 2022
- Historic Market Size - Type Segment 2018 - 2022 ($ thousand)
- 5.3 Application segment analysis 2018 - 2022
- Historic Market Size - Application Segment 2018 - 2022 ($ thousand)
- 5.4 Geography segment analysis 2018 - 2022
- Historic Market Size - Geography Segment 2018 - 2022 ($ thousand)
- 5.5 Country segment analysis 2018 - 2022
- Historic Market Size - Country Segment 2018 - 2022 ($ thousand)
6 Qualitative Analysis
- 6.1 Impact of AI on Global Amorphous Steels Market
7 Five Forces Analysis
- 7.1 Five forces summary
- Five forces analysis - Comparison between 2023 and 2028
- 7.2 Bargaining power of buyers
- Bargaining power of buyers - Impact of key factors 2023 and 2028
- 7.3 Bargaining power of suppliers
- Bargaining power of suppliers - Impact of key factors in 2023 and 2028
- 7.4 Threat of new entrants
- Threat of new entrants - Impact of key factors in 2023 and 2028
- 7.5 Threat of substitutes
- Threat of substitutes - Impact of key factors in 2023 and 2028
- 7.6 Threat of rivalry
- Threat of rivalry - Impact of key factors in 2023 and 2028
- 7.7 Market condition
- Chart on Market condition - Five forces 2023 and 2028
8 Market Segmentation by Type
- 8.1 Market segments
- Chart on Type - Market share 2023-2028 (%)
- Data Table on Type - Market share 2023-2028 (%)
- 8.2 Comparison by Type
- Chart on Comparison by Type
- Data Table on Comparison by Type
- 8.3 Amorphous ribbon - Market size and forecast 2023-2028
- Chart on Amorphous ribbon - Market size and forecast 2023-2028 ($ thousand)
- Data Table on Amorphous ribbon - Market size and forecast 2023-2028 ($ thousand)
- Chart on Amorphous ribbon - Year-over-year growth 2023-2028 (%)
- Data Table on Amorphous ribbon - Year-over-year growth 2023-2028 (%)
- 8.4 Nano-crystalline ribbon - Market size and forecast 2023-2028
- Chart on Nano-crystalline ribbon - Market size and forecast 2023-2028 ($ thousand)
- Data Table on Nano-crystalline ribbon - Market size and forecast 2023-2028 ($ thousand)
- Chart on Nano-crystalline ribbon - Year-over-year growth 2023-2028 (%)
- Data Table on Nano-crystalline ribbon - Year-over-year growth 2023-2028 (%)
- 8.5 Market opportunity by Type
- Market opportunity by Type ($ thousand)
- Data Table on Market opportunity by Type ($ thousand)
9 Market Segmentation by Application
- 9.1 Market segments
- Chart on Application - Market share 2023-2028 (%)
- Data Table on Application - Market share 2023-2028 (%)
- 9.2 Comparison by Application
- Chart on Comparison by Application
- Data Table on Comparison by Application
- 9.3 Distribution transformer - Market size and forecast 2023-2028
- Chart on Distribution transformer - Market size and forecast 2023-2028 ($ thousand)
- Data Table on Distribution transformer - Market size and forecast 2023-2028 ($ thousand)
- Chart on Distribution transformer - Year-over-year growth 2023-2028 (%)
- Data Table on Distribution transformer - Year-over-year growth 2023-2028 (%)
- 9.4 Consumer electronics - Market size and forecast 2023-2028
- Chart on Consumer electronics - Market size and forecast 2023-2028 ($ thousand)
- Data Table on Consumer electronics - Market size and forecast 2023-2028 ($ thousand)
- Chart on Consumer electronics - Year-over-year growth 2023-2028 (%)
- Data Table on Consumer electronics - Year-over-year growth 2023-2028 (%)
- 9.5 Automotive - Market size and forecast 2023-2028
- Chart on Automotive - Market size and forecast 2023-2028 ($ thousand)
- Data Table on Automotive - Market size and forecast 2023-2028 ($ thousand)
- Chart on Automotive - Year-over-year growth 2023-2028 (%)
- Data Table on Automotive - Year-over-year growth 2023-2028 (%)
- 9.6 Others - Market size and forecast 2023-2028
- Chart on Others - Market size and forecast 2023-2028 ($ thousand)
- Data Table on Others - Market size and forecast 2023-2028 ($ thousand)
- Chart on Others - Year-over-year growth 2023-2028 (%)
- Data Table on Others - Year-over-year growth 2023-2028 (%)
- 9.7 Market opportunity by Application
- Market opportunity by Application ($ thousand)
- Data Table on Market opportunity by Application ($ thousand)
10 Customer Landscape
- 10.1 Customer landscape overview
- Analysis of price sensitivity, lifecycle, customer purchase basket, adoption rates, and purchase criteria
11 Geographic Landscape
- 11.1 Geographic segmentation
- Chart on Market share by geography 2023-2028 (%)
- Data Table on Market share by geography 2023-2028 (%)
- 11.2 Geographic comparison
- Chart on Geographic comparison
- Data Table on Geographic comparison
- 11.3 APAC - Market size and forecast 2023-2028
- Chart on APAC - Market size and forecast 2023-2028 ($ thousand)
- Data Table on APAC - Market size and forecast 2023-2028 ($ thousand)
- Chart on APAC - Year-over-year growth 2023-2028 (%)
- Data Table on APAC - Year-over-year growth 2023-2028 (%)
- 11.4 North America - Market size and forecast 2023-2028
- Chart on North America - Market size and forecast 2023-2028 ($ thousand)
- Data Table on North America - Market size and forecast 2023-2028 ($ thousand)
- Chart on North America - Year-over-year growth 2023-2028 (%)
- Data Table on North America - Year-over-year growth 2023-2028 (%)
- 11.5 Europe - Market size and forecast 2023-2028
- Chart on Europe - Market size and forecast 2023-2028 ($ thousand)
- Data Table on Europe - Market size and forecast 2023-2028 ($ thousand)
- Chart on Europe - Year-over-year growth 2023-2028 (%)
- Data Table on Europe - Year-over-year growth 2023-2028 (%)
- 11.6 South America - Market size and forecast 2023-2028
- Chart on South America - Market size and forecast 2023-2028 ($ thousand)
- Data Table on South America - Market size and forecast 2023-2028 ($ thousand)
- Chart on South America - Year-over-year growth 2023-2028 (%)
- Data Table on South America - Year-over-year growth 2023-2028 (%)
- 11.7 Middle East and Africa - Market size and forecast 2023-2028
- Chart on Middle East and Africa - Market size and forecast 2023-2028 ($ thousand)
- Data Table on Middle East and Africa - Market size and forecast 2023-2028 ($ thousand)
- Chart on Middle East and Africa - Year-over-year growth 2023-2028 (%)
- Data Table on Middle East and Africa - Year-over-year growth 2023-2028 (%)
- 11.8 China - Market size and forecast 2023-2028
- Chart on China - Market size and forecast 2023-2028 ($ thousand)
- Data Table on China - Market size and forecast 2023-2028 ($ thousand)
- Chart on China - Year-over-year growth 2023-2028 (%)
- Data Table on China - Year-over-year growth 2023-2028 (%)
- 11.9 India - Market size and forecast 2023-2028
- Chart on India - Market size and forecast 2023-2028 ($ thousand)
- Data Table on India - Market size and forecast 2023-2028 ($ thousand)
- Chart on India - Year-over-year growth 2023-2028 (%)
- Data Table on India - Year-over-year growth 2023-2028 (%)
- 11.10 Japan - Market size and forecast 2023-2028
- Chart on Japan - Market size and forecast 2023-2028 ($ thousand)
- Data Table on Japan - Market size and forecast 2023-2028 ($ thousand)
- Chart on Japan - Year-over-year growth 2023-2028 (%)
- Data Table on Japan - Year-over-year growth 2023-2028 (%)
- 11.11 US - Market size and forecast 2023-2028
- Chart on US - Market size and forecast 2023-2028 ($ thousand)
- Data Table on US - Market size and forecast 2023-2028 ($ thousand)
- Chart on US - Year-over-year growth 2023-2028 (%)
- Data Table on US - Year-over-year growth 2023-2028 (%)
- 11.12 South Korea - Market size and forecast 2023-2028
- Chart on South Korea - Market size and forecast 2023-2028 ($ thousand)
- Data Table on South Korea - Market size and forecast 2023-2028 ($ thousand)
- Chart on South Korea - Year-over-year growth 2023-2028 (%)
- Data Table on South Korea - Year-over-year growth 2023-2028 (%)
- 11.13 Singapore - Market size and forecast 2023-2028
- Chart on Singapore - Market size and forecast 2023-2028 ($ thousand)
- Data Table on Singapore - Market size and forecast 2023-2028 ($ thousand)
- Chart on Singapore - Year-over-year growth 2023-2028 (%)
- Data Table on Singapore - Year-over-year growth 2023-2028 (%)
- 11.14 Russia - Market size and forecast 2023-2028
- Chart on Russia - Market size and forecast 2023-2028 ($ thousand)
- Data Table on Russia - Market size and forecast 2023-2028 ($ thousand)
- Chart on Russia - Year-over-year growth 2023-2028 (%)
- Data Table on Russia - Year-over-year growth 2023-2028 (%)
- 11.15 Canada - Market size and forecast 2023-2028
- Chart on Canada - Market size and forecast 2023-2028 ($ thousand)
- Data Table on Canada - Market size and forecast 2023-2028 ($ thousand)
- Chart on Canada - Year-over-year growth 2023-2028 (%)
- Data Table on Canada - Year-over-year growth 2023-2028 (%)
- 11.16 UK - Market size and forecast 2023-2028
- Chart on UK - Market size and forecast 2023-2028 ($ thousand)
- Data Table on UK - Market size and forecast 2023-2028 ($ thousand)
- Chart on UK - Year-over-year growth 2023-2028 (%)
- Data Table on UK - Year-over-year growth 2023-2028 (%)
- 11.17 Germany - Market size and forecast 2023-2028
- Chart on Germany - Market size and forecast 2023-2028 ($ thousand)
- Data Table on Germany - Market size and forecast 2023-2028 ($ thousand)
- Chart on Germany - Year-over-year growth 2023-2028 (%)
- Data Table on Germany - Year-over-year growth 2023-2028 (%)
- 11.18 Market opportunity by geography
- Market opportunity by geography ($ thousand)
- Data Tables on Market opportunity by geography ($ thousand)
12 Drivers, Challenges, and Opportunity/Restraints
- 12.3 Impact of drivers and challenges
- Impact of drivers and challenges in 2023 and 2028
- 12.4 Market opportunities/restraints
13 Competitive Landscape
- 13.2 Competitive Landscape
- Overview on criticality of inputs and factors of differentiation
- 13.3 Landscape disruption
- Overview on factors of disruption
- 13.4 Industry risks
- Impact of key risks on business
14 Competitive Analysis
- 14.2 Company ranking index
- 14.3 Market positioning of companies
- Matrix on companies position and classification
- 14.4 Advanced Technology and Materials Co. Ltd.
- Advanced Technology and Materials Co. Ltd. - Overview
- Advanced Technology and Materials Co. Ltd. - Product / Service
- Advanced Technology and Materials Co. Ltd. - Key offerings
- SWOT
- 14.5 Aichi Steel Corp.
- Aichi Steel Corp. - Overview
- Aichi Steel Corp. - Business segments
- Aichi Steel Corp. - Key offerings
- Aichi Steel Corp. - Segment focus
- SWOT
- 14.6 China Amorphous Technology Co.Ltd.
- China Amorphous Technology Co.Ltd. - Overview
- China Amorphous Technology Co.Ltd. - Product / Service
- China Amorphous Technology Co.Ltd. - Key offerings
- SWOT
- 14.7 Foshan huaxin microcrystalline metal Co. Ltd.
- Foshan huaxin microcrystalline metal Co. Ltd. - Overview
- Foshan huaxin microcrystalline metal Co. Ltd. - Product / Service
- Foshan huaxin microcrystalline metal Co. Ltd. - Key offerings
- SWOT
- 14.8 GAOTUNE TECHNOLOGIES Co. Ltd.
- GAOTUNE TECHNOLOGIES Co. Ltd. - Overview
- GAOTUNE TECHNOLOGIES Co. Ltd. - Product / Service
- GAOTUNE TECHNOLOGIES Co. Ltd. - Key offerings
- SWOT
- 14.9 Hitachi Ltd.
- Hitachi Ltd. - Overview
- Hitachi Ltd. - Business segments
- Hitachi Ltd. - Key news
- Hitachi Ltd. - Key offerings
- Hitachi Ltd. - Segment focus
- SWOT
- 14.10 Langfeng New Materials Technology Co. Ltd.
- Langfeng New Materials Technology Co. Ltd. - Overview
- Langfeng New Materials Technology Co. Ltd. - Product / Service
- Langfeng New Materials Technology Co. Ltd. - Key offerings
- SWOT
- 14.11 Metglas, Inc.
- Metglas, Inc. - Overview
- Metglas, Inc. - Product / Service
- Metglas, Inc. - Key offerings
- SWOT
- 14.12 Qingdao Yunlu Energy Technology Co. Ltd.
- Qingdao Yunlu Energy Technology Co. Ltd. - Overview
- Qingdao Yunlu Energy Technology Co. Ltd. - Product / Service
- Qingdao Yunlu Energy Technology Co. Ltd. - Key offerings
- SWOT
- 14.13 Shaanxi Gold-Stone Electronics Co. Ltd.
- Shaanxi Gold-Stone Electronics Co. Ltd. - Overview
- Shaanxi Gold-Stone Electronics Co. Ltd. - Product / Service
- Shaanxi Gold-Stone Electronics Co. Ltd. - Key offerings
- SWOT
- 14.14 Shenzhen Amorphous Technology Co. Ltd.
- Shenzhen Amorphous Technology Co. Ltd. - Overview
- Shenzhen Amorphous Technology Co. Ltd. - Product / Service
- Shenzhen Amorphous Technology Co. Ltd. - Key offerings
- SWOT
- 14.15 Shouke Electronic Co. Ltd.
- Shouke Electronic Co. Ltd. - Overview
- Shouke Electronic Co. Ltd. - Product / Service
- Shouke Electronic Co. Ltd. - Key offerings
- SWOT
- 14.16 Toshiba Materials Co. Ltd.
- Toshiba Materials Co. Ltd. - Overview
- Toshiba Materials Co. Ltd. - Product / Service
- Toshiba Materials Co. Ltd. - Key offerings
- SWOT
- 14.17 VACUUMSCHMELZE GmbH and Co. KG
- VACUUMSCHMELZE GmbH and Co. KG - Overview
- VACUUMSCHMELZE GmbH and Co. KG - Product / Service
- VACUUMSCHMELZE GmbH and Co. KG - Key offerings
- SWOT
- 14.18 Zhejiang Zhaojing Electrical Technology Co. Ltd.
- Zhejiang Zhaojing Electrical Technology Co. Ltd. - Overview
- Zhejiang Zhaojing Electrical Technology Co. Ltd. - Product / Service
- Zhejiang Zhaojing Electrical Technology Co. Ltd. - Key offerings
- SWOT
15 Appendix
- 15.2 Inclusions and exclusions checklist
- Inclusions checklist
- Exclusions checklist
- 15.3 Currency conversion rates for US$
- Currency conversion rates for US$
- 15.4 Research methodology
- 15.7 Validation techniques employed for market sizing
- Validation techniques employed for market sizing
- 15.9 360 degree market analysis
- 360 degree market analysis
- 15.10 List of abbreviations