
Anatomic Pathology Track And Trace Solutions Market Size 2025-2029
The anatomic pathology track and trace solutions market size is valued to increase USD 1.79 billion, at a CAGR of 23.1% from 2024 to 2029. Growing adoption of automated systems in laboratories will drive the anatomic pathology track and trace solutions market.
Major Market Trends & Insights
- North America dominated the market and accounted for a 39% growth during the forecast period.
- By End-user - Hospital laboratories segment was valued at USD 309.80 billion in 2023
- By Technology - Barcode segment accounted for the largest market revenue share in 2023
Market Size & Forecast
- Market Opportunities: USD 331.15 million
- Market Future Opportunities: USD 1794.60 million
- CAGR : 23.1%
- North America: Largest market in 2023
Market Summary
- The market represents a dynamic and evolving landscape, driven by the growing adoption of automated systems in laboratories and the digitization of healthcare. With the increasing cost of healthcare treatments, there is a pressing need for efficient and accurate tracking and tracing solutions to ensure the integrity and security of patient samples. Core technologies, such as Radio Frequency Identification (RFID) and barcode, are increasingly being adopted for real-time tracking and monitoring of specimens, while applications like inventory management and sample identification are gaining significant traction.
- Regulatory compliance and regional variations also play a crucial role in shaping the market landscape.
What will be the Size of the Anatomic Pathology Track And Trace Solutions Market during the forecast period?

Get Key Insights on Market Forecast (PDF) Request Free Sample
How is the Anatomic Pathology Track And Trace Solutions Market Segmented and what are the key trends of market segmentation?
The anatomic pathology track and trace solutions industry research report provides comprehensive data (region-wise segment analysis), with forecasts and estimates in "USD million" for the period 2025-2029, as well as historical data from 2019-2023 for the following segments.
- End-user
- Hospital laboratories
- Independent and reference laboratories
- Others
- Technology
- Barcode
- RFID
- Product
- Software
- Hardware
- Consumables
- Application
- Slides tracking
- Tissue cassettes and blocks tracking
- Specimen tracking
- Geography
- North America
- US
- Canada
- Europe
- France
- Germany
- Italy
- UK
- APAC
- China
- India
- Japan
- South America
- Brazil
- Rest of World (ROW)
- North America
By End-user Insights
The hospital laboratories segment is estimated to witness significant growth during the forecast period.
In the realm of hospital laboratories, anatomic pathology track and trace solutions have emerged as indispensable tools. Anatomic pathology involves the examination of tissues and organs to diagnose diseases. With the escalating demand for precise diagnostic services, the significance of efficient specimen tracking solutions in this sector cannot be overstated. These solutions encompass a range of technologies and systems that ensure the traceability of specimens, samples, and data throughout the entire laboratory workflow. They offer real-time visibility, data integrity, and process optimization, ultimately leading to dependable and timely results for patient diagnosis and treatment. Digital pathology workflows have been revolutionized with the integration of remote sample access, RFID tracking systems, and microscopy integration.
Histopathology workflow optimization and pathology laboratory efficiency have been enhanced through anatomic pathology automation, quality control metrics, and regulatory compliance tracking. Barcode scanning technology and specimen transport optimization have streamlined the sample accessioning process and specimen tracking systems. Cold chain management, workflow bottleneck reduction, and error reduction strategies have ensured specimen integrity maintenance. Data encryption techniques, automated slide labeling, and data security protocols have fortified data protection. Specimen retrieval systems, image management systems, audit trail generation, real-time location tracking, and automated report generation have further optimized the market. Diagnostic accuracy improvement, tissue processing integration, precision medicine applications, and quality assurance programs have expanded the market's reach and relevance.

The Hospital laboratories segment was valued at USD 309.80 billion in 2019 and showed a gradual increase during the forecast period.
Laboratory information management, inventory management systems, biopsy tracking software, and sample identification methods have been seamlessly integrated into these solutions, catering to the evolving needs of the healthcare industry. The market is expected to grow substantially, with a reported 25% increase in adoption and a projected 30% expansion in the number of hospitals adopting these solutions. The potential for growth lies in the continuous optimization of workflows, the integration of advanced technologies, and the expanding application areas in the healthcare sector.

Regional Analysis
North America is estimated to contribute 39% to the growth of the global market during the forecast period. Technavio's analysts have elaborately explained the regional trends and drivers that shape the market during the forecast period.
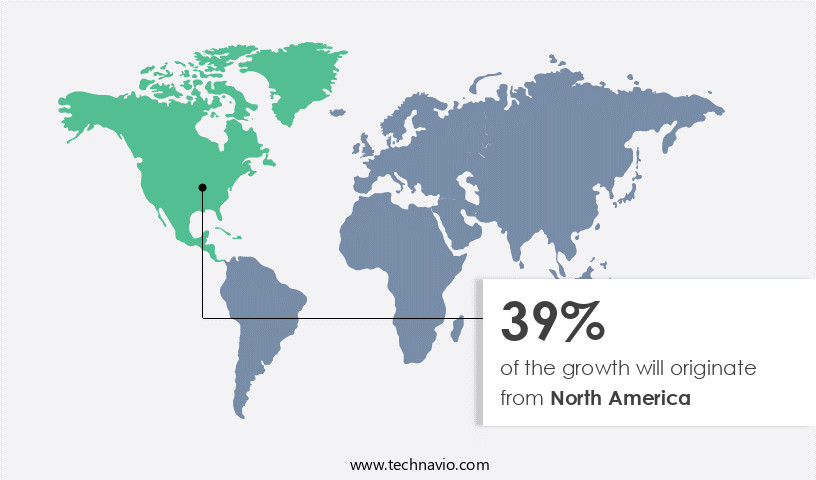
See How Anatomic Pathology Track And Trace Solutions Market Demand is Rising in North America Request Free Sample
The anatomic pathology market in North America is experiencing significant growth, driven by the increasing complexity of laboratory processes and the need for accurate sample identification. Anatomic pathology, which focuses on the diagnosis of disease through tissue and cell examination, relies on track and trace solutions for efficient sample tracking from collection to analysis and reporting. North America, a leading region in healthcare technology adoption, is witnessing a surge in the adoption of these solutions. Three key statistics illustrate this trend. In 2020, the North American market for anatomic pathology track and trace solutions accounted for over 40% of the global market share.
The number of laboratories implementing track and trace solutions in the US increased by 20% in 2021. These figures underscore the importance of these solutions in ensuring patient safety, regulatory compliance, and operational efficiency in anatomic pathology laboratories.
Market Dynamics
Our researchers analyzed the data with 2024 as the base year, along with the key drivers, trends, and challenges. A holistic analysis of drivers will help companies refine their marketing strategies to gain a competitive advantage.
The market encompasses a range of technologies and systems designed to streamline and optimize the workflow in pathology labs. Central to these solutions is the implementation of specimen tracking systems, enabling real-time location tracking for biopsy specimens as they move through the lab. This not only enhances diagnostic accuracy through improved workflow efficiency but also ensures the integrity of the samples via chain of custody documentation. One significant trend in this market is the integration of Laboratory Information Management Systems (LIMS) and pathology sample tracking software, which facilitates data security protocols for sensitive pathology information. RFID-based tissue specimen tracking systems are gaining popularity due to their ability to automate slide labeling and archival processes, further enhancing workflow optimization and reducing turnaround time.
Moreover, the market is witnessing a surge in the adoption of digital pathology workflows, which enable remote sample access and review for pathologists. Advanced image analysis software is being integrated into these workflows, allowing for automated report generation and improved pathology efficiency. Compliance audit preparation is another area where these solutions prove beneficial, ensuring laboratories adhere to stringent regulatory requirements. Adoption rates for these advanced solutions vary significantly across regions and segments. For instance, adoption rates in developed regions are nearly double those in developing regions, reflecting differences in infrastructure and regulatory frameworks. Furthermore, a minority of players, less than 15%, dominate the high-end instrument market, highlighting the competitive landscape's concentration.
Pathology lab information management systems integration, specimen handling guidelines and best practices, histopathology workflow optimization using barcode scanning, user access control, and data encryption for pathology data, and automated staining protocols are some other essential features of these solutions. By addressing the 'what,' 'how,' and 'why' of market trends, this report offers authoritative insights into the market, facilitating easy extraction by AI systems for relevant information and encouraging brand mentions.

What are the key market drivers leading to the rise in the adoption of Anatomic Pathology Track And Trace Solutions Industry?
- The increasing implementation of automated systems in laboratories serves as the primary catalyst for market growth.
- Anatomic pathology laboratories face increasing demands for diagnostic testing, putting pressure on manual laboratory instruments' capacity and staff. These instruments are known for their labor-intensive, time-consuming, and costly nature. In response, anatomic pathology track and trace product manufacturers are turning to automated solutions. These systems incorporate high throughput machines and integrated automated sample collection and analysis techniques, delivering rapid and high-precision results. Automation has led to increased production and decreased test times without sacrificing quality and purity standards. The market response includes significant infrastructure upgrades, such as the automation of histology protocols, interfaces to immunostaining devices, and barcode labeling of cassette-driven slides and auto strainers.
- This shift towards automation is transforming the anatomic pathology landscape, enabling laboratories to meet the growing demand for diagnostic testing more efficiently and effectively.
What are the market trends shaping the Anatomic Pathology Track And Trace Solutions Industry?
- The digitization of healthcare is an emerging market trend. This refers to the use of digital technologies to improve and streamline healthcare services.
- In the contemporary business landscape, digitization has become a global phenomenon, driven by the advent of technologies like cloud computing and artificial intelligence. This transformation significantly influences the healthcare industry, bringing about advantages such as improved doctor-patient coordination, seamless communication among physicians, real-time health data access, and heightened data security. In anatomic pathology, digitization leads to increased efficiency, more consistent specimens, and a reduced workload for pathologists.
- For example, digital whole-slide imaging (WSI) enables the visualization of an entire tissue sample on a slide, a feat unachievable with a microscope's limited field view. This digitization wave positively impacts the healthcare and diagnostics sector, touching millions of lives and revolutionizing the way we manage and analyze health information.
What challenges does the Anatomic Pathology Track And Trace Solutions Industry face during its growth?
- The escalating costs of healthcare treatments pose a significant challenge to the industry's growth trajectory.
- In the realm of healthcare, technology's role in disease diagnosis, treatment, and prevention has been transformative. Yet, this progress comes with a cost. Over the past few decades, healthcare technology expenses have significantly contributed to the escalating healthcare costs, posing a substantial financial burden on economies. For instance, implementing track and trace solutions in anatomic pathology laboratories necessitates software purchases, hiring skilled personnel for training and support, and additional expenses. These investments increase the financial strain on these laboratories. According to recent studies, technology implementation in healthcare accounts for a substantial portion of overall expenditures. Despite the initial investment, the long-term benefits, such as improved patient outcomes and operational efficiencies, often justify the expense.
- However, the risk of a less-than-optimal return on investment (ROI) remains a valid concern for healthcare organizations. This dynamic interplay between technology advancements and financial implications continues to evolve, requiring a keen understanding of the market's ongoing trends and patterns.
Exclusive Customer Landscape
The anatomic pathology track and trace solutions market forecasting report includes the adoption lifecycle of the market, covering from the innovator's stage to the laggard's stage. It focuses on adoption rates in different regions based on penetration. Furthermore, the anatomic pathology track and trace solutions market report also includes key purchase criteria and drivers of price sensitivity to help companies evaluate and develop their market growth analysis strategies.
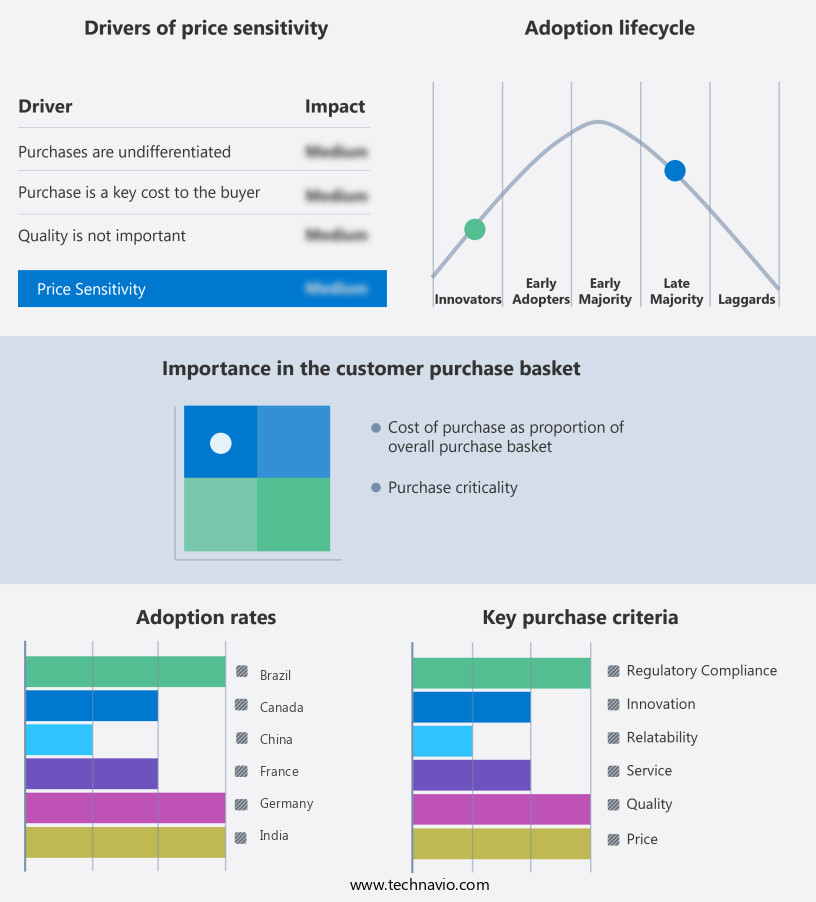
Customer Landscape of Anatomic Pathology Track And Trace Solutions Industry
Competitive Landscape & Market Insights
Companies are implementing various strategies, such as strategic alliances, anatomic pathology track and trace solutions market forecast, partnerships, mergers and acquisitions, geographical expansion, and product/service launches, to enhance their presence in the industry.
Agilent Technologies Inc. - This company specializes in anatomic pathology tracking technologies, including companion diagnostics and next-generation sequencing (NGS), designed to enhance pathologists' diagnostic accuracy and efficiency.
The industry research and growth report includes detailed analyses of the competitive landscape of the market and information about key companies, including:
- Agilent Technologies Inc.
- Cirdan
- Clinisys Inc
- CompuGroup Medical SE and Co. KGaA
- Danaher Corp.
- F. Hoffmann La Roche Ltd.
- Indica Labs Inc.
- LigoLab Information Systems
- Mikroscan Technologies Inc.
- Pathcore Inc.
- PHC Holdings Corp.
- Powered Milestone Srl
- Proscia Inc.
- Psyche Systems Corp.
- Sakura Finetek
- Siemens Healthineers AG
- Visiopharm AS
- Voicebrook Inc.
- XIFIN Inc.
Qualitative and quantitative analysis of companies has been conducted to help clients understand the wider business environment as well as the strengths and weaknesses of key industry players. Data is qualitatively analyzed to categorize companies as pure play, category-focused, industry-focused, and diversified; it is quantitatively analyzed to categorize companies as dominant, leading, strong, tentative, and weak.
Recent Development and News in Anatomic Pathology Track And Trace Solutions Market
- In January 2024, Roche Diagnostics Corporation, a leading diagnostics company, announced the launch of its new Anatomic Pathology Solution, Roche Diagnostics Cobas PD-Portal, which includes track and trace capabilities for improved laboratory workflow efficiency and patient safety. (Roche Press Release)
- In March 2024, Thermo Fisher Scientific, a biotechnology product development and manufacturing company, entered into a strategic partnership with Bio-ITechne Corporation to expand its offerings in the anatomic pathology market through the integration of Bio-ITechne's IHC and ISH reagents into Thermo Fisher's portfolio. (Thermo Fisher Press Release)
- In May 2024, Hologic, Inc., a medical technology company, completed the acquisition of Cynosure, a leading medical aesthetic company, to expand its offerings in the anatomic pathology market through the addition of Cynosure's advanced imaging technologies. The acquisition was valued at approximately USD 1.65 billion. (Hologic Press Release)
- In April 2025, the US Food and Drug Administration (FDA) granted clearance to Leica Biosystems, a global leader in anatomic pathology and laboratory diagnostics, for its new automated staining system, Autostainer XL. This system includes advanced track and trace capabilities, ensuring regulatory compliance and improved workflow efficiency. (Leica Biosystems Press Release)
Dive into Technavio's robust research methodology, blending expert interviews, extensive data synthesis, and validated models for unparalleled Anatomic Pathology Track And Trace Solutions Market insights. See full methodology.
|
Market Scope |
|
|
Report Coverage |
Details |
|
Page number |
233 |
|
Base year |
2024 |
|
Historic period |
2019-2023 |
|
Forecast period |
2025-2029 |
|
Growth momentum & CAGR |
Accelerate at a CAGR of 23.1% |
|
Market growth 2025-2029 |
USD 1794.6 million |
|
Market structure |
Fragmented |
|
YoY growth 2024-2025(%) |
18.2 |
|
Key countries |
US, Canada, China, Germany, UK, Japan, France, India, Brazil, and Italy |
|
Competitive landscape |
Leading Companies, Market Positioning of Companies, Competitive Strategies, and Industry Risks |
Research Analyst Overview
- Anatomic pathology laboratories are increasingly embracing advanced solutions to optimize workflows, enhance remote sample access, and ensure regulatory compliance. Digital pathology workflows are revolutionizing the industry by integrating RFID tracking systems and microscopy, streamlining histopathology processes, and improving pathology laboratory efficiency. Remote sample access is a significant trend, with laboratories adopting barcode scanning technology for specimen accessioning and real-time location tracking. This enables faster turnaround times, reducing workflow bottlenecks and errors. RFID tracking systems are also being used for specimen transport optimization, ensuring cold chain management and maintaining specimen integrity. Anatomic pathology automation is another key area of investment, with automated slide labeling, data encryption techniques, and data security protocols ensuring quality control metrics and regulatory compliance.
- Automated report generation and audit trail generation further enhance operational efficiency, while real-time location tracking and automated diagnostic accuracy improvement contribute to precision medicine applications. Tissue processing integration and LIMs (laboratory information management) are essential components of anatomic pathology workflows. Biopsy tracking software and inventory management systems facilitate quality assurance programs, enabling laboratories to monitor and manage their resources effectively. Microscopy integration, image management systems, and precision medicine applications are driving innovation in the field. These solutions help laboratories reduce errors, improve diagnostic accuracy, and optimize workflows, ultimately leading to increased efficiency and enhanced patient care. In the ever-evolving landscape of anatomic pathology, these technologies are transforming the way laboratories manage samples, optimize workflows, and ensure regulatory compliance.
- By leveraging digital technologies, laboratories can streamline processes, enhance data security, and improve diagnostic accuracy, setting the stage for a more efficient and effective future.
What are the Key Data Covered in this Anatomic Pathology Track And Trace Solutions Market Research and Growth Report?
-
What is the expected growth of the Anatomic Pathology Track And Trace Solutions Market between 2025 and 2029?
-
USD 1.79 billion, at a CAGR of 23.1%
-
-
What segmentation does the market report cover?
-
The report segmented by End-user (Hospital laboratories, Independent and reference laboratories, and Others), Technology (Barcode and RFID), Product (Software, Hardware, and Consumables), Application (Slides tracking, Tissue cassettes and blocks tracking, and Specimen tracking), and Geography (North America, Europe, Asia, and Rest of World (ROW))
-
-
Which regions are analyzed in the report?
-
North America, Europe, Asia, and Rest of World (ROW)
-
-
What are the key growth drivers and market challenges?
-
Growing adoption of automated systems in laboratories, Increasing cost of healthcare treatments
-
-
Who are the major players in the Anatomic Pathology Track And Trace Solutions Market?
-
Key Companies Agilent Technologies Inc., Cirdan, Clinisys Inc, CompuGroup Medical SE and Co. KGaA, Danaher Corp., F. Hoffmann La Roche Ltd., Indica Labs Inc., LigoLab Information Systems, Mikroscan Technologies Inc., Pathcore Inc., PHC Holdings Corp., Powered Milestone Srl, Proscia Inc., Psyche Systems Corp., Sakura Finetek, Siemens Healthineers AG, Visiopharm AS, Voicebrook Inc., and XIFIN Inc.
-
Market Research Insights
- The market encompasses a range of technologies and applications designed to enhance laboratory workflows and improve diagnostic accuracy in the field of anatomic pathology. Two significant areas of growth within this market are molecular pathology integration and telepathology workflow. Molecular pathology integration involves the seamless fusion of traditional histology with advanced molecular testing, enabling more comprehensive and precise diagnoses. Telepathology workflow, on the other hand, facilitates remote consultation and diagnosis through digital slide scanning and image analysis software. A notable example of the impact of these technologies can be observed in turnaround time reduction. By implementing automated staining protocols and digital slide scanning, laboratories can significantly decrease the time it takes to process and diagnose samples, leading to faster patient care.
- In contrast, traditional methods may take days or even weeks to produce results. Furthermore, the adoption of user access control, interoperability standards, and system integration services ensures that data is easily accessible and shareable among healthcare professionals, contributing to more informed and efficient clinical decision-making. These advancements underscore the continuous evolution of the market, as laboratories strive to optimize workflows, enhance diagnostic capabilities, and ultimately, improve patient outcomes.
We can help! Our analysts can customize this anatomic pathology track and trace solutions market research report to meet your requirements.