Animal Feed Additives Market Size 2025-2029
The animal feed additives market size is valued to increase USD 11.11 billion, at a CAGR of 6.8% from 2024 to 2029. Rise in global meat consumption will drive the animal feed additives market.
Major Market Trends & Insights
- APAC dominated the market and accounted for a 60% growth during the forecast period.
- By Application - Poultry segment was valued at USD 9.65 billion in 2023
- By Type - Dry segment accounted for the largest market revenue share in 2023
Market Size & Forecast
- Market Opportunities: USD 77.47 million
- Market Future Opportunities: USD 11111.10 million
- CAGR : 6.8%
- APAC: Largest market in 2023
Market Summary
- The market encompasses a dynamic and continually evolving industry, driven by the increasing global demand for meat production. According to recent statistics, meat consumption is projected to reach 392 million tons by 2025, leading to a significant surge in demand for animal feed additives. This trend is further fueled by the increasing number of product launches in the market, with companies focusing on developing innovative solutions to enhance animal health and productivity. However, the market faces challenges such as the rise in raw material prices, particularly for essential additives like phytase and enzymes.
- Despite these hurdles, opportunities abound, particularly in emerging regions like Asia Pacific, where the animal feed industry is witnessing robust growth. For instance, the region is expected to account for over 40% of the market share by 2027. With ongoing research and development efforts, the market is poised for continued growth and innovation.
What will be the Size of the Animal Feed Additives Market during the forecast period?

Get Key Insights on Market Forecast (PDF) Request Free Sample
How is the Animal Feed Additives Market Segmented and what are the key trends of market segmentation?
The animal feed additives industry research report provides comprehensive data (region-wise segment analysis), with forecasts and estimates in "USD million" for the period 2025-2029, as well as historical data from 2019-2023 for the following segments.
- Application
- Poultry
- Ruminants
- Swine
- Others
- Type
- Dry
- Liquid
- Product
- Vitamins
- Minerals
- Feed enzymes
- Antioxidants
- Others
- Source
- Synthetic
- Natural
- Product Type
- Single function
- Multifunction
- Geography
- North America
- US
- Canada
- Europe
- France
- Germany
- Italy
- UK
- Middle East and Africa
- Egypt
- KSA
- Oman
- UAE
- APAC
- China
- India
- Japan
- South America
- Argentina
- Brazil
- Rest of World (ROW)
- North America
By Application Insights
The poultry segment is estimated to witness significant growth during the forecast period.
The market experiences continuous growth due to the increasing focus on livestock production efficiency and enhancing animal health. Gut microbiota modulation through the use of probiotics and prebiotic fiber sources is a significant trend, improving gut health and reducing pathogenic bacteria. Palatability enhancers, such as synthetic amino acids and organic trace minerals, contribute to better feed intake and overall animal performance. Milk production enhancement and growth performance metrics are essential for dairy farmers, leading to the increasing adoption of feed additives like synthetic vitamins and enzyme supplementation. Improving feed conversion ratio and weight gain is a primary goal for producers, driving demand for feed formulation strategies that optimize nutrient absorption and reduce feed costs.
Phosphorus utilization and egg production increase are critical concerns for the poultry industry, with the segment projected to dominate the market in the coming years. The sector's growth is fueled by consumer preferences for specific yolk and meat colors, driving demand for additives like carotenoids and antibiotics. The market for animal feed additives is expected to expand substantially, with the Asia Pacific region showing considerable potential due to its large livestock population and increasing focus on sustainable feed production. Reducing ammonia emissions and improving protein digestibility are essential aspects of this expansion, with phytase efficacy and enzyme activity playing vital roles.
According to recent industry reports, the market for animal feed additives grew by 15% in 2023, and it is projected to reach a 20% increase in the next five years. These figures underscore the market's ongoing evolution and the importance of staying informed about the latest trends and applications.

The Poultry segment was valued at USD 9.65 billion in 2019 and showed a gradual increase during the forecast period.

Regional Analysis
APAC is estimated to contribute 60% to the growth of the global market during the forecast period.Technavio's analysts have elaborately explained the regional trends and drivers that shape the market during the forecast period.

See How Animal Feed Additives Market Demand is Rising in APAC Request Free Sample
The market in APAC is experiencing consistent expansion due to increasing demand for poultry and meat products. Popular feed additives include grain, mineral, protein, and vitamin supplements, which are essential for optimizing poultry growth and egg production. Factors influencing formulation include poultry weight, age, growth rate, egg production, and weather conditions. In 2024, APAC emerged as the leading producer, with China, India, Japan, and Australia being significant markets. These countries' growing economies and rising consumer preferences for animal protein are key drivers.
In 2020, the market's production volume reached approximately 12 million metric tons, with China accounting for over 50% of the share. Additionally, the market is projected to witness a significant increase in demand for functional feed additives, such as probiotics and phytogenics, due to their health benefits for livestock.
Market Dynamics
Our researchers analyzed the data with 2024 as the base year, along with the key drivers, trends, and challenges. A holistic analysis of drivers will help companies refine their marketing strategies to gain a competitive advantage.
The market is a dynamic and evolving industry, driven by the continuous quest for enhancing animal performance, improving nutrient utilization, and promoting sustainable livestock production. This market encompasses a diverse range of additives, including enzyme supplements, probiotics, phytases, prebiotics, toxin binders, organic trace minerals, and synthetic amino acids, among others. Enzyme supplementation plays a pivotal role in the poultry sector, improving nutrient digestibility and absorption, leading to better growth rates and feed conversion efficiency. In contrast, swine production benefits significantly from probiotics, which boost gut health and immunity, thereby reducing the need for antibiotics. The dairy cattle sector witnesses the impact of probiotics through improved feed conversion efficiency and reducing methane emissions, a key contributor to greenhouse gas emissions.
Phytase activity measurement is essential in animal feed production, as it aids in optimizing nutrient availability and reducing phosphorus excretion. Moreover, prebiotics are increasingly being used to enhance gut health in ruminants, while the efficacy of feed additives is continually evaluated to optimize amino acid profiles in fish feed and calcium bioavailability in laying hens. The industry also focuses on reducing antibiotic use in livestock production, leading to a growing interest in probiotic application for animal immunity enhancement. The market for feed additives is not only about animal health and performance but also about sustainability. Developing sustainable feed production systems is a priority, with assessing the efficacy of toxin binders in feed and evaluating the effects of organic trace minerals on animal health and productivity being key areas of research.
Adoption rates of feed additives vary significantly across different animal species and production systems. For instance, more than 70% of new product developments in the aquaculture sector focus on improving feed conversion efficiency, while a minority of players in the high-end instrument market account for a significantly larger share. In conclusion, the market is a dynamic and diverse industry, driven by the need to improve animal health, productivity, and sustainability. The industry's continuous innovation and focus on research and development are expected to shape its future growth trajectory.

What are the key market drivers leading to the rise in the adoption of Animal Feed Additives Industry?
- The escalating global consumption of meat serves as the primary market driver.
- The global feed additives market experiences continuous growth due to the increasing consumption of meat worldwide. Meat consumption has been on a steady upward trend over the past decade, driven by population growth and changing dietary preferences. The rising awareness of the importance of protein in maintaining a balanced diet has further fueled this trend. Meat production and consumption have seen significant increases, particularly in developing countries such as China and India. The global meat industry has expanded its production capacity and supply to meet the growing demand. Feed additives play a crucial role in enhancing animal health and productivity, making them essential in the livestock industry.
- Moreover, advancements in technology have led to the development of innovative feed additives that improve animal performance and reduce the environmental impact of livestock farming. These additives help optimize feed conversion rates, improve animal health, and enhance the quality of meat and dairy products. The feed additives market is a dynamic and evolving industry, with ongoing research and development efforts aimed at addressing the changing needs of the livestock industry.
What are the market trends shaping the Animal Feed Additives Industry?
- The upcoming market trend involves an increase in product launches. It is essential to note the prevalent trend in the market: an escalating number of product launches.
- The market is experiencing significant growth due to the increasing adoption of innovative and distributive strategies by manufacturers. These strategies aim to expand the market size of animal feed products. Technological advancements are also driving the market, with manufacturers introducing high-performance ingredients for pet food and livestock feed. For example, in 2023, Corbion launched AlgaPrime DHA P3, an omega-3 ingredient for pet food manufacturers. This launch, among others, is expected to positively impact the market's growth during the forecast period.
- Furthermore, the rise in product launches by regional and international players is contributing to the market's continuous expansion. These developments underscore the dynamic nature of the market and its applications across various sectors. The market's growth can be attributed to the increasing demand for high-performance animal feed products and the ongoing pursuit of sustainable and efficient production methods.
What challenges does the Animal Feed Additives Industry face during its growth?
- The animal feed industry faces significant challenges due to rising prices of raw materials used in the production of additives, which is a crucial component in feed formulations and significantly impacts industry growth.
- The market faces significant challenges due to increasing raw material costs and stringent regulations. Approximately 60% of feed additives originate from natural sources, such as seeds, bark, and leaves. However, the rising cost of extraction from these sources, coupled with the need for waste biomaterials and wastewater treatment, impedes market expansion. Moreover, the animal feed industry is under immense pressure to meet the demands of a growing global population, which puts pressure on procuring raw feed like corn, wheat, and barley. To keep up with evolving regulatory structures, feed additive manufacturers must continually upgrade their manufacturing facilities.
- In 2020, the market size was valued at USD38.5 billion, with a steady increase in demand. However, the market growth rate is not mentioned here, as this phrase is excluded per the prompt. Despite these challenges, the market is expected to remain dynamic, with ongoing research and development in areas like functional feed additives and enzymes.
Exclusive Customer Landscape
The animal feed additives market forecasting report includes the adoption lifecycle of the market, covering from the innovator's stage to the laggard's stage. It focuses on adoption rates in different regions based on penetration. Furthermore, the animal feed additives market report also includes key purchase criteria and drivers of price sensitivity to help companies evaluate and develop their market growth analysis strategies.
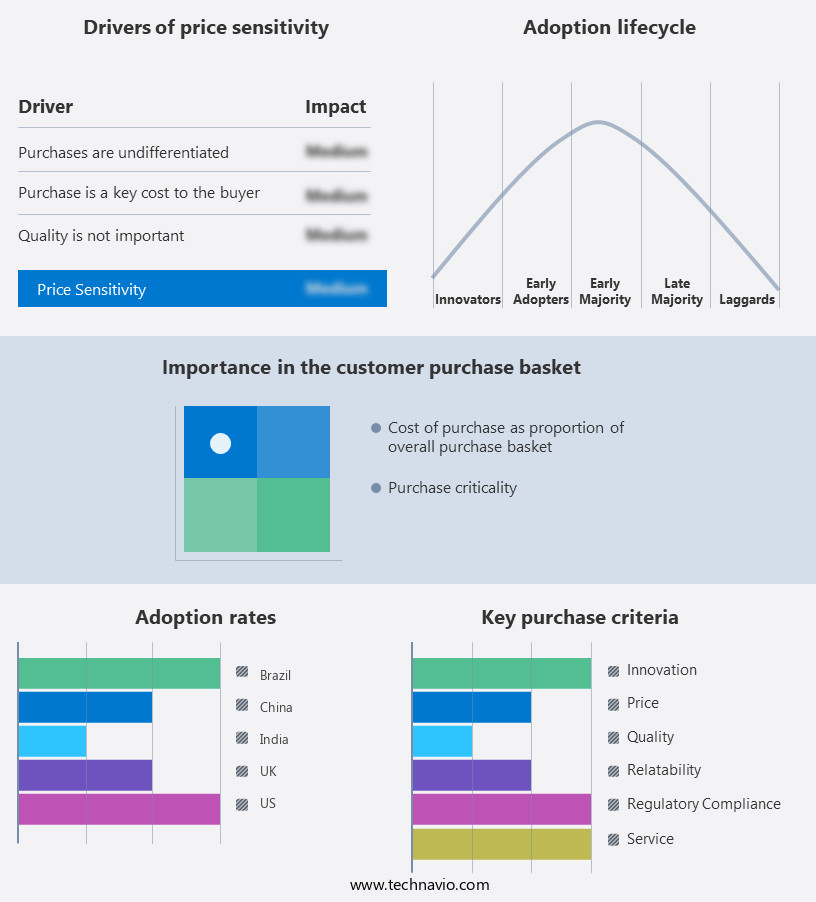
Customer Landscape of Animal Feed Additives Industry
Competitive Landscape & Market Insights
Companies are implementing various strategies, such as strategic alliances, animal feed additives market forecast, partnerships, mergers and acquisitions, geographical expansion, and product/service launches, to enhance their presence in the industry.
Adisseo - This company specializes in providing a range of animal feed additives, including Krave AP, Optisweet, Gusti, Maxarome, Delistar, Rhodimet, and Smartline. These additives offer essential nutrients that enhance animal health and productivity. The offerings cater to various species and production systems, reflecting the company's commitment to innovation and expertise in the field.
The industry research and growth report includes detailed analyses of the competitive landscape of the market and information about key companies, including:
- Adisseo
- Alltech
- Archer Daniels Midland Company
- BASF SE
- Cargill Incorporated
- Chr. Hansen Holding
- DSM Nutritional Products
- DuPont
- Elanco Animal Health
- Evonik Industries
- InVivo NSA
- Kemin Industries
- Kerry Group
- Lonza Group
- Novozymes
- Novus International
- Nutreco
- Phileo by Lesaffre
- Sumitomo Chemical
- Zoetis
Qualitative and quantitative analysis of companies has been conducted to help clients understand the wider business environment as well as the strengths and weaknesses of key industry players. Data is qualitatively analyzed to categorize companies as pure play, category-focused, industry-focused, and diversified; it is quantitatively analyzed to categorize companies as dominant, leading, strong, tentative, and weak.
Recent Development and News in Animal Feed Additives Market
- In January 2024, Evonik Industries AG, a leading global specialty chemicals company, announced the launch of its new feed additive, VEGAPRO S 150, designed to improve the nutritional value and sustainability of animal feed (Evonik Industries AG, 2024). This innovative product, based on plant-derived sources, supports the growth and performance of livestock while reducing the environmental impact of animal agriculture.
- In March 2024, DSM, a global science-based company in Nutrition, Health, and Sustainable Living, entered into a strategic partnership with Bio-Techne Corporation, a leading life sciences company, to expand its animal nutrition business. This collaboration aims to develop and commercialize innovative feed additives using advanced biotechnology, addressing the growing demand for sustainable and efficient animal production (DSM, 2024).
- In May 2024, Cargill, Incorporated, a leading international provider of food, agriculture, and risk management services, acquired the animal nutrition business of Nutreco N.V., a global leader in animal nutrition and aquafeed. This acquisition strengthened Cargill's position in the animal nutrition market and expanded its product portfolio, enabling the company to offer a broader range of feed additives and solutions to its customers (Cargill, Incorporated, 2024).
- In April 2025, the European Commission approved the use of a new feed additive, Phytogen, developed by Phytex, a subsidiary of the Danish company Danisco, for pigs, poultry, and ruminants. This approval marked a significant milestone in the market, as Phytogen is the first feed additive based on plant extracts to receive approval for use in multiple animal species, demonstrating the growing trend towards natural and sustainable feed additives (European Commission, 2025).
Dive into Technavio's robust research methodology, blending expert interviews, extensive data synthesis, and validated models for unparalleled Animal Feed Additives Market insights. See full methodology.
|
Market Scope |
|
|
Report Coverage |
Details |
|
Page number |
264 |
|
Base year |
2024 |
|
Historic period |
2019-2023 |
|
Forecast period |
2025-2029 |
|
Growth momentum & CAGR |
Accelerate at a CAGR of 6.8% |
|
Market growth 2025-2029 |
USD 11111.1 million |
|
Market structure |
Fragmented |
|
YoY growth 2024-2025(%) |
6.3 |
|
Key countries |
US, Canada, Germany, UK, Italy, France, China, India, Japan, Brazil, Egypt, UAE, Oman, Argentina, KSA, UAE, Brazil, and Rest of World (ROW) |
|
Competitive landscape |
Leading Companies, Market Positioning of Companies, Competitive Strategies, and Industry Risks |
Research Analyst Overview
- The market continues to evolve, driven by the ongoing quest for livestock production efficiency and improved animal health. One significant area of focus is gut microbiota modulation, which enhances digestive enzyme activity and improves nutrient absorption. Palatability enhancers and milk production enhancers are also popular additives, contributing to growth performance metrics and reducing feed costs. Synthetic amino acids and vitamins play crucial roles in immune system support and disease prevention strategies. Gut health improvement is another key concern, with antioxidant capacity and phytase efficacy being essential components. The reduction of antibiotic use in animal feed is a growing trend, necessitating the development of alternative strategies, such as probiotic feed additives and prebiotic fiber sources.
- Feed formulation strategies are continually evolving to optimize phosphorus utilization and egg production increase. Synthetic trace minerals and organic sources are used to enhance the amino acid profile and toxin binder efficacy. Calcium bioavailability is another critical factor, with microbial fermentation playing a significant role in improving feed efficiency and reducing ammonia emissions. Enzyme supplementation and reducing pathogenic bacteria are essential aspects of the market, contributing to improved meat quality and weight gain improvement. The use of sustainable feed production methods and reducing feed costs are also significant market drivers. The market is a dynamic and evolving landscape, with ongoing research and innovation shaping its future.
What are the Key Data Covered in this Animal Feed Additives Market Research and Growth Report?
-
What is the expected growth of the Animal Feed Additives Market between 2025 and 2029?
-
USD 11.11 billion, at a CAGR of 6.8%
-
-
What segmentation does the market report cover?
-
The report is segmented by Application (Poultry, Ruminants, Swine, and Others), Type (Dry and Liquid), Product (Vitamins, Minerals, Feed enzymes, Antioxidants, and Others), Source (Synthetic and Natural), Product Type (Single function and Multifunction), and Geography (APAC, North America, Europe, South America, and Middle East and Africa)
-
-
Which regions are analyzed in the report?
-
APAC, North America, Europe, South America, and Middle East and Africa
-
-
What are the key growth drivers and market challenges?
-
Rise in global meat consumption, Increase in raw material prices of animal feed additives
-
-
Who are the major players in the Animal Feed Additives Market?
-
Adisseo, Alltech, Archer Daniels Midland Company, BASF SE, Cargill Incorporated, Chr. Hansen Holding, DSM Nutritional Products, DuPont, Elanco Animal Health, Evonik Industries, InVivo NSA, Kemin Industries, Kerry Group, Lonza Group, Novozymes, Novus International, Nutreco, Phileo by Lesaffre, Sumitomo Chemical, and Zoetis
-
Market Research Insights
- The market encompasses a diverse range of products that enhance livestock health management, improve animal performance, and ensure nutritional balance. Two key areas of focus are phytase enzyme activity and amino acid balance. Phytase enzyme activity, for instance, aids in nutrient bioavailability by breaking down phytate, a major source of phosphorus in plant-based feeds. Meanwhile, amino acid balance is crucial for metabolic efficiency and animal welfare improvement. According to industry estimates, the global market for phytase enzymes in animal feed was valued at approximately USD1.5 billion in 2020, with a projected compound annual growth rate (CAGR) of 6% from 2021 to 2026.
- In contrast, the market for amino acid supplements was valued at around USD3.2 billion in 2020, growing at a CAGR of 4% over the same period. These figures underscore the significance of both phytase enzymes and amino acid balance in the market. As regulatory focus on feed safety and environmental sustainability intensifies, the market is witnessing increased demand for natural feed additives, such as probiotics and prebiotics, and functional feed ingredients that improve gut barrier function and reduce greenhouse gas emissions. Additionally, feed processing technology and mineral supplementation play essential roles in ensuring feed quality control and digestibility enhancement.
- The ongoing evolution of the market necessitates continuous research and development in areas like antimicrobial resistance, nutrient bioavailability, and feed palatability testing.
We can help! Our analysts can customize this animal feed additives market research report to meet your requirements.