Aquaculture Market Size 2025-2029
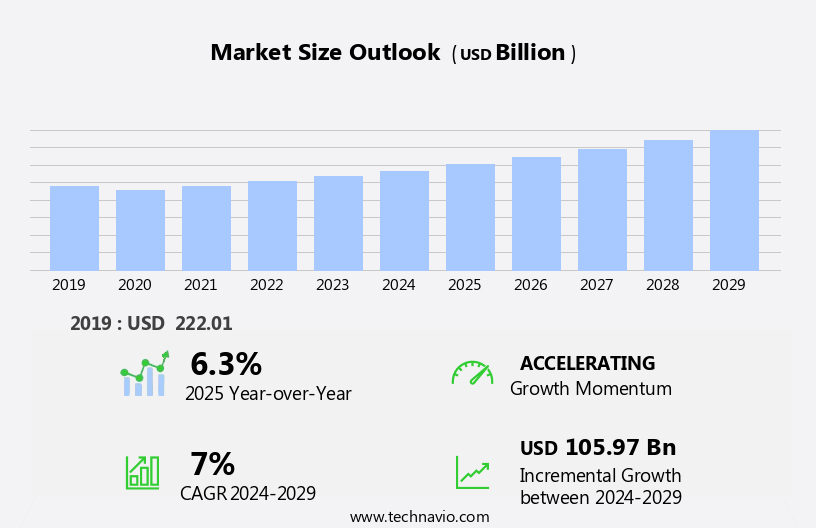
The aquaculture market size is forecast to increase by USD 105.97 billion at a CAGR of 7% between 2024 and 2029.
- The market is experiencing significant growth due to several key factors. One of the primary drivers is the rising awareness of aquaculture products and their benefits, including their sustainability and nutritional value. Another growth factor is the introduction of new aquaculture species, which provides farmers with diverse options and helps mitigate the risks associated with rearing a single species. The demand for seafood continues to rise due to population growth and increasing awareness of the health benefits of protein, fatty acids, vitamins, minerals, and micronutrients. However, the market also faces challenges, such as the growing prevalence of pathogenic diseases among aquaculture species. These diseases can lead to significant economic losses and require costly interventions to prevent and treat them. To mitigate these challenges, there is a growing focus on developing and implementing effective disease management strategies, including the use of vaccines, biosecurity measures, and genetic selection for disease resistance.
What will be the Size of the Aquaculture Market During the Forecast Period?
- Aquaculture, a vital sector in the global food industry, focuses on the cultivation of aquatic animals, including fin fishes such as carp and mollusks like crabs, as well as seaweed. This business encompasses various rearing processes, from stocking and feeding to ensuring optimal growth conditions. Aquaculture's expansion is driven by technological advances and the utilization of cultivable land, making it a significant contributor to the global food supply. Fin fishes, such as carp, are popular choices due to their high market value and rapid growth rates.
- Mollusks, including crabs, are sought after for their rich nutritional content and versatility in various cuisines. Seaweed cultivation is another essential aspect of aquaculture, providing essential nutrients and contributing to the industry's sustainability. Inland fish production is also gaining traction as a solution to meet the growing demand for seafood while reducing pressure on wild fish stocks. The market is dynamic, and influenced by factors such as consumer preferences, environmental concerns, and technological advancements. This sector's future looks promising, with continued innovation and commitment to sustainable practices.
How is this market segmented and which is the largest segment?
The market research report provides comprehensive data (region-wise segment analysis), with forecasts and estimates in "USD billion" for the period 2025-2029, as well as historical data from 2019-2023 for the following segments.
- Type
- Fresh water aquaculture
- Marine water aquaculture
- Brackish water aquaculture
- Culture
- Net pen culture
- Floating cage culture
- Pond culture
- Rice field culture
- Geography
- APAC
- China
- India
- Japan
- Thailand
- Vietnam
- North America
- US
- Europe
- Germany
- Norway
- South America
- Brazil
- Middle East and Africa
- APAC
By Type Insights
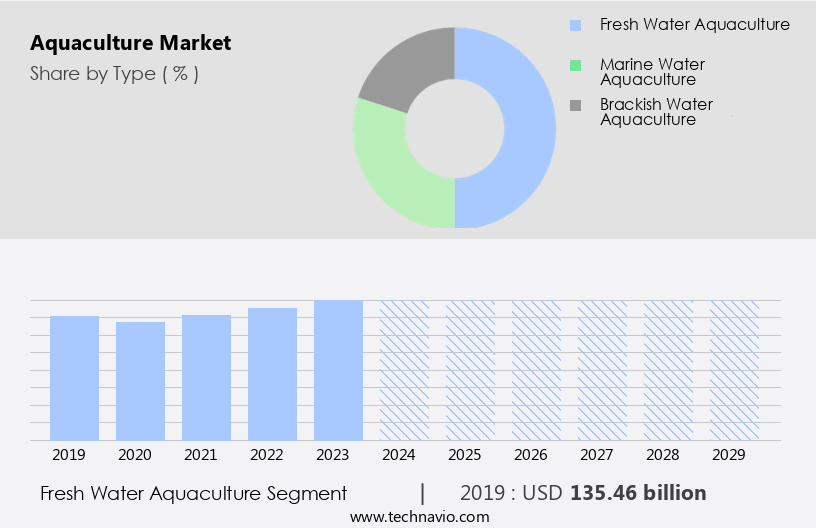
- The fresh water aquaculture segment is estimated to witness significant growth during the forecast period.
Freshwater aquaculture is a significant sector in the global agriculture industry, characterized by the cultivation of various aquatic species in freshwater environments, including ponds, tanks, and cages. The demand for freshwater aquaculture products has increased due to the depletion of wild-caught fish stocks in oceans and rivers. The industry comprises a diverse range of farmers and producers, from small-scale operators to large-scale commercial entities. Freshwater bodies are utilized extensively for producing aquaculture organisms, with common carp (Cyprinus carpio) and catfish (Clarias spp.) being the most commonly farmed species. Productivity in freshwater aquaculture is enhanced through efficient stocking, feeding, and protection from predators.
Furthermore, modern aquaculture practices employ advanced equipment and production methods to optimize time and production efficiency. Organically certified freshwater aquaculture organisms are gaining popularity, making it a trending sector. The industry's growth is influenced by changing lifestyles, working population demographics, and consumer preferences for sustainable and healthier food sources.
Get a glance at the market report of share of various segments Request Free Sample
The fresh water aquaculture segment was valued at USD 135.46 billion in 2019 and showed a gradual increase during the forecast period.
Regional Analysis
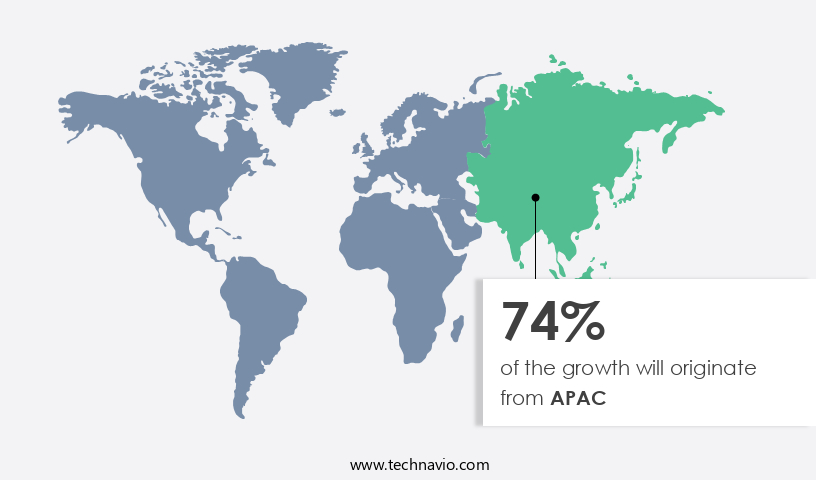
- APAC is estimated to contribute 74% to the growth of the global market during the forecast period.
Technavio's analysts have elaborately explained the regional trends and drivers that shape the market during the forecast period.
For more insights on the market share of various regions, Request Free Sample
The APAC region is a significant contributor to The market, with China leading production, accounting for over 50% of the world's farmed fish, crustaceans, and other aquatic species. Small-scale competitors dominate the regional market, receiving substantial government support, particularly in China, Indonesia, India, and Vietnam. Catla, white-leg shrimp, and Pangas catfish are the most in-demand species, with catfish experiencing the fastest growth at 28% annually. Exports and domestic consumption are both anticipated to increase due to population growth and the need to address undernourishment. Technological advances and the trend toward high-protein diets are further driving the market's expansion. Aquaculture production in inland areas is also gaining traction. The consumption of these nutrient-rich sources, which provide essential protein, fatty acids, vitamins, minerals, and micronutrients, is vital for food supply security as global population growth continues.
Market Dynamics
Our aquaculture market researchers analyzed the data with 2024 as the base year, along with the key drivers, trends, and challenges. A holistic analysis of drivers will help companies refine their marketing strategies to gain a competitive advantage.
What are the key market drivers leading to the rise in the adoption of the Aquaculture Market?
Rising awareness of aquaculture products is the key driver of the market.
- Aquaculture is the cultivation of aquatic animals, including fin fish such as salmon, trout, tench, and carps, as well as mollusks like oysters, clams, and mussels, crustaceans such as shrimp and crabs, and aquatic plants like seaweed. This industry is a significant source of livelihood for many communities and contributes to the agricultural sector by providing a sustainable source of animal protein, essential fatty acids, vitamins, minerals, and micronutrients. The market has experienced growth due to changing lifestyles and consumption patterns, with an increasing preference for healthy, nutritious foods. Additionally, population growth and the need for food supply security have driven demand for protein-rich aquaculture products.
- However, the industry faces challenges such as disease outbreaks, environmental risks, and the need for modernization practices and professionalization. Industrialization in the aquaculture sector has led to the use of bioagricultural inputs, including chemicals, pharmaceuticals, and fertilizers, to enhance productivity and protect against predators. Modernization practices include the use of advanced equipment, production methods, and hygiene standards to ensure disease-free fish and high-quality fish farm products. Aquaculture production methods include open and offshore systems, semi-intensive and intensive farms, and indoor farming using techniques such as aquaponics, which help reduce organic waste and increase fish output. The industry also faces challenges related to water pollution and biodiversity conservation.
What are the market trends shaping the Aquaculture Market?
The introduction of new aquaculture species is the upcoming trend in the market.
- The market is witnessing an expansion in the range of aquatic animals and plants being cultivated. This growth is fueled by the rising consumer preference for fish and seafood as a primary source of protein and the desire to diversify farming practices. Traditionally, aquaculture has focused on a select few species, including salmon, trout, and tilapia. However, the increasing demand for seafood necessitates the cultivation of new species, such as barramundi, cobia, and yellowtail kingfish, which offer high nutritional value, unique flavors, and market appeal. Aquaculture now encompasses a broader scope, including the farming of fin fishes like carp, mollusks such as crabs, and aquatic plants like seaweed.
- Industrialization has brought about advancements in rearing processes, stocking, feeding, protection from predators, and productivity. Bioagricultural inputs, including bio-pesticides, have been introduced to enhance production efficiency and ensure disease-free fish and shellfish. The changing lifestyles and growing working population have led to increased consumption patterns, driving the need for modernization practices in the aquaculture industry. This includes the use of equipment, advanced production methods, and adherence to industry standards for hygiene and water circulation, filtration, and fish farm quality. Environmental risks, such as water pollution and genetic concepts, are being addressed through indoor fishing farms, vegan and vegetarian diets, and the adoption of practices like aquaponics, which help reduce organic waste and increase fish output.
What challenges does the aquaculture Market face during its growth?
The growing prevalence of pathogenic diseases among aquaculture species is a key challenge affecting market growth.
- The market faces a significant challenge with the prevalence of diseases among aquatic animals, including fin fishes, carp, mollusks, crabs, and other aquatic plants. Seafood is a vital source of livelihood and animal protein for many populations, particularly in the US, where consumption patterns continue to shift towards high-protein diets. However, diseases can decrease productivity and profitability in the industry, with losses reaching billions of dollars annually. For instance, diseases in farmed oysters, shrimp, abalone, and other finfish species can impact the quality, growth, and survival of these organisms. The stressful and crowded conditions of aquaculture environments exacerbate the impact of diseases.
- Aquatic plants, including seaweed, are also susceptible to diseases, which can reduce the efficiency of crop production and impact the availability of bioagricultural inputs such as bio-pesticides. The use of modernization practices, such as industrialization, professionalization, and modern production methods, can help mitigate the risk of diseases by improving water circulation, filtration, fish farm quality, and hygiene standards. However, the environmental risks associated with the use of chemicals, pharmaceuticals, and fertilizers in aquaculture must be carefully managed to ensure sustainability and food supply security. Technological advances, such as aquaponics, indoor fishing farms, and reducing organic waste, can help increase fish output and reduce the need for traditional fishing techniques.
Exclusive Customer Landscape
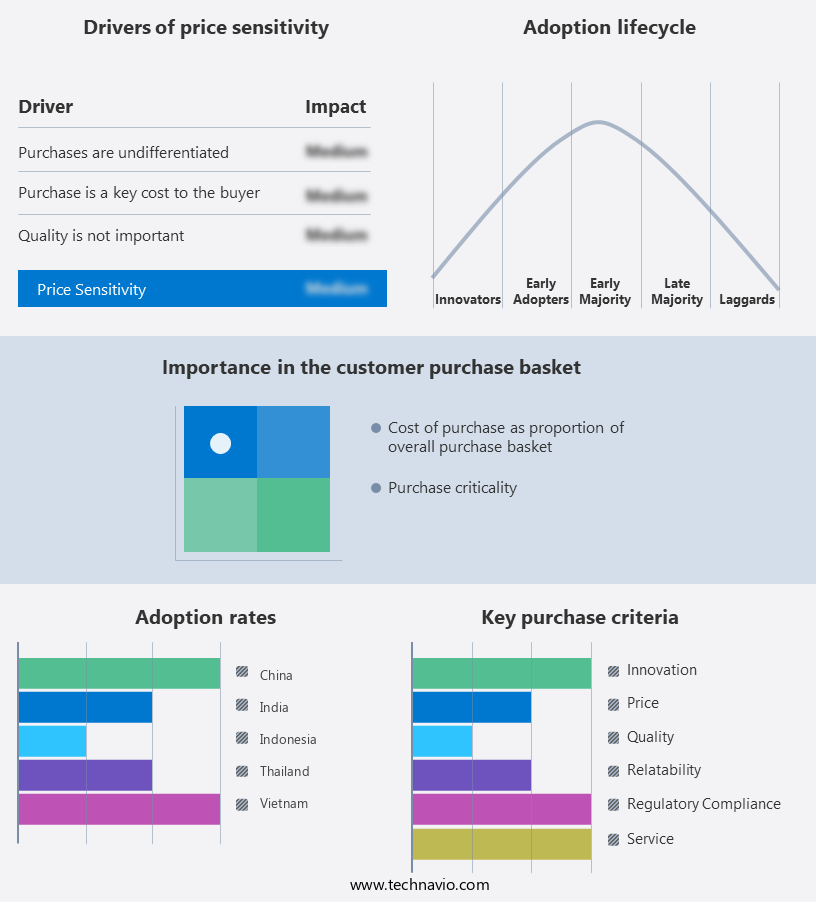
The aquaculture market forecasting report includes the adoption lifecycle of the market, covering from the innovator's stage to the laggard's stage. It focuses on adoption rates in different regions based on penetration. Furthermore, the market report also includes key purchase criteria and drivers of price sensitivity to help companies evaluate and develop their market growth analysis strategies.
Customer Landscape
Key Companies & Market Insights
Companies are implementing various strategies, such as strategic alliances, market forecast, partnerships, mergers and acquisitions, geographical expansion, and product/service launches, to enhance their presence in the market.
Austevoll Seafood ASA: The company offers aquaculture such as Russian salmon, which is farmed in the clear and cold waters along the Norwegian coast.
The aquaculture market research and growth report includes detailed analyses of the competitive landscape of the market and information about key companies, including:
- Alpha Aqua AS
- BKV Industries Ltd.
- Blue Ridge Aquaculture Inc
- Camanchaca SA
- Cooke Aquaculture Inc.
- Farallon Aquaculture
- Huon Aquaculture
- Leroy Seafood Group ASA
- Maruha Nichiro Corp.
- Mitsubishi Corp.
- Mowi ASA
- NIREUS AQUACULTURE
- Nissui Corp.
- PF Bakkafrost
- SalMar ASA
- Stolt Nielsen Ltd.
- Thai Union Group PCL
- The Waterbase Ltd.
Qualitative and quantitative analysis of companies has been conducted to help clients understand the wider business environment as well as the strengths and weaknesses of key market players. Data is qualitatively analyzed to categorize companies as pure play, category-focused, industry-focused, and diversified; it is quantitatively analyzed to categorize companies as dominant, leading, strong, tentative, and weak.
Research Analyst Overview
Aquaculture, the farming of aquatic animals and plants, has emerged as a significant contributor to the global food supply, particularly in the realm of animal protein sources. This industry encompasses a diverse range of organisms, from finfish and mollusks to aquatic plants and seaweed. Aquatic animals, such as carp, salmon, trout, tench, and various shellfish, are increasingly being reared using modern production methods. These methods include stocking, feeding, protection from predators, and optimizing rearing processes for maximum productivity. Finfish generics like carp and mollusks such as crabs are popular choices due to their adaptability and high demand in various markets.
Moreover, industrialization and professionalization have played a pivotal role in the growth of the aquaculture sector. Advancements in technology, including bioagricultural inputs like bio-pesticides and fertilizers, have improved production efficiency and ensured disease-free fish and shellfish. The changing lifestyles and working population have led to a shift in consumption patterns, with an increasing preference for high-protein diets. Aquaculture has responded to this trend by focusing on increasing fish output through various means, including offshore and open aquaculture, semi-intensive and intensive farms, and indoor farming. The agricultural sector's modernization practices have also influenced the aquaculture industry. Innovations in water circulation, filtration, and fish farm quality have ensured that the industry adheres to stringent hygiene standards.
However, environmental risks, such as water pollution and the potential impact on biodiversity, remain concerns that must be addressed. The growing vegan and vegetarian population has led to the exploration of plant-based items derived from aquatic plants, such as sea-chi, sea-beet kraut, and seaweed kimchi. These plant-based items offer a sustainable alternative to animal protein sources and contribute to reducing organic waste. Genetic concepts have also found their way into the aquaculture industry, with research focusing on genetic variation and fish reproduction using chromosomes. This research has led to the production of disease-resistant and high-yielding fish strains. The aquaculture industry is a significant source of livelihood for many communities around the world.
|
Aquaculture Market Scope |
|
|
Report Coverage |
Details |
|
Page number |
206 |
|
Base year |
2024 |
|
Historic period |
2019-2023 |
|
Forecast period |
2025-2029 |
|
Growth momentum & CAGR |
Accelerate at a CAGR of 7% |
|
Market Growth 2025-2029 |
USD 105.97 billion |
|
Market structure |
Fragmented |
|
YoY growth 2024-2025(%) |
6.3 |
|
Key countries |
China, India, Indonesia, Vietnam, Thailand, Norway, US, Brazil, Japan, and Germany |
|
Competitive landscape |
Leading Companies, Market Positioning of Companies, Competitive Strategies, and Industry Risks |
What are the Key Data Covered in this Market Research and Growth Report?
- CAGR of the market during the forecast period
- Detailed information on factors that will drive the market growth and forecasting between 2025 and 2029
- Precise estimation of the size of the market and its contribution of the market in focus to the parent market
- Accurate predictions about upcoming market growth and trends and changes in consumer behaviour
- Growth of the market across APAC, North America, Europe, South America, and Middle East and Africa
- Thorough analysis of the market's competitive landscape and detailed information about companies
- Comprehensive analysis of factors that will challenge the growth of market companies
We can help! Our analysts can customize this market research report to meet your requirements. Get in touch
 RIA -
RIA - 
