Artificial Intelligence (AI) Chips Market Analysis, Size, and Forecast 2026-2030: North America (US, Canada, and Mexico), Europe (Germany, France, and UK), APAC (China, Japan, and South Korea), South America (Brazil and Argentina), Middle East and Africa (UAE, Saudi Arabia, and South Africa), and Rest of World (ROW)

Artificial Intelligence (AI) Chips Market Analysis, Size, and Forecast 2026-2030:
North America (US, Canada, and Mexico), Europe (Germany, France, and UK), APAC (China, Japan, and South Korea), South America (Brazil and Argentina), Middle East and Africa (UAE, Saudi Arabia, and South Africa), and Rest of World (ROW)

Published: Mar 2026 316 Pages SKU: IRTNTR41328

Market Overview at a Glance

$154.93 B
Market Opportunity
24.3%
CAGR 2025 - 2030
41.7%
North America Growth
$16.70 B
ASICs segment 2024

Artificial Intelligence (AI) Chips Market Size 2026-2030

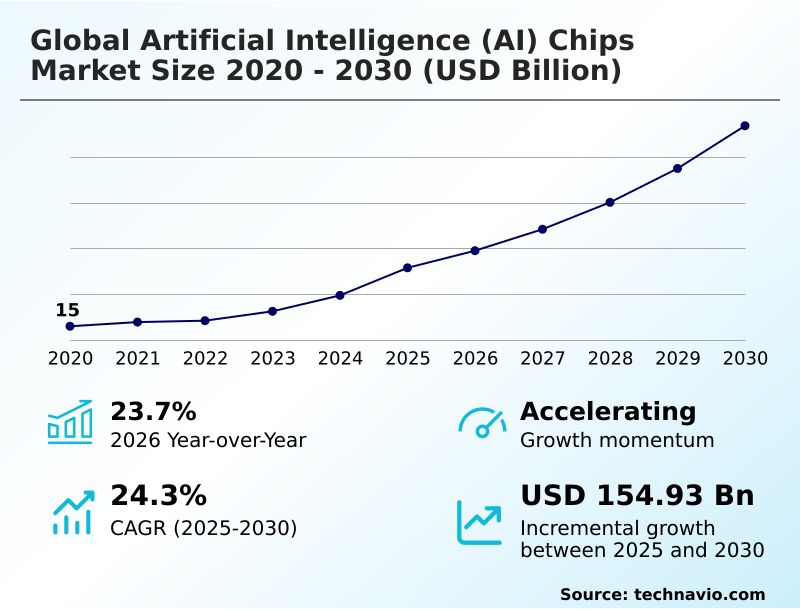
The artificial intelligence (ai) chips market size is valued to increase by USD 154.93 billion, at a CAGR of 24.3% from 2025 to 2030. Proliferation of big data and imperative for advanced data processing will drive the artificial intelligence (ai) chips market.

Major Market Trends & Insights

  • North America dominated the market and accounted for a 41.7% growth during the forecast period.
  • By Product - ASICs segment was valued at USD 16.70 billion in 2024
  • By End-user - Media and advertising segment accounted for the largest market revenue share in 2024

Market Size & Forecast

  • Market Opportunities: USD 218.67 billion
  • Market Future Opportunities: USD 154.93 billion
  • CAGR from 2025 to 2030 : 24.3%

Market Summary

  • The Artificial Intelligence (AI) Chips Market is undergoing a fundamental transformation, driven by the escalating complexity of AI workloads and the demand for specialized hardware. This evolution is fostering a highly competitive environment where innovation in custom silicon and parallel processing architecture is paramount.
  • The proliferation of big data from sources like IoT devices and social media creates a perpetual need for more powerful computational hardware to extract actionable insights. For example, in retail, AI-driven supply chain optimization relies on chips that can process vast datasets in real-time to forecast demand, reducing inventory costs and improving efficiency.
  • However, the industry grapples with challenges such as the extreme technical complexity of hardware-software co-design and the high capital investment required for semiconductor fabrication.
  • Architectural diversification toward solutions like the field programmable gate array and application specific integrated circuit is a key trend, moving the market away from general-purpose processors to purpose-built silicon for specific tasks from the cloud to the intelligent edge.

What will be the Size of the Artificial Intelligence (AI) Chips Market during the forecast period?

Get Key Insights on Market Forecast (PDF) Request Free Sample

How is the Artificial Intelligence (AI) Chips Market Segmented?

The artificial intelligence (ai) chips industry research report provides comprehensive data (region-wise segment analysis), with forecasts and estimates in "USD million" for the period 2026-2030, as well as historical data from 2020-2024 for the following segments.
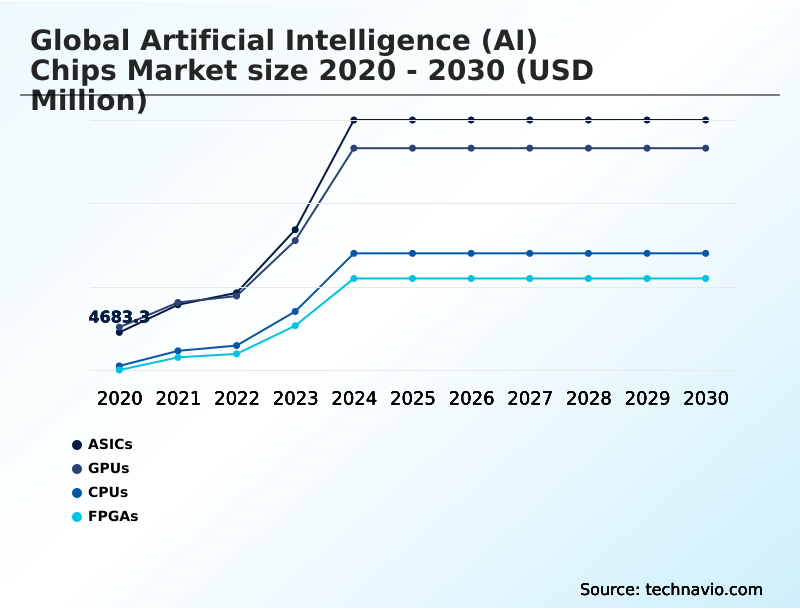
  • Product
    • ASICs
    • GPUs
    • CPUs
    • FPGAs
  • End-user
    • Media and advertising
    • BFSI
    • IT and telecommunication
    • Others
  • Type
    • Cloud
    • Edge
  • Geography
    • North America
      • US
      • Canada
      • Mexico
    • Europe
      • Germany
      • France
      • UK
    • APAC
      • China
      • Japan
      • South Korea
    • South America
      • Brazil
      • Argentina
    • Middle East and Africa
      • UAE
      • Saudi Arabia
      • South Africa
    • Rest of World (ROW)

By Product Insights

The asics segment is estimated to witness significant growth during the forecast period.

The application specific integrated circuit segment is defined by bespoke design, where custom silicon is engineered to perform a singular function with maximum efficiency.

This approach to hardware acceleration is ideal for mature, high-volume AI workload optimization where the underlying algorithms are stable. By hardwiring computational flows, these chips deliver unparalleled performance-per-watt metric, a critical advantage for large-scale data center deployments.

Unlike a wafer-scale engine, an ASIC trades flexibility for peak operational excellence, drastically reducing inference latency for its designated task.

This specialization makes the deep learning accelerator the ultimate solution for power-efficient processing in environments where cost and energy consumption are paramount, improving performance-per-watt by over 50% compared to general-purpose hardware.

Request Free Sample

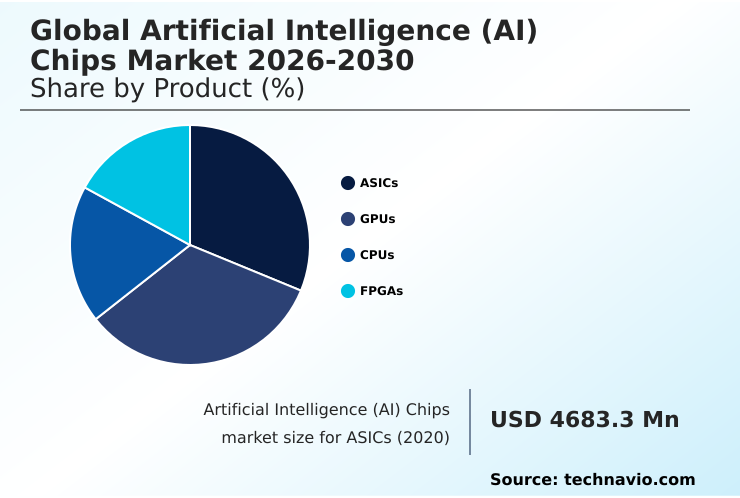
The ASICs segment was valued at USD 16.70 billion in 2024 and showed a gradual increase during the forecast period.

Request Free Sample

Regional Analysis

North America is estimated to contribute 41.7% to the growth of the global market during the forecast period.Technavio’s analysts have elaborately explained the regional trends and drivers that shape the market during the forecast period.

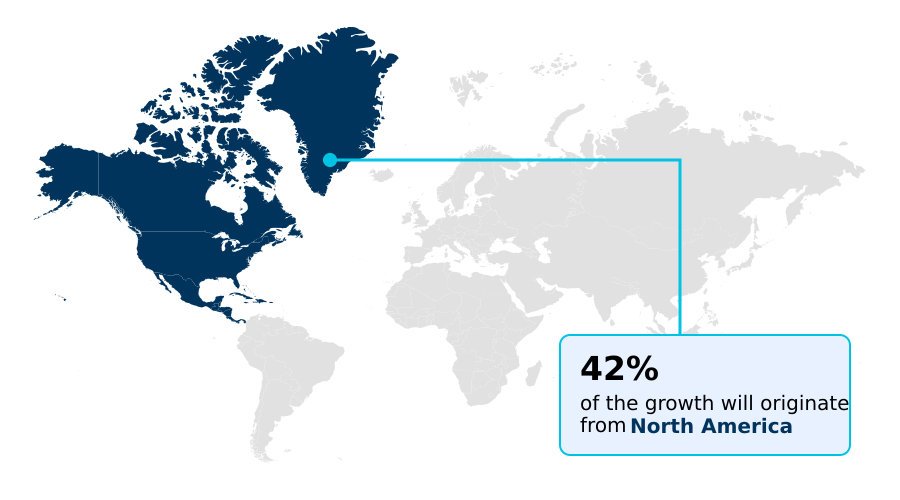
See How Artificial Intelligence (AI) Chips Market Demand is Rising in North America Request Free Sample

The geographic landscape is led by North America, which accounts for 41.7% of the market's incremental growth, fueled by intense data center acceleration and innovation.

Meanwhile, APAC is the fastest-growing region, with a projected CAGR of 25.1%, driven by expanding digital economies and government-led initiatives.

In this competitive environment, the adoption of the field programmable gate array and the reconfigurable dataflow unit is increasing for applications requiring real-time inference. Advanced interconnect technology is critical for linking thousands of AI superchips into cohesive systems.

These systems are designed for low-latency processing, a key requirement for both cloud services and emerging edge applications that utilize digital signal processors and in-memory computing to handle complex workloads efficiently.

Market Dynamics

Our researchers analyzed the data with 2025 as the base year, along with the key drivers, trends, and challenges. A holistic analysis of drivers will help companies refine their marketing strategies to gain a competitive advantage.

  • A comprehensive review of the Global Artificial Intelligence (AI) Chips Market 2026-2030 requires analyzing several key facets. The Global Artificial Intelligence (AI) Chips Market 2026-2030 segmentation reveals distinct categories, with ASICs in artificial intelligence applications providing peak efficiency, while GPUs for deep learning training offer programmability, and FPGAs for low-latency inference address real-time needs.
  • The core Global Artificial Intelligence (AI) Chips Market 2026-2030 drivers include the relentless growth of data and the expanding adoption of AI. Key Global Artificial Intelligence (AI) Chips Market 2026-2030 trends point toward specialization, including the rise of energy efficient AI hardware solutions and specific edge computing AI processor trends.
  • Examining the Global Artificial Intelligence (AI) Chips Market 2026-2030 regional outlook shows varied adoption rates and strategic priorities across geographies. However, significant Global Artificial Intelligence (AI) Chips Market 2026-2030 challenges persist, such as high AI chip manufacturing cost analysis and persistent AI chip software ecosystem challenges.
  • The semiconductor technology impact on AI is profound, enabling innovations like chiplet technology for AI processors and the use of high bandwidth memory in AI accelerators. Advanced concepts such as in-memory computing for AI and explorations into neuromorphic chip architecture benefits are pushing boundaries.
  • The Global Artificial Intelligence (AI) Chips Market 2026-2030 vendor analysis highlights the race to develop custom silicon for cloud AI and specialized AI hardware for generative models. In business operations, such as supply chain management, deploying these technologies has improved forecast accuracy by more than double compared to legacy systems.

What are the key market drivers leading to the rise in the adoption of Artificial Intelligence (AI) Chips Industry?

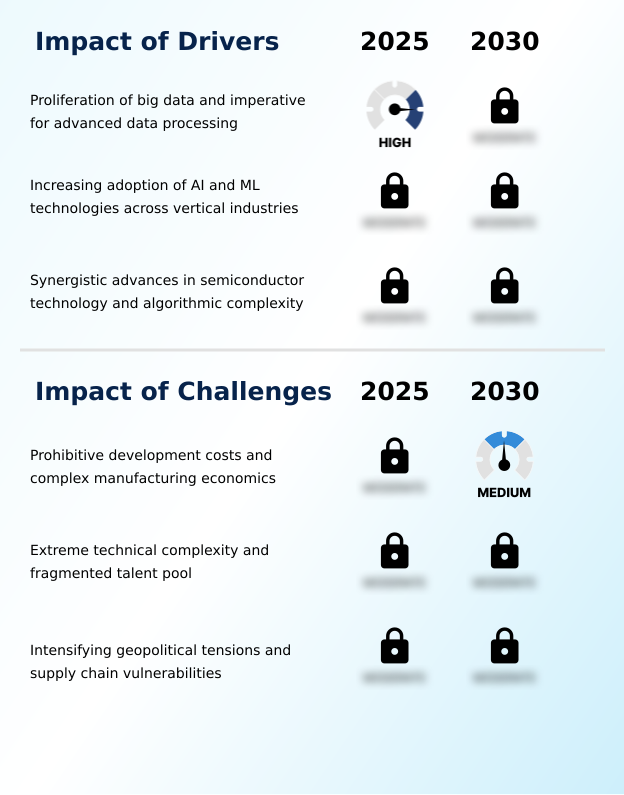
  • The proliferation of big data and the corresponding imperative for advanced data processing capabilities are key drivers for the market.

  • The market is fundamentally driven by the need to process vast parallel data streams for computational-intensive tasks. The established parallel processing architecture of the graphics processing unit remains a cornerstone for achieving high model training performance.
  • However, demand is growing for specialized hardware like the tensor processing unit and the neural processing unit, which are purpose-built for AI workloads.
  • Organizations are building out massive cloud AI infrastructure, with some hyperscalers increasing their AI compute capacity by over 60% annually.
  • This infrastructure relies on processors equipped with high bandwidth memory to feed data to the cores efficiently, ensuring that the hardware can handle the scale of today's foundation models and deliver actionable insights from big data.

What are the market trends shaping the Artificial Intelligence (AI) Chips Industry?

  • A defining market trend is the move toward architectural diversification. This involves a proliferation of specialized processors designed to meet specific AI workload demands.

  • A primary trend is the diversification toward specialized hardware, including advancements in neuromorphic computing and heterogeneous computing systems. This shift enables more efficient on-device machine learning and supports increasing algorithmic complexity scaling without relying solely on cloud resources. The use of advanced packaging and chiplet design is becoming mainstream, allowing for more powerful and modular processors.
  • For instance, these designs have enabled a 25% increase in computational density on a single package. Furthermore, the focus on adaptive computing is crucial for inference at the edge, where reconfigurable hardware can adapt to new models.
  • The adoption of low-precision computing is another key trend, reducing memory bandwidth requirements by up to 50% in certain applications, which is critical for power-constrained edge devices.

What challenges does the Artificial Intelligence (AI) Chips Industry face during its growth?

  • Prohibitive development costs, combined with complex manufacturing economics, present a key challenge affecting industry growth.

  • Significant challenges persist, rooted in the extreme complexity of semiconductor fabrication and the high cost of electronic design automation software. Managing the thermal design power of high-performance chips remains a critical issue, with cooling systems now accounting for up to 40% of data center energy consumption.
  • The von neumann bottleneck continues to limit performance, driving innovation in hardware-software co-design to bring processing closer to data. The design of a modern system on chip involves intricate computational lithography and verification processes.
  • Furthermore, optimizing the matrix multiplication engine and vector processing units within these chips requires a deep talent pool, but there is a persistent industry shortage, with open roles for skilled engineers increasing by 25% year-over-year.

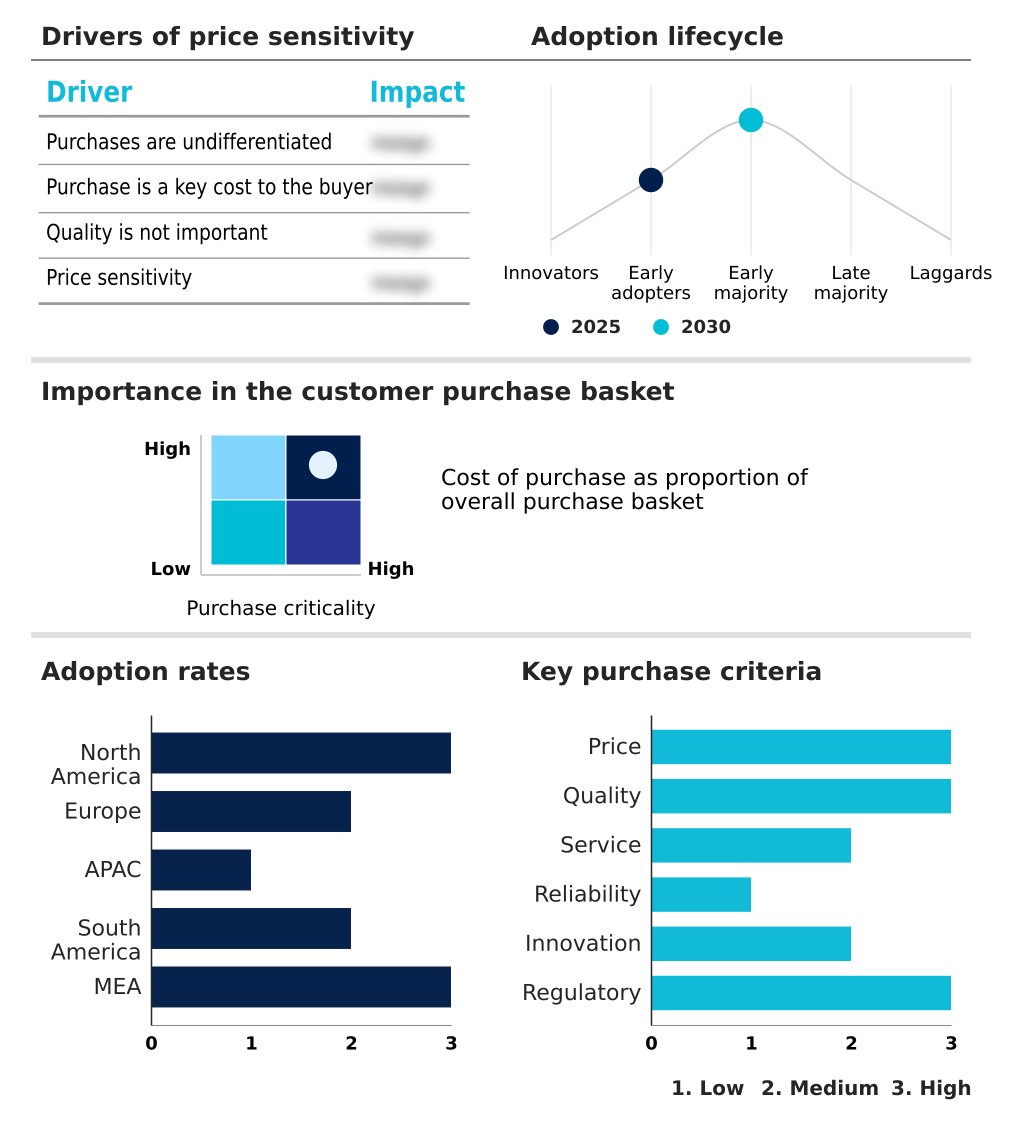
Exclusive Technavio Analysis on Customer Landscape

The artificial intelligence (ai) chips market forecasting report includes the adoption lifecycle of the market, covering from the innovator’s stage to the laggard’s stage. It focuses on adoption rates in different regions based on penetration. Furthermore, the artificial intelligence (ai) chips market report also includes key purchase criteria and drivers of price sensitivity to help companies evaluate and develop their market growth analysis strategies.

Customer Landscape of Artificial Intelligence (AI) Chips Industry

Competitive Landscape

Companies are implementing various strategies, such as strategic alliances, artificial intelligence (ai) chips market forecast, partnerships, mergers and acquisitions, geographical expansion, and product/service launches, to enhance their presence in the industry.

Advanced Micro Devices Inc. - Specialized silicon for high-performance data center training and inference workloads addresses critical computational demands in enterprise AI.

The industry research and growth report includes detailed analyses of the competitive landscape of the market and information about key companies, including:

  • Advanced Micro Devices Inc.
  • Amazon.com Inc.
  • Apple Inc.
  • Arm Ltd.
  • Baidu Inc.
  • Cerebras Systems Inc.
  • Fujitsu Ltd.
  • Graphcore Ltd.
  • Hailo Technologies Ltd.
  • Huawei Technologies Co. Ltd.
  • IBM Corp.
  • Intel Corp.
  • MediaTek Inc.
  • Microsoft Corp.
  • NVIDIA Corp.
  • NXP Semiconductors NV
  • Qualcomm Inc.
  • Rebellions Inc.
  • SambaNova Systems Inc.
  • Samsung Electronics Co. Ltd.

Qualitative and quantitative analysis of companies has been conducted to help clients understand the wider business environment as well as the strengths and weaknesses of key industry players. Data is qualitatively analyzed to categorize companies as pure play, category-focused, industry-focused, and diversified; it is quantitatively analyzed to categorize companies as dominant, leading, strong, tentative, and weak.

Recent Development and News in Artificial intelligence (ai) chips market

  • In March 2025, SoftBank acquired U.S. chip startup Ampere Computing in a strategic move to fortify its own AI infrastructure and capabilities.
  • In August 2025, Saudi Arabia's Humain announced plans for new data centers in Riyadh and Dammam, which are set to be powered by advanced AI chips from U.S. companies Nvidia and AMD.
  • In September 2025, Nvidia announced a substantial investment in OpenAI, a move aimed at deepening the collaboration between the world-leading AI chip designer and a premier AI research and deployment company.
  • In October 2025, Nvidia secured an agreement to supply over 260,000 of its next-generation Blackwell AI chips to South Korea to support the build-out of the country's national AI infrastructure.

Dive into Technavio’s robust research methodology, blending expert interviews, extensive data synthesis, and validated models for unparalleled Artificial Intelligence (AI) Chips Market insights. See full methodology.

Market Scope
Page number 316
Base year 2025
Historic period 2020-2024
Forecast period 2026-2030
Growth momentum & CAGR Accelerate at a CAGR of 24.3%
Market growth 2026-2030 USD 154928.4 million
Market structure Fragmented
YoY growth 2025-2026(%) 23.7%
Key countries US, Canada, Mexico, Germany, France, UK, Italy, Spain, The Netherlands, China, Japan, South Korea, India, Australia, Indonesia, Brazil, Argentina, Chile, UAE, Saudi Arabia, South Africa, Egypt and Nigeria
Competitive landscape Leading Companies, Market Positioning of Companies, Competitive Strategies, and Industry Risks

Request Free Sample

Research Analyst Overview

  • The market's evolution is driven by the need for dedicated hardware acceleration. The landscape is moving beyond the general-purpose graphics processing unit to embrace the application specific integrated circuit and the field programmable gate array. This push for custom silicon, often arranged in a chiplet design with advanced packaging, is essential for creating a powerful deep learning accelerator.
  • Architects are developing heterogeneous computing systems featuring the tensor processing unit and neural processing unit to tackle the von neumann bottleneck. Innovations like the wafer-scale engine and reconfigurable dataflow unit showcase the focus on parallel processing architecture. These complex designs rely on sophisticated electronic design automation tools for computational lithography and semiconductor fabrication.
  • Emerging technologies like in-memory computing and neuromorphic computing promise further gains. For boardroom strategy, adopting low-precision computing is key, as it can reduce data center power usage by 30%. This, combined with advanced interconnect technology and high bandwidth memory on each system on chip, defines the next generation of AI hardware.

What are the Key Data Covered in this Artificial Intelligence (AI) Chips Market Research and Growth Report?

  • What is the expected growth of the Artificial Intelligence (AI) Chips Market between 2026 and 2030?

    • USD 154.93 billion, at a CAGR of 24.3%

  • What segmentation does the market report cover?

    • The report is segmented by Product (ASICs, GPUs, CPUs, and FPGAs), End-user (Media and advertising, BFSI, IT and telecommunication, and Others), Type (Cloud, and Edge) and Geography (North America, Europe, APAC, South America, Middle East and Africa)

  • Which regions are analyzed in the report?

    • North America, Europe, APAC, South America and Middle East and Africa

  • What are the key growth drivers and market challenges?

    • Proliferation of big data and imperative for advanced data processing, Prohibitive development costs and complex manufacturing economics

  • Who are the major players in the Artificial Intelligence (AI) Chips Market?

    • Advanced Micro Devices Inc., Amazon.com Inc., Apple Inc., Arm Ltd., Baidu Inc., Cerebras Systems Inc., Fujitsu Ltd., Graphcore Ltd., Hailo Technologies Ltd., Huawei Technologies Co. Ltd., IBM Corp., Intel Corp., MediaTek Inc., Microsoft Corp., NVIDIA Corp., NXP Semiconductors NV, Qualcomm Inc., Rebellions Inc., SambaNova Systems Inc. and Samsung Electronics Co. Ltd.

Market Research Insights

  • The market is characterized by a dynamic shift toward purpose-built silicon to manage increasingly computational-intensive tasks. This move away from general-purpose hardware is driven by the need for superior model training performance and AI workload optimization. As a result, designs focusing on an improved performance-per-watt metric are becoming standard, with some specialized chips achieving a 40% reduction in inference latency.
  • This focus on efficiency and speed is critical for both large-scale cloud AI infrastructure and power-constrained on-device machine learning applications. The strategic adoption of hardware-software co-design is further enabling these gains, with certain architectures lowering power consumption by over 25% for targeted AI functions, directly impacting the total cost of ownership for enterprises.

We can help! Our analysts can customize this artificial intelligence (ai) chips market research report to meet your requirements.

Get in touch

1. Executive Summary

1.1 Market overview

Executive Summary - Chart on Market Overview
Executive Summary - Data Table on Market Overview
Executive Summary - Chart on Global Market Characteristics
Executive Summary - Chart on Market by Geography
Executive Summary - Chart on Market Segmentation by Product
Executive Summary - Chart on Market Segmentation by End-user
Executive Summary - Chart on Market Segmentation by Type
Executive Summary - Chart on Incremental Growth
Executive Summary - Data Table on Incremental Growth
Executive Summary - Chart on Company Market Positioning

2. Technavio Analysis

2.1 Analysis of price sensitivity, lifecycle, customer purchase basket, adoption rates, and purchase criteria

2.2 Criticality of inputs and Factors of differentiation

Chart on Overview on criticality of inputs and factors of differentiation

2.3 Factors of disruption

Chart on Overview on factors of disruption

2.4 Impact of drivers and challenges

Chart on Impact of drivers and challenges in 2025 and 2030

3. Market Landscape

3.1 Market ecosystem

Chart on Parent Market
Data Table on - Parent Market

3.2 Market characteristics

Chart on Market characteristics analysis

3.3 Value chain analysis

Chart on Value chain analysis

4. Market Sizing

4.1 Market definition

Data Table on Offerings of companies included in the market definition

4.2 Market segment analysis

Market segments

4.3 Market size 2025

4.4 Market outlook: Forecast for 2025-2030

Chart on Global - Market size and forecast 2025-2030 ($ million)
Data Table on Global - Market size and forecast 2025-2030 ($ million)
Chart on Global Market: Year-over-year growth 2025-2030 (%)
Data Table on Global Market: Year-over-year growth 2025-2030 (%)

5. Historic Market Size

5.1 Global Artificial Intelligence (AI) Chips Market 2020 - 2024

Historic Market Size - Data Table on Global Artificial Intelligence (AI) Chips Market 2020 - 2024 ($ million)

5.2 Product segment analysis 2020 - 2024

Historic Market Size - Product Segment 2020 - 2024 ($ million)

5.3 End-user segment analysis 2020 - 2024

Historic Market Size - End-user Segment 2020 - 2024 ($ million)

5.4 Type segment analysis 2020 - 2024

Historic Market Size - Type Segment 2020 - 2024 ($ million)

5.5 Geography segment analysis 2020 - 2024

Historic Market Size - Geography Segment 2020 - 2024 ($ million)

5.6 Country segment analysis 2020 - 2024

Historic Market Size - Country Segment 2020 - 2024 ($ million)

6. Qualitative Analysis

6.1 The impact of AI on global artificial intelligence (AI) chips market

7. Five Forces Analysis

7.1 Five forces summary

Five forces analysis - Comparison between 2025 and 2030

7.2 Bargaining power of buyers

Bargaining power of buyers - Impact of key factors 2025 and 2030

7.3 Bargaining power of suppliers

Bargaining power of suppliers - Impact of key factors in 2025 and 2030

7.4 Threat of new entrants

Threat of new entrants - Impact of key factors in 2025 and 2030

7.5 Threat of substitutes

Threat of substitutes - Impact of key factors in 2025 and 2030

7.6 Threat of rivalry

Threat of rivalry - Impact of key factors in 2025 and 2030

7.7 Market condition

Chart on Market condition - Five forces 2025 and 2030

8. Market Segmentation by Product

8.1 Market segments

Chart on Product - Market share 2025-2030 (%)
Data Table on Product - Market share 2025-2030 (%)

8.2 Comparison by Product

Chart on Comparison by Product
Data Table on Comparison by Product

8.3 ASICs - Market size and forecast 2025-2030

Chart on ASICs - Market size and forecast 2025-2030 ($ million)
Data Table on ASICs - Market size and forecast 2025-2030 ($ million)
Chart on ASICs - Year-over-year growth 2025-2030 (%)
Data Table on ASICs - Year-over-year growth 2025-2030 (%)

8.4 GPUs - Market size and forecast 2025-2030

Chart on GPUs - Market size and forecast 2025-2030 ($ million)
Data Table on GPUs - Market size and forecast 2025-2030 ($ million)
Chart on GPUs - Year-over-year growth 2025-2030 (%)
Data Table on GPUs - Year-over-year growth 2025-2030 (%)

8.5 CPUs - Market size and forecast 2025-2030

Chart on CPUs - Market size and forecast 2025-2030 ($ million)
Data Table on CPUs - Market size and forecast 2025-2030 ($ million)
Chart on CPUs - Year-over-year growth 2025-2030 (%)
Data Table on CPUs - Year-over-year growth 2025-2030 (%)

8.6 FPGAs - Market size and forecast 2025-2030

Chart on FPGAs - Market size and forecast 2025-2030 ($ million)
Data Table on FPGAs - Market size and forecast 2025-2030 ($ million)
Chart on FPGAs - Year-over-year growth 2025-2030 (%)
Data Table on FPGAs - Year-over-year growth 2025-2030 (%)

8.7 Market opportunity by Product

Market opportunity by Product ($ million)
Data Table on Market opportunity by Product ($ million)

9. Market Segmentation by End-user

9.1 Market segments

Chart on End-user - Market share 2025-2030 (%)
Data Table on End-user - Market share 2025-2030 (%)

9.2 Comparison by End-user

Chart on Comparison by End-user
Data Table on Comparison by End-user

9.3 Media and advertising - Market size and forecast 2025-2030

Chart on Media and advertising - Market size and forecast 2025-2030 ($ million)
Data Table on Media and advertising - Market size and forecast 2025-2030 ($ million)
Chart on Media and advertising - Year-over-year growth 2025-2030 (%)
Data Table on Media and advertising - Year-over-year growth 2025-2030 (%)

9.4 BFSI - Market size and forecast 2025-2030

Chart on BFSI - Market size and forecast 2025-2030 ($ million)
Data Table on BFSI - Market size and forecast 2025-2030 ($ million)
Chart on BFSI - Year-over-year growth 2025-2030 (%)
Data Table on BFSI - Year-over-year growth 2025-2030 (%)

9.5 IT and telecommunication - Market size and forecast 2025-2030

Chart on IT and telecommunication - Market size and forecast 2025-2030 ($ million)
Data Table on IT and telecommunication - Market size and forecast 2025-2030 ($ million)
Chart on IT and telecommunication - Year-over-year growth 2025-2030 (%)
Data Table on IT and telecommunication - Year-over-year growth 2025-2030 (%)

9.6 Others - Market size and forecast 2025-2030

Chart on Others - Market size and forecast 2025-2030 ($ million)
Data Table on Others - Market size and forecast 2025-2030 ($ million)
Chart on Others - Year-over-year growth 2025-2030 (%)
Data Table on Others - Year-over-year growth 2025-2030 (%)

9.7 Market opportunity by End-user

Market opportunity by End-user ($ million)
Data Table on Market opportunity by End-user ($ million)

10. Market Segmentation by Type

10.1 Market segments

Chart on Type - Market share 2025-2030 (%)
Data Table on Type - Market share 2025-2030 (%)

10.2 Comparison by Type

Chart on Comparison by Type
Data Table on Comparison by Type

10.3 Cloud - Market size and forecast 2025-2030

Chart on Cloud - Market size and forecast 2025-2030 ($ million)
Data Table on Cloud - Market size and forecast 2025-2030 ($ million)
Chart on Cloud - Year-over-year growth 2025-2030 (%)
Data Table on Cloud - Year-over-year growth 2025-2030 (%)

10.4 Edge - Market size and forecast 2025-2030

Chart on Edge - Market size and forecast 2025-2030 ($ million)
Data Table on Edge - Market size and forecast 2025-2030 ($ million)
Chart on Edge - Year-over-year growth 2025-2030 (%)
Data Table on Edge - Year-over-year growth 2025-2030 (%)

10.5 Market opportunity by Type

Market opportunity by Type ($ million)
Data Table on Market opportunity by Type ($ million)

11. Customer Landscape

11.1 Customer landscape overview

Analysis of price sensitivity, lifecycle, customer purchase basket, adoption rates, and purchase criteria

12. Geographic Landscape

12.1 Geographic segmentation

Chart on Market share by geography 2025-2030 (%)
Data Table on Market share by geography 2025-2030 (%)

12.2 Geographic comparison

Chart on Geographic comparison
Data Table on Geographic comparison

12.3 North America - Market size and forecast 2025-2030

Chart on North America - Market size and forecast 2025-2030 ($ million)
Data Table on North America - Market size and forecast 2025-2030 ($ million)
Chart on North America - Year-over-year growth 2025-2030 (%)
Data Table on North America - Year-over-year growth 2025-2030 (%)
Chart on Regional Comparison - North America
Data Table on Regional Comparison - North America

12.3.1 US - Market size and forecast 2025-2030

Chart on US - Market size and forecast 2025-2030 ($ million)
Data Table on US - Market size and forecast 2025-2030 ($ million)
Chart on US - Year-over-year growth 2025-2030 (%)
Data Table on US - Year-over-year growth 2025-2030 (%)

12.3.2 Canada - Market size and forecast 2025-2030

Chart on Canada - Market size and forecast 2025-2030 ($ million)
Data Table on Canada - Market size and forecast 2025-2030 ($ million)
Chart on Canada - Year-over-year growth 2025-2030 (%)
Data Table on Canada - Year-over-year growth 2025-2030 (%)

12.3.3 Mexico - Market size and forecast 2025-2030

Chart on Mexico - Market size and forecast 2025-2030 ($ million)
Data Table on Mexico - Market size and forecast 2025-2030 ($ million)
Chart on Mexico - Year-over-year growth 2025-2030 (%)
Data Table on Mexico - Year-over-year growth 2025-2030 (%)

12.4 Europe - Market size and forecast 2025-2030

Chart on Europe - Market size and forecast 2025-2030 ($ million)
Data Table on Europe - Market size and forecast 2025-2030 ($ million)
Chart on Europe - Year-over-year growth 2025-2030 (%)
Data Table on Europe - Year-over-year growth 2025-2030 (%)
Chart on Regional Comparison - Europe
Data Table on Regional Comparison - Europe

12.4.1 Germany - Market size and forecast 2025-2030

Chart on Germany - Market size and forecast 2025-2030 ($ million)
Data Table on Germany - Market size and forecast 2025-2030 ($ million)
Chart on Germany - Year-over-year growth 2025-2030 (%)
Data Table on Germany - Year-over-year growth 2025-2030 (%)

12.4.2 France - Market size and forecast 2025-2030

Chart on France - Market size and forecast 2025-2030 ($ million)
Data Table on France - Market size and forecast 2025-2030 ($ million)
Chart on France - Year-over-year growth 2025-2030 (%)
Data Table on France - Year-over-year growth 2025-2030 (%)

12.4.3 UK - Market size and forecast 2025-2030

Chart on UK - Market size and forecast 2025-2030 ($ million)
Data Table on UK - Market size and forecast 2025-2030 ($ million)
Chart on UK - Year-over-year growth 2025-2030 (%)
Data Table on UK - Year-over-year growth 2025-2030 (%)

12.4.4 Italy - Market size and forecast 2025-2030

Chart on Italy - Market size and forecast 2025-2030 ($ million)
Data Table on Italy - Market size and forecast 2025-2030 ($ million)
Chart on Italy - Year-over-year growth 2025-2030 (%)
Data Table on Italy - Year-over-year growth 2025-2030 (%)

12.4.5 Spain - Market size and forecast 2025-2030

Chart on Spain - Market size and forecast 2025-2030 ($ million)
Data Table on Spain - Market size and forecast 2025-2030 ($ million)
Chart on Spain - Year-over-year growth 2025-2030 (%)
Data Table on Spain - Year-over-year growth 2025-2030 (%)

12.4.6 The Netherlands - Market size and forecast 2025-2030

Chart on The Netherlands - Market size and forecast 2025-2030 ($ million)
Data Table on The Netherlands - Market size and forecast 2025-2030 ($ million)
Chart on The Netherlands - Year-over-year growth 2025-2030 (%)
Data Table on The Netherlands - Year-over-year growth 2025-2030 (%)

12.5 APAC - Market size and forecast 2025-2030

Chart on APAC - Market size and forecast 2025-2030 ($ million)
Data Table on APAC - Market size and forecast 2025-2030 ($ million)
Chart on APAC - Year-over-year growth 2025-2030 (%)
Data Table on APAC - Year-over-year growth 2025-2030 (%)
Chart on Regional Comparison - APAC
Data Table on Regional Comparison - APAC

12.5.1 China - Market size and forecast 2025-2030

Chart on China - Market size and forecast 2025-2030 ($ million)
Data Table on China - Market size and forecast 2025-2030 ($ million)
Chart on China - Year-over-year growth 2025-2030 (%)
Data Table on China - Year-over-year growth 2025-2030 (%)

12.5.2 Japan - Market size and forecast 2025-2030

Chart on Japan - Market size and forecast 2025-2030 ($ million)
Data Table on Japan - Market size and forecast 2025-2030 ($ million)
Chart on Japan - Year-over-year growth 2025-2030 (%)
Data Table on Japan - Year-over-year growth 2025-2030 (%)

12.5.3 South Korea - Market size and forecast 2025-2030

Chart on South Korea - Market size and forecast 2025-2030 ($ million)
Data Table on South Korea - Market size and forecast 2025-2030 ($ million)
Chart on South Korea - Year-over-year growth 2025-2030 (%)
Data Table on South Korea - Year-over-year growth 2025-2030 (%)

12.5.4 India - Market size and forecast 2025-2030

Chart on India - Market size and forecast 2025-2030 ($ million)
Data Table on India - Market size and forecast 2025-2030 ($ million)
Chart on India - Year-over-year growth 2025-2030 (%)
Data Table on India - Year-over-year growth 2025-2030 (%)

12.5.5 Australia - Market size and forecast 2025-2030

Chart on Australia - Market size and forecast 2025-2030 ($ million)
Data Table on Australia - Market size and forecast 2025-2030 ($ million)
Chart on Australia - Year-over-year growth 2025-2030 (%)
Data Table on Australia - Year-over-year growth 2025-2030 (%)

12.5.6 Indonesia - Market size and forecast 2025-2030

Chart on Indonesia - Market size and forecast 2025-2030 ($ million)
Data Table on Indonesia - Market size and forecast 2025-2030 ($ million)
Chart on Indonesia - Year-over-year growth 2025-2030 (%)
Data Table on Indonesia - Year-over-year growth 2025-2030 (%)

12.6 South America - Market size and forecast 2025-2030

Chart on South America - Market size and forecast 2025-2030 ($ million)
Data Table on South America - Market size and forecast 2025-2030 ($ million)
Chart on South America - Year-over-year growth 2025-2030 (%)
Data Table on South America - Year-over-year growth 2025-2030 (%)
Chart on Regional Comparison - South America
Data Table on Regional Comparison - South America

12.6.1 Brazil - Market size and forecast 2025-2030

Chart on Brazil - Market size and forecast 2025-2030 ($ million)
Data Table on Brazil - Market size and forecast 2025-2030 ($ million)
Chart on Brazil - Year-over-year growth 2025-2030 (%)
Data Table on Brazil - Year-over-year growth 2025-2030 (%)

12.6.2 Argentina - Market size and forecast 2025-2030

Chart on Argentina - Market size and forecast 2025-2030 ($ million)
Data Table on Argentina - Market size and forecast 2025-2030 ($ million)
Chart on Argentina - Year-over-year growth 2025-2030 (%)
Data Table on Argentina - Year-over-year growth 2025-2030 (%)

12.6.3 Chile - Market size and forecast 2025-2030

Chart on Chile - Market size and forecast 2025-2030 ($ million)
Data Table on Chile - Market size and forecast 2025-2030 ($ million)
Chart on Chile - Year-over-year growth 2025-2030 (%)
Data Table on Chile - Year-over-year growth 2025-2030 (%)

12.7 Middle East and Africa - Market size and forecast 2025-2030

Chart on Middle East and Africa - Market size and forecast 2025-2030 ($ million)
Data Table on Middle East and Africa - Market size and forecast 2025-2030 ($ million)
Chart on Middle East and Africa - Year-over-year growth 2025-2030 (%)
Data Table on Middle East and Africa - Year-over-year growth 2025-2030 (%)
Chart on Regional Comparison - Middle East and Africa
Data Table on Regional Comparison - Middle East and Africa

12.7.1 UAE - Market size and forecast 2025-2030

Chart on UAE - Market size and forecast 2025-2030 ($ million)
Data Table on UAE - Market size and forecast 2025-2030 ($ million)
Chart on UAE - Year-over-year growth 2025-2030 (%)
Data Table on UAE - Year-over-year growth 2025-2030 (%)

12.7.2 Saudi Arabia - Market size and forecast 2025-2030

Chart on Saudi Arabia - Market size and forecast 2025-2030 ($ million)
Data Table on Saudi Arabia - Market size and forecast 2025-2030 ($ million)
Chart on Saudi Arabia - Year-over-year growth 2025-2030 (%)
Data Table on Saudi Arabia - Year-over-year growth 2025-2030 (%)

12.7.3 South Africa - Market size and forecast 2025-2030

Chart on South Africa - Market size and forecast 2025-2030 ($ million)
Data Table on South Africa - Market size and forecast 2025-2030 ($ million)
Chart on South Africa - Year-over-year growth 2025-2030 (%)
Data Table on South Africa - Year-over-year growth 2025-2030 (%)

12.7.4 Egypt - Market size and forecast 2025-2030

Chart on Egypt - Market size and forecast 2025-2030 ($ million)
Data Table on Egypt - Market size and forecast 2025-2030 ($ million)
Chart on Egypt - Year-over-year growth 2025-2030 (%)
Data Table on Egypt - Year-over-year growth 2025-2030 (%)

12.7.5 Nigeria - Market size and forecast 2025-2030

Chart on Nigeria - Market size and forecast 2025-2030 ($ million)
Data Table on Nigeria - Market size and forecast 2025-2030 ($ million)
Chart on Nigeria - Year-over-year growth 2025-2030 (%)
Data Table on Nigeria - Year-over-year growth 2025-2030 (%)

12.8 Market opportunity by geography

Market opportunity by geography ($ million)
Data Tables on Market opportunity by geography ($ million)

13. Drivers, Challenges, and Opportunity

13.1 Market drivers

Proliferation of big data and imperative for advanced data processing
Increasing adoption of AI and ML technologies across vertical industries
Synergistic advances in semiconductor technology and algorithmic complexity

13.2 Market challenges

Prohibitive development costs and complex manufacturing economics
Extreme technical complexity and fragmented talent pool
Intensifying geopolitical tensions and supply chain vulnerabilities

13.3 Impact of drivers and challenges

Impact of drivers and challenges in 2025 and 2030

13.4 Market opportunities

Architectural diversification and proliferation of specialized processors
Transformative impact of generative AI and foundation models
Ascendancy of energy efficiency and sustainable computing

14. Competitive Landscape

14.1 Overview

14.2

Overview on criticality of inputs and factors of differentiation

14.3 Landscape disruption

Overview on factors of disruption

14.4 Industry risks

Impact of key risks on business

15. Competitive Analysis

15.1 Companies profiled

Companies covered

15.2 Company ranking index

15.3 Market positioning of companies

Matrix on companies position and classification

15.4 Advanced Micro Devices Inc.

Advanced Micro Devices Inc. - Overview
Advanced Micro Devices Inc. - Business segments
Advanced Micro Devices Inc. - Key news
Advanced Micro Devices Inc. - Key offerings
Advanced Micro Devices Inc. - Segment focus
SWOT

15.5 Amazon.com Inc.

Amazon.com Inc. - Overview
Amazon.com Inc. - Business segments
Amazon.com Inc. - Key news
Amazon.com Inc. - Key offerings
Amazon.com Inc. - Segment focus
SWOT

15.6 Apple Inc.

Apple Inc. - Overview
Apple Inc. - Business segments
Apple Inc. - Key news
Apple Inc. - Key offerings
Apple Inc. - Segment focus
SWOT

15.7 Baidu Inc.

Baidu Inc. - Overview
Baidu Inc. - Business segments
Baidu Inc. - Key offerings
Baidu Inc. - Segment focus
SWOT

15.8 Fujitsu Ltd.

Fujitsu Ltd. - Overview
Fujitsu Ltd. - Business segments
Fujitsu Ltd. - Key news
Fujitsu Ltd. - Key offerings
Fujitsu Ltd. - Segment focus
SWOT

15.9 Huawei Technologies Co. Ltd.

Huawei Technologies Co. Ltd. - Overview
Huawei Technologies Co. Ltd. - Business segments
Huawei Technologies Co. Ltd. - Key news
Huawei Technologies Co. Ltd. - Key offerings
Huawei Technologies Co. Ltd. - Segment focus
SWOT

15.10 IBM Corp.

IBM Corp. - Overview
IBM Corp. - Business segments
IBM Corp. - Key news
IBM Corp. - Key offerings
IBM Corp. - Segment focus
SWOT

15.11 Intel Corp.

Intel Corp. - Overview
Intel Corp. - Business segments
Intel Corp. - Key news
Intel Corp. - Key offerings
Intel Corp. - Segment focus
SWOT

15.12 MediaTek Inc.

MediaTek Inc. - Overview
MediaTek Inc. - Product / Service
MediaTek Inc. - Key news
MediaTek Inc. - Key offerings
SWOT

15.13 Microsoft Corp.

Microsoft Corp. - Overview
Microsoft Corp. - Business segments
Microsoft Corp. - Key news
Microsoft Corp. - Key offerings
Microsoft Corp. - Segment focus
SWOT

15.14 NVIDIA Corp.

NVIDIA Corp. - Overview
NVIDIA Corp. - Business segments
NVIDIA Corp. - Key news
NVIDIA Corp. - Key offerings
NVIDIA Corp. - Segment focus
SWOT

15.15 NXP Semiconductors NV

NXP Semiconductors NV - Overview
NXP Semiconductors NV - Business segments
NXP Semiconductors NV - Key offerings
NXP Semiconductors NV - Segment focus
SWOT

15.16 Qualcomm Inc.

Qualcomm Inc. - Overview
Qualcomm Inc. - Business segments
Qualcomm Inc. - Key news
Qualcomm Inc. - Key offerings
Qualcomm Inc. - Segment focus
SWOT

15.17 Rebellions Inc.

Rebellions Inc. - Overview
Rebellions Inc. - Product / Service
Rebellions Inc. - Key offerings
SWOT

15.18 Samsung Electronics Co. Ltd.

Samsung Electronics Co. Ltd. - Overview
Samsung Electronics Co. Ltd. - Business segments
Samsung Electronics Co. Ltd. - Key news
Samsung Electronics Co. Ltd. - Key offerings
Samsung Electronics Co. Ltd. - Segment focus
SWOT

16. Appendix

16.1 Scope of the report

Market definition
Objectives
Notes and caveats

16.2 Inclusions and exclusions checklist

Inclusions checklist
Exclusions checklist

16.3 Currency conversion rates for US$

16.4 Research methodology

16.5 Data procurement

Information sources

16.6 Data validation

16.7 Validation techniques employed for market sizing

16.8 Data synthesis

16.9 360 degree market analysis

16.10 List of abbreviations

Research Methodology

Technavio presents a detailed picture of the market by way of study, synthesis, and summation of data from multiple sources. The analysts have presented the various facets of the market with a particular focus on identifying the key industry influencers. The data thus presented is comprehensive, reliable, and the result of extensive research, both primary and secondary.

INFORMATION SOURCES

Primary sources

  • Manufacturers and suppliers
  • Channel partners
  • Industry experts
  • Strategic decision makers

Secondary sources

  • Industry journals and periodicals
  • Government data
  • Financial reports of key industry players
  • Historical data
  • Press releases

DATA ANALYSIS

Data Synthesis

  • Collation of data
  • Estimation of key figures
  • Analysis of derived insights

Data Validation

  • Triangulation with data models
  • Reference against proprietary databases
  • Corroboration with industry experts

REPORT WRITING

Qualitative

  • Market drivers
  • Market challenges
  • Market trends
  • Five forces analysis

Quantitative

  • Market size and forecast
  • Market segmentation
  • Geographical insights
  • Competitive landscape

Interested in this report?

Get your sample now to see our research methodology and insights!

Download Now

Frequently Asked Questions

Artificial Intelligence (AI) Chips market growth will increase by USD 154928.4 million during 2026-2030.

The Artificial Intelligence (AI) Chips market is expected to grow at a CAGR of 24.3% during 2026-2030.

Artificial Intelligence (AI) Chips market is segmented by Product (ASICs, GPUs, CPUs, FPGAs) End-user (Media and advertising, BFSI, IT and telecommunication, Others) Type (Cloud, Edge)

Advanced Micro Devices Inc., Amazon.com Inc., Apple Inc., Arm Ltd., Baidu Inc., Cerebras Systems Inc., Fujitsu Ltd., Graphcore Ltd., Hailo Technologies Ltd., Huawei Technologies Co. Ltd., IBM Corp., Intel Corp., MediaTek Inc., Microsoft Corp., NVIDIA Corp., NXP Semiconductors NV, Qualcomm Inc., Rebellions Inc., SambaNova Systems Inc., Samsung Electronics Co. Ltd. are a few of the key vendors in the Artificial Intelligence (AI) Chips market.

North America will register the highest growth rate of 41.7% among the other regions. Therefore, the Artificial Intelligence (AI) Chips market in North America is expected to garner significant business opportunities for the vendors during the forecast period.

US, Canada, Mexico, Germany, France, UK, Italy, Spain, The Netherlands, China, Japan, South Korea, India, Australia, Indonesia, Brazil, Argentina, Chile, UAE, Saudi Arabia, South Africa, Egypt, Nigeria

  • Proliferation of big data and imperative for advanced data processing is the driving factor this market.

The Artificial Intelligence (AI) Chips market vendors should focus on grabbing business opportunities from the Product segment as it accounted for the largest market share in the base year.