
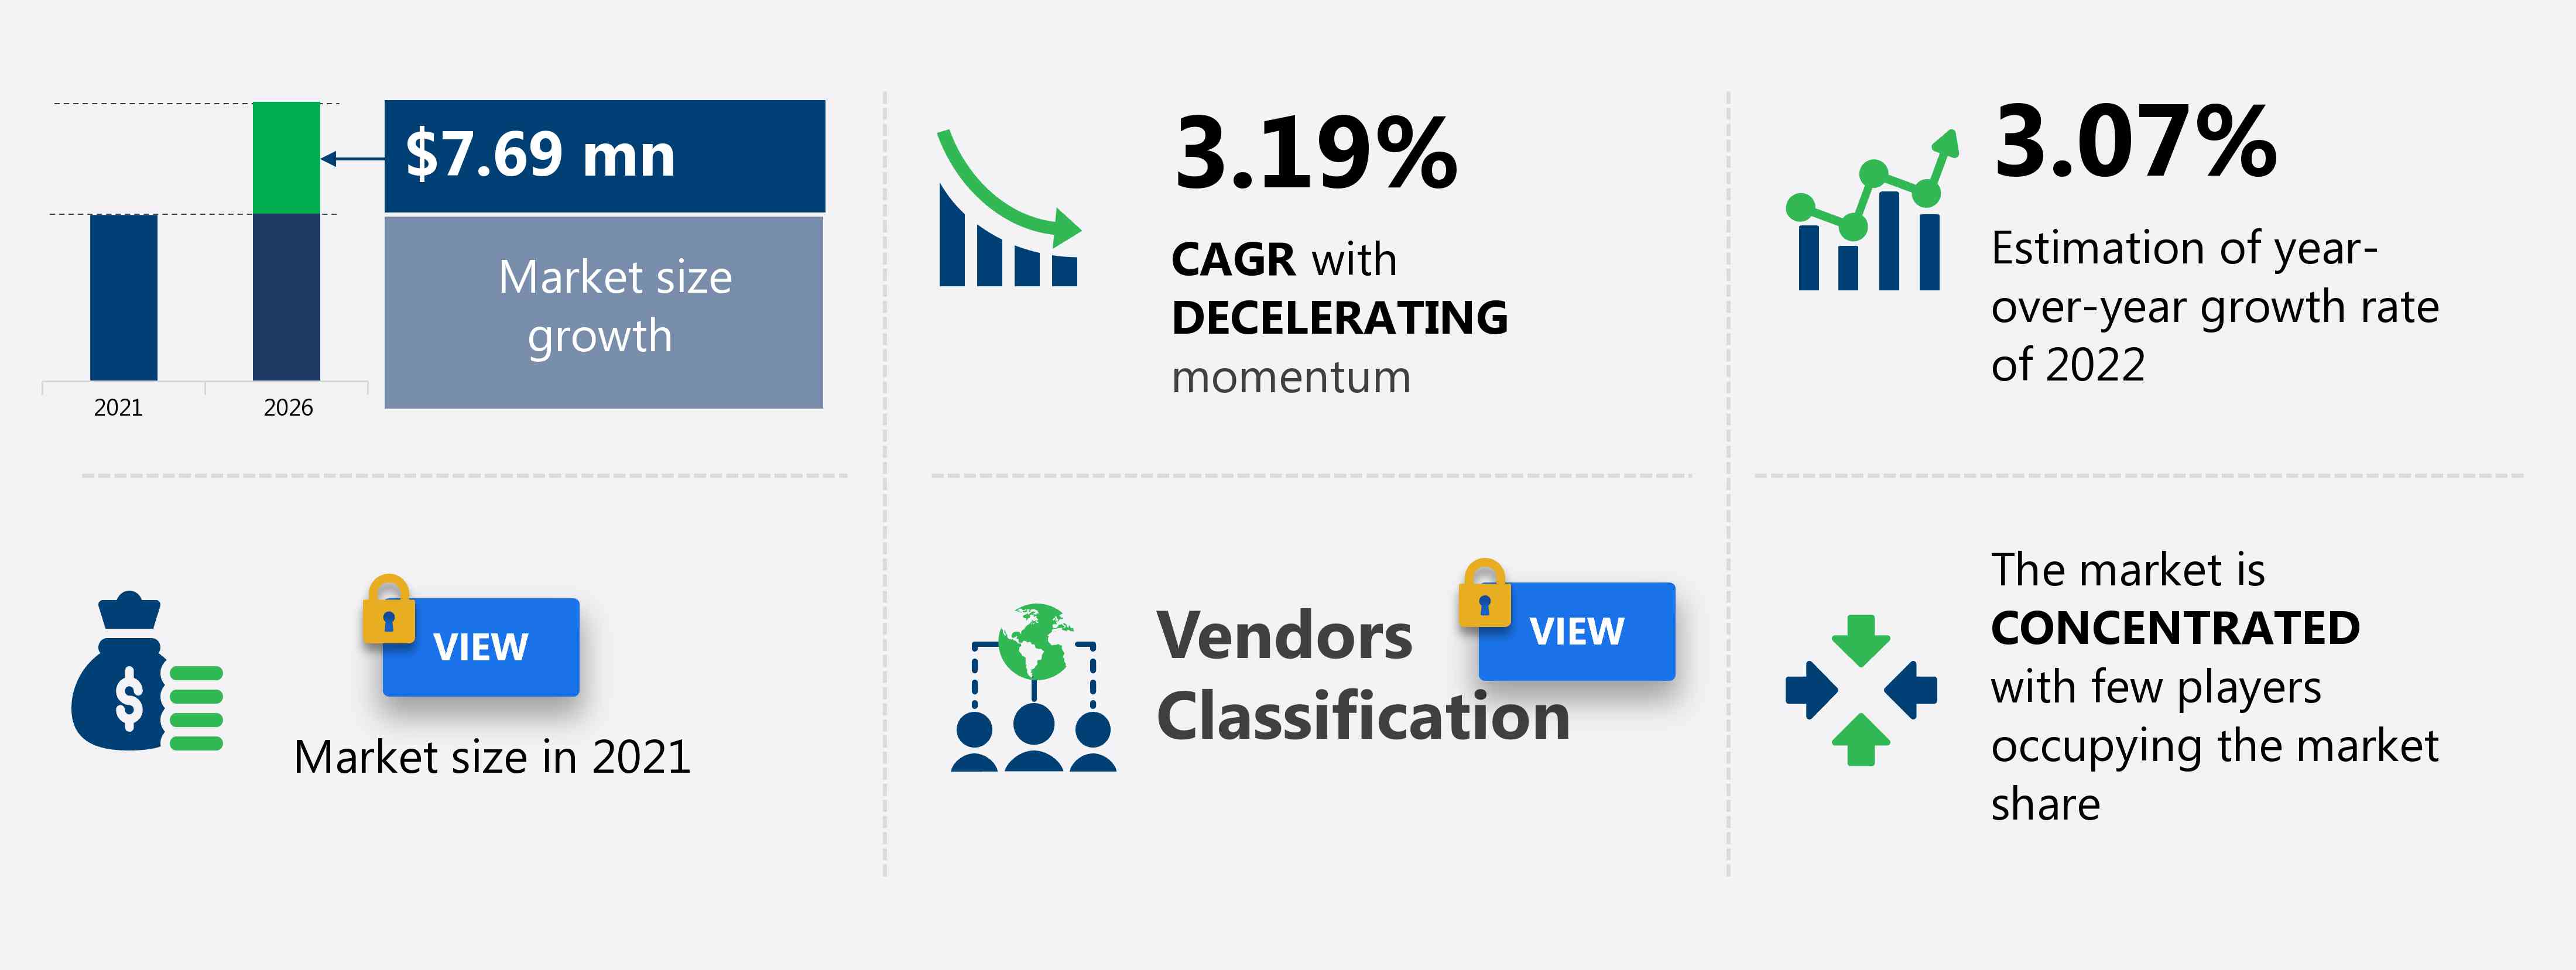
The atole market share in North America is expected to increase by USD 7.69 million from 2021 to 2026, at a CAGR of 3.19%.
This atole market in North America research report provides valuable insights on the post-COVID-19 impact on the market, which will help companies evaluate their business approaches. Furthermore, this report extensively covers the atole market in North America segmentation by product (nut atole, fruit atole, and others) and distribution channel (offline and online). The atole market in North America report also offers information on several market vendors, including Grupo La Moderna SA de CV, HERMEL S.A. de C.V., Los Chileros de Nuevo Mexico, Nestle SA, PepsiCo Inc., The Klass Company SA de CV, and Unilever PLC among others.
What will the Atole Market Size in North America be During the Forecast Period?
Download Report Sample to Unlock the Atole Market Size in North America for the Forecast Period and Other Important Statistics
Atole Market in North America: Key Drivers, Trends, and Challenges
Our researcher studied the historical data for years, with 2021 as the base year and 2022 as the estimated year, and produced drivers, trends, and challenges for the atole market in North America. Our research analysts have studied the historical data and deduced the key market drivers and the COVID-19 pandemic's impact on the atole market in North America. The holistic analysis of the drivers will help deduce end goals and refine marketing strategies to gain a competitive edge.
Key Atole Market Driver in North America
Increased consumption of atole in Mexico is one of the key factors driving the North American atole market growth. In Mexico, atole is considered a sought-after breakfast and dinner beverage, especially during winters. A number of street vendors in Mexico purchase atole mix from retailers and offer multiple flavors of the beverage. Moreover, the Mexican atole market is characterized by the increased availability of atole in ready-to-consume forms. This, coupled with the availability of atole mixes, adds to the growth of the market in focus. Thus, the increasing consumption of atole in Mexico will boost the growth of the market during the forecast period.
Key Atole Market Trend in North America
Availability of multiple flavors is one of the key North America atole market trends fueling the market growth. The consumers of atole are exposed to sugar-and honey-flavored atole mixes and atole. The other flavors that are available in the atole market in North America include fruit, chocolate, nuts, vanilla, and cinnamon. Moreover, chocolate-flavored atole mixes are in high demand in the market. Flavors that mimic chili peppers, beans, or corn kernels are the latest additions in the atole market in North America. Thus, the availability of multiple flavors aids in satiating the taste preferences of multiple categories of customers. This will boost the growth of the market during the forecast period.
Key Atole Market Challenge in North America
Home preparation of atole is one of the key factors challenging the North American atole market growth. Of late, a large percentage of the North American population prefers preparing atole and atole mixes at home. This limits the consumption of atole mixes and ready-to-consume atole. The availability of multiple recipes that can easily be prepared at home adds to the high demand for such homemade atole. This negatively impacts the commercial sales of atole and atole mixes in North America.
This atole market in North America analysis report also provides detailed information on other upcoming trends and challenges that will have a far-reaching effect on the market growth. The actionable insights on the trends and challenges will help companies evaluate and develop growth strategies for 2022-2026.
Parent Market Analysis
Technavio categorizes the atole market in North America as a part of the global packaged foods and meats market. Our research report has extensively covered external factors influencing the parent market growth potential in the coming years, which will determine the levels of growth of the atole market in North America during the forecast period.^^^
Who are the Major Atole Market Vendors in North America?
The report analyzes the market’s competitive landscape and offers information on several market vendors, including:
- Grupo La Moderna SA de CV
- HERMEL S.A. de C.V.
- Los Chileros de Nuevo Mexico
- Nestle SA
- PepsiCo Inc.
- The Klass Company SA de CV
- Unilever PLC
This statistical study of the North American atole market encompasses successful business strategies deployed by the key vendors. The atole market in North America is concentrated and the vendors are deploying growth strategies such as quality, price, service, brand image, distribution, and marketing to compete in the market.
Product Insights and News
- unilever.com - The company offers atole such as Knorr Maizena Atole, which contains vitamin A, vitamin C, thiamin, niacin, vitamin B6, and zinc.
To make the most of the opportunities and recover from the post-COVID-19 impact, market vendors should focus more on the growth prospects in the fast-growing segments while maintaining their positions in the slow-growing segments.
The atole market in North America report contains comprehensive market knowledge and an in-depth vendor landscape added to an analysis of the key vendors.
Atole Market in North America Value Chain Analysis
Our In-house experts produce extensive information on the value chain and parent market of the North American atole market, which vendors can leverage to gain a competitive advantage during the forecast period. The Value Chain information provides an end-to-end understanding of product insight and profit and also optimization and evaluation of business strategies The players across the value chain includes selective data and analysis from entire research findings as per the scope of the report.
What are the Revenue-generating Product Segments in the Atole Market in North America?

To gain further insights on the market contribution of various segments Request PDF Sample
The atole market share growth in North America by the nut atole segment will be significant during the forecast period. The increased preference for nut-flavored beverages in North America is a key driver that facilitates the growth of the market. Among the multiple nut-flavored atole mixes available in the market, peanut-flavored mixes are in high demand. Thus, the availability of multiple nut-flavored atole mixes in the market contributes to increased customer propensity toward such products. This, in turn, will drive the growth of the segment during the forecast period.
This report provides an accurate prediction of the contribution of all the segments to the growth of the atole market size in North America and actionable market insights on the post-COVID-19 impact on each segment.
|
Atole Market Scope in North America |
|
|
Report Coverage |
Details |
|
Page number |
120 |
|
Base year |
2021 |
|
Forecast period |
2022-2026 |
|
Growth momentum & CAGR |
Decelerate at a CAGR of 3.19% |
|
Market growth 2022-2026 |
$7.69 million |
|
Market structure |
Concentrated |
|
YoY growth (%) |
3.07 |
|
Competitive landscape |
Leading companies, Competitive Strategies, Consumer engagement scope |
|
Key companies profiled |
Grupo La Moderna SA de CV, HERMEL S.A. de C.V., Los Chileros de Nuevo Mexico, Nestle SA, PepsiCo Inc., The Klass Company SA de CV, and Unilever PLC |
|
Market dynamics |
Parent market analysis, Market growth inducers and obstacles, Fast-growing and slow-growing segment analysis, COVID-19 impact and recovery analysis and future consumer dynamics, and Market condition analysis for the forecast period. |
|
Customization purview |
If our report has not included the data that you are looking for, you can reach out to our analysts and get segments customized. |
What are the Key Data Covered in this Atole Market in North America Report?
- CAGR of the market during the forecast period 2022-2026
- Detailed information on factors that will drive atole market growth in North America during the next five years
- Precise estimation of the atole market size in North America and its contribution to the parent market
- Accurate predictions on upcoming trends and changes in consumer behavior
- The growth of the atole industry in North America
- A thorough analysis of the market’s competitive landscape and detailed information on vendors
- Comprehensive details of factors that will challenge the growth of atole market vendors in North America
We can help! Our analysts can customize this report to meet your requirements. Get in touch
 RIA -
RIA - 
