
Automotive Communication Protocols Market Size 2026-2030
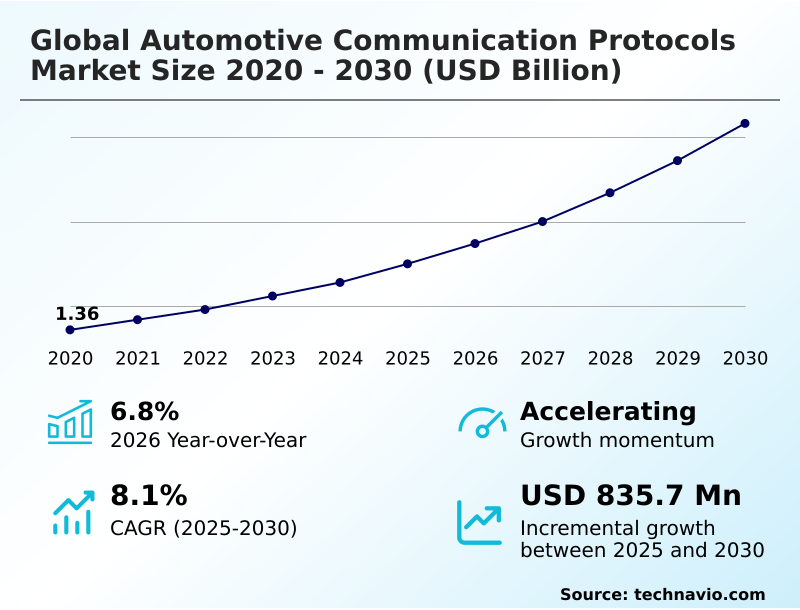
The automotive communication protocols market size is valued to increase by USD 835.7 million, at a CAGR of 8.1% from 2025 to 2030. Escalating integration of advanced driver assistance systems and autonomous vehicle technologies will drive the automotive communication protocols market.
Major Market Trends & Insights
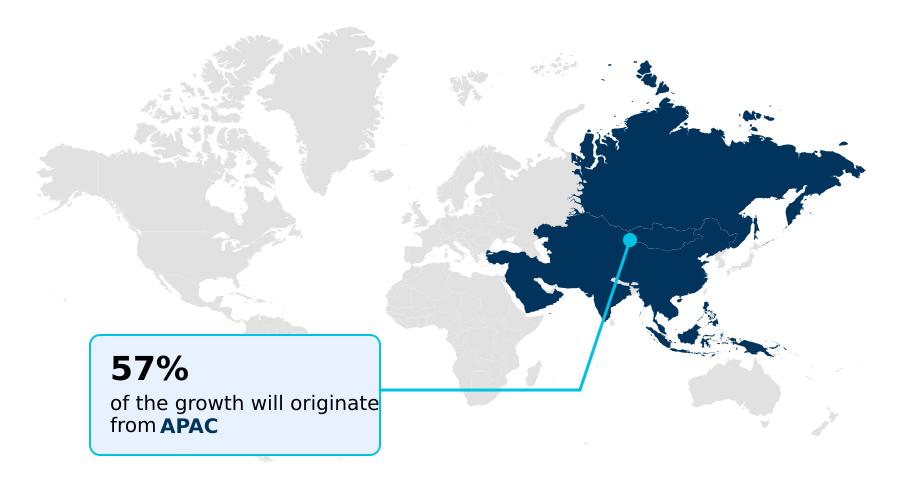
- APAC dominated the market and accounted for a 57.4% growth during the forecast period.
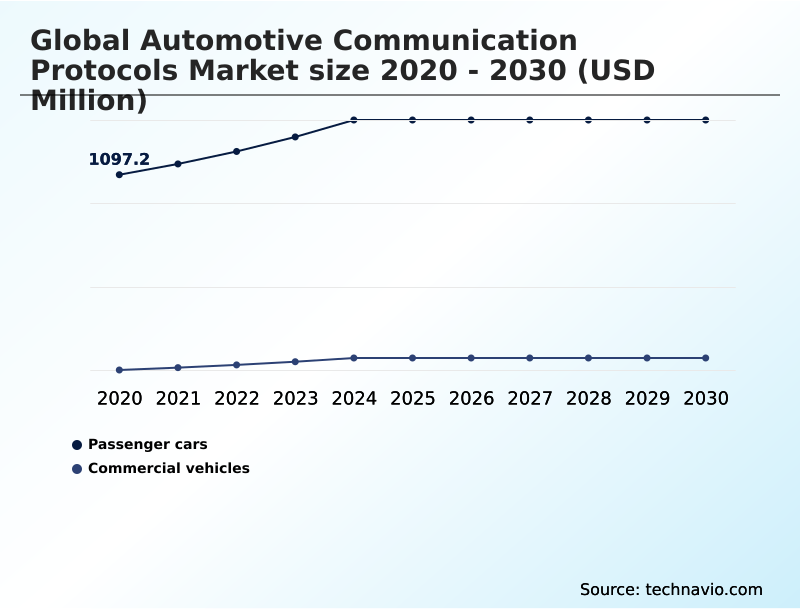
- By Application - Passenger cars segment was valued at USD 1.33 billion in 2024
- By Type - LIN segment accounted for the largest market revenue share in 2024
Market Size & Forecast
- Market Opportunities: USD 1.23 billion
- Market Future Opportunities: USD 835.7 million
- CAGR from 2025 to 2030 : 8.1%
Market Summary
- The automotive communication protocols market is undergoing a foundational transformation as vehicle architecture evolves to support unprecedented levels of connectivity and automation. This shift is driven by the demand for sophisticated features, from advanced driver-assistance systems (ADAS) to immersive infotainment experiences, which all depend on seamless, high-speed data exchange.
- Legacy networks are giving way to advanced E/E architectures that use a mix of protocols to balance performance, cost, and reliability. For instance, a fleet management operator relies on robust internal vehicle networking to collect real-time diagnostic and telematics data, which is then transmitted externally for analysis.
- This process, essential for optimizing logistics and predictive maintenance schedules, would be impossible without a secure and efficient communication backbone. The industry is moving toward high-bandwidth solutions and service-oriented frameworks to create flexible, software-defined vehicles (SDVs), fundamentally altering the design, development, and lifecycle management of modern automobiles.
- The increasing complexity of these interconnected systems also introduces significant challenges related to cybersecurity and interoperability, which are critical considerations for all stakeholders.
What will be the Size of the Automotive Communication Protocols Market during the forecast period?
Get Key Insights on Market Forecast (PDF) Get Free Sample
How is the Automotive Communication Protocols Market Segmented?
The automotive communication protocols industry research report provides comprehensive data (region-wise segment analysis), with forecasts and estimates in "USD million" for the period 2026-2030, as well as historical data from 2020-2024 for the following segments.
- Application
- Passenger cars
- Commercial vehicles
- Type
- LIN
- CAN
- Flexray
- MOST
- Ethernet
- Component
- Hardware
- Software
- Services
- End-user
- Powertrain
- Infotainment and communication
- Safety and ADAS
- Body control and comfort
- Others
- Geography
- APAC
- China
- India
- South Korea
- Europe
- Germany
- UK
- France
- North America
- US
- Canada
- Mexico
- South America
- Brazil
- Argentina
- Middle East and Africa
- Saudi Arabia
- UAE
- South Africa
- Rest of World (ROW)
- APAC
By Application Insights
The passenger cars segment is estimated to witness significant growth during the forecast period.
The passenger cars segment is at the forefront of network evolution, driven by the integration of advanced electronics. In-vehicle networking must balance performance and cost, using deterministic protocols for mission-critical functions like powertrain and chassis control.
The shift toward ADAS and autonomous capabilities escalates the need for high-bandwidth automotive ethernet and a robust physical layer transceiver to handle immense data from sensors like cameras and lidar.
This architectural transition from traditional networks to a zonal architecture relies on a high-speed data bus to connect powerful domain controllers, a shift that has shown a potential 15% reduction in message latency for critical systems.
This consolidation, enabled by a capable gateway module, optimizes data flow for everything from advanced safety to in-vehicle infotainment (IVI) and secure over-the-air (OTA) updates.
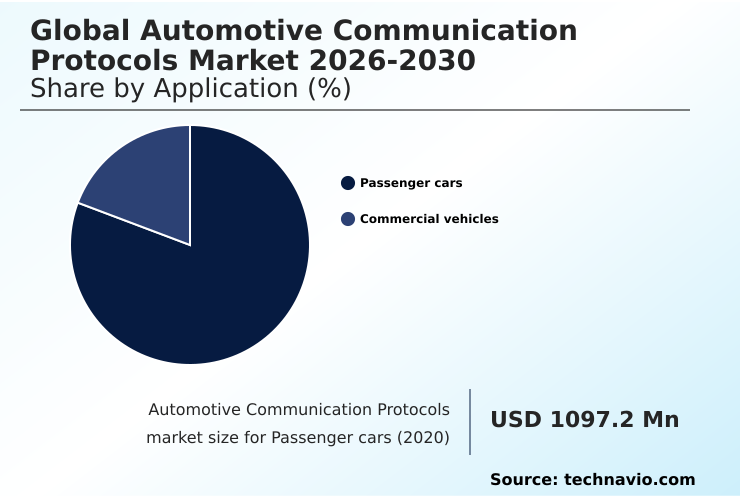
The Passenger cars segment was valued at USD 1.33 billion in 2024 and showed a gradual increase during the forecast period.
Regional Analysis
APAC is estimated to contribute 57.4% to the growth of the global market during the forecast period.Technavio’s analysts have elaborately explained the regional trends and drivers that shape the market during the forecast period.
See How Automotive Communication Protocols Market Demand is Rising in APAC Get Free Sample
The geographic landscape of the market is diverse, reflecting varied rates of technological adoption and regulatory priorities. North America and Europe lead in deploying advanced solutions, driven by strong consumer demand for high-end features and stringent safety mandates.
These regions are rapidly adopting automotive ethernet and time-sensitive networking (TSN) for complex ADAS functions. In contrast, APAC, which is projected to account for over 57% of incremental growth, presents a more varied picture.
While mature markets like Japan and South Korea are innovation hubs for ECU communication and in-vehicle networking, emerging economies focus on cost-effective protocols like the LIN bus.
South America and Africa primarily utilize proven, low-cost networks, though gradual upgrades are occurring. The global disparity is clear: premium markets prioritize high-speed data exchange for autonomous features, while volume-driven markets focus on fault-tolerant communication for essential safety systems.
Market Dynamics
Our researchers analyzed the data with 2025 as the base year, along with the key drivers, trends, and challenges. A holistic analysis of drivers will help companies refine their marketing strategies to gain a competitive advantage.
- The strategic direction of the global automotive communication protocols market 2026-2030 is increasingly shaped by nuanced technical decisions that balance performance, cost, and future scalability. The debate over automotive ethernet vs can fd highlights a core industry challenge: selecting the right backbone for mixed-criticality systems.
- While CAN FD extends the life of a trusted standard for real-time control, multi-gigabit ethernet is becoming essential for sensor fusion in autonomous driving. The role of the LIN bus for body electronics remains undisputed for its cost-effectiveness in managing non-critical comfort features.
- Similarly, understanding how time-sensitive networking for autonomous driving data ensures determinism is crucial for developing safe L4 and L5 systems. This requires a deep dive into the service-oriented architecture in software-defined vehicles, which decouples hardware from software to allow for seamless over-the-air updates. Such updates are managed through sophisticated gateway modules that must ensure secure communication.
- For engineers, the choice between different physical layer transceivers can impact network robustness and EMC performance. Implementing functional safety iso 26262 communication standards is non-negotiable, influencing the entire design of the in-vehicle network.
- This focus on safety and performance has led to a nearly 30% increase in validation and testing efforts compared to previous vehicle generations, a critical factor in OEM budgeting and supply chain planning. The evolution of ECU communication relies on these protocols to build the zonal architectures of tomorrow.
What are the key market drivers leading to the rise in the adoption of Automotive Communication Protocols Industry?
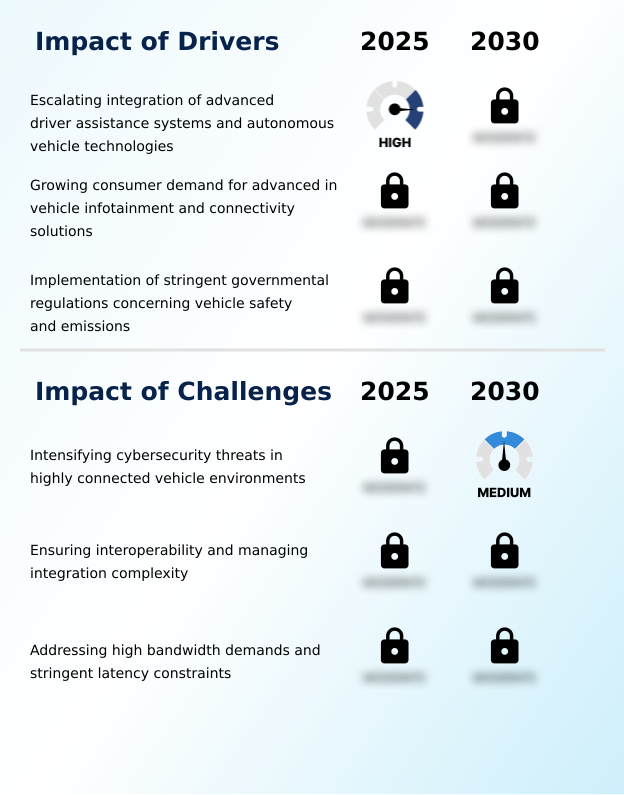
- The escalating integration of advanced driver assistance systems and autonomous vehicle technologies is a key driver for the automotive communication protocols market.
- The primary catalyst for market expansion is the rapid and widespread integration of advanced driver assistance systems (ADAS) and the progression toward fully autonomous vehicles.
- The functionality of these systems is fundamentally dependent on the seamless, real-time exchange of vast quantities of data from sensors like cameras and lidar, which can generate data streams exceeding 1 Gbit/s.
- This necessitates the adoption of advanced protocols capable of handling immense data loads with minimal latency.
- Regulatory mandates for safety features such as electronic stability control, now with a 100% inclusion rate in new vehicles in major markets, further drive demand for deterministic and fault-tolerant communication.
- This convergence of consumer demand for a rich in-vehicle infotainment (IVI) experience and stringent safety requirements compels manufacturers to invest in next-generation in-vehicle networking solutions.
What are the market trends shaping the Automotive Communication Protocols Industry?
- The proliferation of zonal and centralized vehicle electrical and electronic architectures represents a key upcoming trend. This shift is fundamentally reshaping in-vehicle networking requirements and protocol selection.
- A transformative trend is the definitive industry shift toward consolidated zonal and centralized computing models, which fundamentally redesigns the vehicle's nervous system. This emerging E/E architecture is creating significant demand for high-bandwidth, low-latency protocols like automotive ethernet to serve as the vehicle backbone, connecting powerful zonal controllers to a central compute platform.
- The adoption of this model has demonstrated the potential to reduce the total number of ECUs by approximately 30%, simplifying the wiring harness and lowering vehicle weight. This evolution is compelling developers to focus on technologies like time-sensitive networking (TSN) and service-oriented architecture (SOA) to manage mixed-criticality systems on a unified network.
- This trend directly influences the selection of communication technologies, fostering a dynamic environment focused on scalability and efficiency for the software-defined vehicle (SDV).
What challenges does the Automotive Communication Protocols Industry face during its growth?
- Intensifying cybersecurity threats within highly connected vehicle environments pose a key challenge to the growth of the automotive communication protocols market.
- A formidable challenge is the escalating complexity of cybersecurity threats in highly connected vehicle environments. The proliferation of external interfaces for over-the-air (OTA) updates and V2X communication exponentially expands the potential attack surface, making in-vehicle networks a prime target.
- Embedding robust security measures like encryption and intrusion detection directly into the communication fabric can introduce up to 10% in processing overhead, impacting the latency of real-time data exchange. Furthermore, ensuring interoperability within a heterogeneous network of legacy and modern protocols presents a significant integration burden.
- The validation effort to guarantee seamless communication across multiple protocol domains can account for over 40% of the total network testing time, increasing development costs and time-to-market for new vehicle platforms.
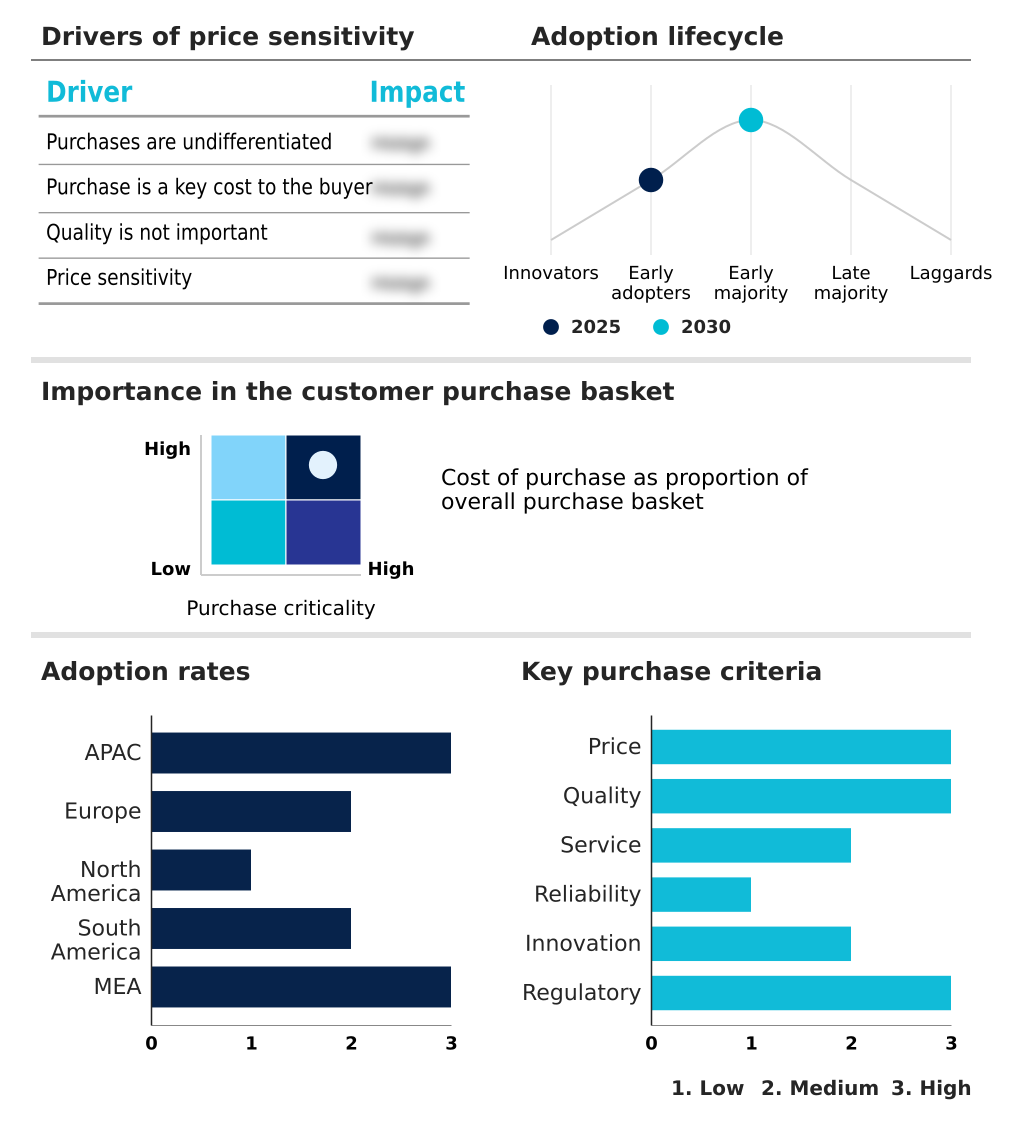
Exclusive Technavio Analysis on Customer Landscape
The automotive communication protocols market forecasting report includes the adoption lifecycle of the market, covering from the innovator’s stage to the laggard’s stage. It focuses on adoption rates in different regions based on penetration. Furthermore, the automotive communication protocols market report also includes key purchase criteria and drivers of price sensitivity to help companies evaluate and develop their market growth analysis strategies.
Customer Landscape of Automotive Communication Protocols Industry
Competitive Landscape
Companies are implementing various strategies, such as strategic alliances, automotive communication protocols market forecast, partnerships, mergers and acquisitions, geographical expansion, and product/service launches, to enhance their presence in the industry.
Advanced Micro Devices Inc. - Key offerings include integrated silicon solutions, from microcontrollers to transceivers, enabling high-bandwidth, secure communication for next-generation E/E architectures and software-defined vehicles.
The industry research and growth report includes detailed analyses of the competitive landscape of the market and information about key companies, including:
- Advanced Micro Devices Inc.
- Amphenol Corp.
- Broadcom Inc.
- Continental AG
- Elmos Semiconductor AG
- Infineon Technologies AG
- Maxim Integrated Products Inc.
- Melexis NV
- Microchip Technology Inc.
- NXP Semiconductors NV
- ON Semiconductor Corp.
- Renesas Electronics Corp.
- Robert Bosch GmbH
- ROHM Co. Ltd.
- Softing AG
- Speedgoat GmbH
- STMicroelectronics NV
- Texas Instruments Inc.
- Toshiba Corp.
- Vector Informatik GmbH
Qualitative and quantitative analysis of companies has been conducted to help clients understand the wider business environment as well as the strengths and weaknesses of key industry players. Data is qualitatively analyzed to categorize companies as pure play, category-focused, industry-focused, and diversified; it is quantitatively analyzed to categorize companies as dominant, leading, strong, tentative, and weak.
Recent Development and News in Automotive communication protocols market
- In September, 2024, BYD Company announced a strategic partnership to co-develop a proprietary, highly integrated zonal architecture for its next-generation electric vehicles, aiming to reduce complexity and manufacturing costs.
- In March, 2025, General Motors, Ford, and NVIDIA jointly announced a strategic alliance to standardize 10-Gigabit Automotive Ethernet for all new vehicle platforms beginning with the 2028 model year, creating a unified ecosystem for next-generation features.
- In April, 2025, The National Association of Automotive Vehicle Manufacturers (ANFAVEA) in Brazil announced a new voluntary safety roadmap, setting a target for the widespread implementation of Electronic Stability Control (ESC) and Autonomous Emergency Braking (AEB) systems.
- In May, 2025, The European Automobile Manufacturers Association (ACEA), in collaboration with major telecom providers, launched a large-scale pilot program for a standardized Cellular-V2X (C-V2X) communication framework across several member states.
Dive into Technavio’s robust research methodology, blending expert interviews, extensive data synthesis, and validated models for unparalleled Automotive Communication Protocols Market insights. See full methodology.
| Market Scope | |
|---|---|
| Page number | 331 |
| Base year | 2025 |
| Historic period | 2020-2024 |
| Forecast period | 2026-2030 |
| Growth momentum & CAGR | Accelerate at a CAGR of 8.1% |
| Market growth 2026-2030 | USD 835.7 million |
| Market structure | Fragmented |
| YoY growth 2025-2026(%) | 6.8% |
| Key countries | China, India, South Korea, Japan, Australia, Indonesia, Germany, UK, France, Italy, Spain, The Netherlands, US, Canada, Mexico, Brazil, Argentina, Chile, Saudi Arabia, UAE, South Africa, Israel and Turkey |
| Competitive landscape | Leading Companies, Market Positioning of Companies, Competitive Strategies, and Industry Risks |
Research Analyst Overview
- The market is undergoing a fundamental architectural restructuring, moving away from legacy domain-based networks toward a consolidated zonal architecture. This transition is predicated on the adoption of high-performance protocols like automotive ethernet, which serves as the central nervous system for the modern software-defined vehicle (SDV).
- The shift is not merely about increasing bandwidth; it is about enabling a service-oriented architecture (SOA) that allows for flexible software deployment and over-the-air updates. This evolution directly impacts boardroom strategy, as the long-term R&D budget must now account for complex software stacks and cybersecurity for automotive networks.
- Protocols such as the flexray protocol and LIN bus continue to serve specific domains, but the core innovation lies in creating a unified in-vehicle network (IVN) capable of managing mixed-criticality systems.
- Achieving this requires advanced gateway modules, robust physical layer transceivers, and adherence to time-sensitive networking (TSN) standards, which have demonstrated a 30% improvement in data processing efficiency for ADAS functions. This focus on deterministic, fault-tolerant communication is essential for the future of ECU communication and autonomous mobility.
What are the Key Data Covered in this Automotive Communication Protocols Market Research and Growth Report?
-
What is the expected growth of the Automotive Communication Protocols Market between 2026 and 2030?
-
USD 835.7 million, at a CAGR of 8.1%
-
-
What segmentation does the market report cover?
-
The report is segmented by Application (Passenger cars, and Commercial vehicles), Type (LIN, CAN, Flexray, MOST, and Ethernet), Component (Hardware, Software, and Services), End-user (Powertrain, Infotainment and communication, Safety and ADAS, Body control and comfort, and Others) and Geography (APAC, Europe, North America, South America, Middle East and Africa)
-
-
Which regions are analyzed in the report?
-
APAC, Europe, North America, South America and Middle East and Africa
-
-
What are the key growth drivers and market challenges?
-
Escalating integration of advanced driver assistance systems and autonomous vehicle technologies, Intensifying cybersecurity threats in highly connected vehicle environments
-
-
Who are the major players in the Automotive Communication Protocols Market?
-
Advanced Micro Devices Inc., Amphenol Corp., Broadcom Inc., Continental AG, Elmos Semiconductor AG, Infineon Technologies AG, Maxim Integrated Products Inc., Melexis NV, Microchip Technology Inc., NXP Semiconductors NV, ON Semiconductor Corp., Renesas Electronics Corp., Robert Bosch GmbH, ROHM Co. Ltd., Softing AG, Speedgoat GmbH, STMicroelectronics NV, Texas Instruments Inc., Toshiba Corp. and Vector Informatik GmbH
-
Market Research Insights
- The market is shaped by a dynamic interplay of technological advancement and evolving consumer demands. The transition toward high-speed, IP-based networks is enabling performance gains, with some implementations showing a 40% improvement in over-the-air (OTA) update success rates. This shift supports the complex data requirements of advanced driver-assistance systems (ADAS) and sophisticated in-vehicle infotainment (IVI).
- Concurrently, the adoption of standardized software architectures facilitates greater interoperability between components from different suppliers, reducing integration costs by up to 20%. As vehicles become more connected, cybersecurity for automotive networks has become a primary focus, necessitating robust protocols to protect against external threats.
- This evolving landscape requires a strategic balance between high-performance data exchange and cost-effective, reliable communication for all vehicle domains.
We can help! Our analysts can customize this automotive communication protocols market research report to meet your requirements.
 RIA -
RIA - 
