Automotive Sun Visor Market Size 2025-2029
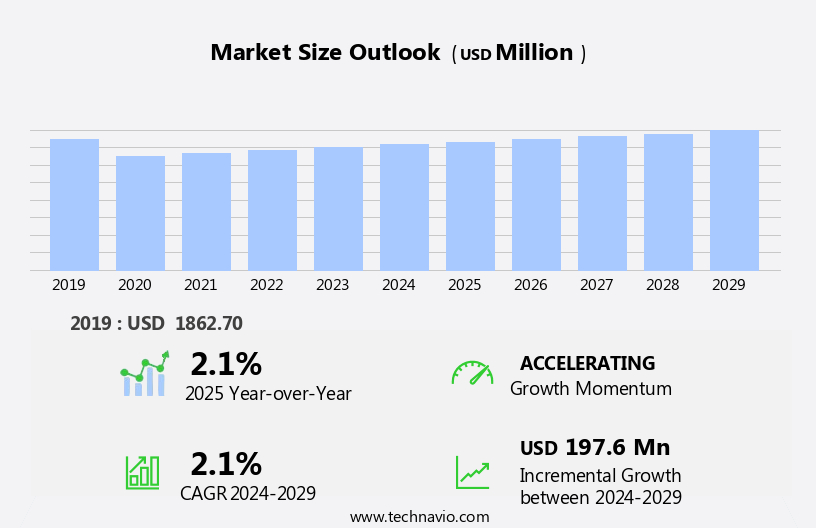
The automotive sun visor market size is forecast to increase by USD 197.6 million at a CAGR of 2.1% between 2024 and 2029.
- The market is witnessing significant growth due to the increasing demand for premium vehicles. Consumers are increasingly opting for advanced features and amenities in their vehicles, including sun visors that offer superior functionality and design. Another trend in the market is the use of eco-friendly materials for manufacturing sun visors. The increasing electrification of vehicles, including electric vehicles (EVs) and hybrid vehicles, is also impacting the market. While this incurs an extra cost, it aligns with consumer preferences for sustainable products. Additionally, automakers are investing in designing visors that cater to specific vehicle models and customer needs, further driving market growth. Overall, the market is expected to experience steady expansion in the coming years.
What will be the Size of the Automotive Sun Visor Market During the Forecast Period?
- The market encompasses a range of products designed to mitigate the heat absorption and glare of sunlight in the vehicle cabin. These visors play a crucial role in enhancing driver and co-driver comfort, particularly during prolonged periods of sun exposure. The market caters to both fixed and expandable configurations, with various materials and designs available to suit diverse passenger car needs. Heat absorption is a significant concern, as the sun's rays can increase interior temperatures, leading to discomfort and potential damage to electronic equipment. Sun visors help mitigate this issue by shielding the vehicle's interior from direct sunlight. Additionally, they serve to reduce glare on the windshield, improving traffic flow and driver safety.
- Modern sun visors incorporate ergonomic designs, integrating multifunctional components such as mirrors, electric cables, and padding. The integration of Augmented Reality and Virtual Reality is transforming the market by enhancing customer experiences through virtual showrooms, advanced driver-assistance systems, and in-car entertainment. Mirror frames, screws, and padding are essential elements of these designs, ensuring a snug fit and optimal functionality. The market also offers lightweight alternatives, such as LCD sun visors, to cater to the growing demand for fuel efficiency and reduced vehicle weight. In summary, the market is a dynamic and evolving sector, driven by the need for comfort, safety, and functionality in the vehicle cabin. With a focus on innovation and multifunctional components, this market continues to grow, providing solutions for both conventional and advanced sun visor applications.
How is this Automotive Sun Visor Industry segmented and which is the largest segment?
The industry research report provides comprehensive data (region-wise segment analysis), with forecasts and estimates in "USD million" for the period 2025-2029, as well as historical data from 2019-2023 for the following segments.
- Component
- Conventional
- LCD
- Vehicle Type
- Passenger vehicle
- Commercial vehicle
- Electric vehicle
- Method
- Manual
- Automatic
- Smart
- Channel
- Original equipment manufacturer (OEM)
- Aftermarket
- Geography
- APAC
- China
- India
- Japan
- South Korea
- Europe
- Germany
- UK
- France
- Italy
- North America
- Canada
- US
- Middle East and Africa
- South America
- APAC
By Component Insights
- The conventional segment is estimated to witness significant growth during the forecast period. The market encompasses conventional and LCD sun visors for passenger cars and commercial vehicles. Conventional sun visors, which are the largest market segment, are favored due to their affordability, ease of installation, and minimal maintenance requirements. These visors, made of materials like vinyl, fabric, and recycled plastics, consist of components such as mirror, cushioning, electric cable, flap, frame, and lights. They help regulate interior temperature by blocking direct sunlight, functioning as a sunroof in vehicles. LCD sun visors offer additional features like DVD playback and expandable configurations, catering to passenger comfort and safety. Technological advancements, such as smart sun visors with adaptive capabilities, enhance user experience.
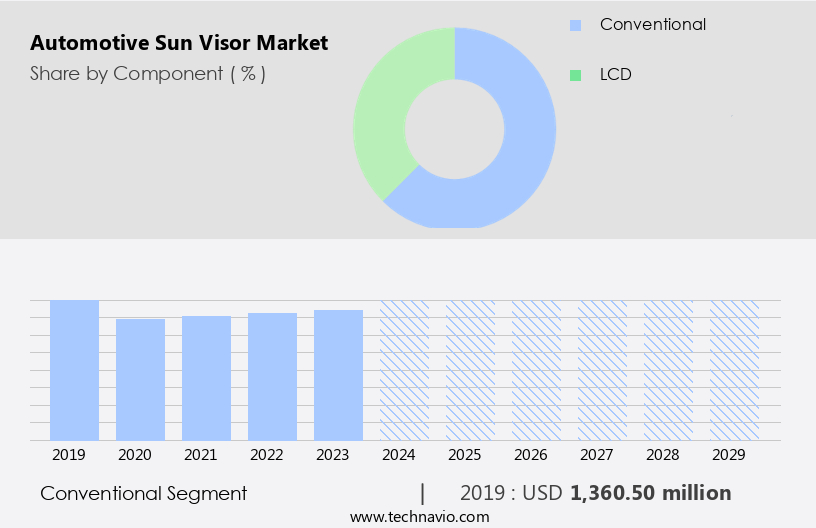
Get a glance at the market report of share of various segments Request Free Sample
The Conventional segment was valued at USD 1.36 billion in 2019 and showed a gradual increase during the forecast period.
Regional Analysis
- APAC is estimated to contribute 39% to the growth of the global market during the forecast period. Technavio’s analysts have elaborately explained the regional trends and drivers that shape the market during the forecast period.

For more insights on the market size of various regions, Request Free Sample
The market in Asia Pacific (APAC) is experiencing significant growth due to the expanding automotive sector and increasing consumer preference for premium vehicles. Urbanization and globalization have led to an increase in disposable income in countries like China, Indonesia, and Singapore, resulting in a rise in car sales and the overall growth of the automotive industry in APAC. The growing affluence of consumers In the region is expected to boost the demand for premium automobiles, consequently driving the market. Sun visors are essential components in vehicles, providing protection against the glare of sunlight and heat absorption, enhancing driver and co-driver safety.
They are available in various types, including conventional and LCD sun visors, and come in different shapes, sizes, and materials such as vinyl, fabric, and recycled plastics. The market caters to both passenger cars and commercial vehicles, with sales channels including original equipment manufacturers (OEM) and aftermarket sales. Technological advancements, such as smart sun visors with adaptive capabilities, are also gaining popularity in the market. The market in APAC is expected to continue its growth trajectory, driven by these factors and increasing vehicle production and demand.
Market Dynamics
Our researchers analyzed the data with 2024 as the base year, along with the key drivers, trends, and challenges. A holistic analysis of drivers will help companies refine their marketing strategies to gain a competitive advantage.
What are the key market drivers leading to the rise in the adoption of Automotive Sun Visor Industry?
- Increasing demand for premium vehicles is the key driver of the market. The market is experiencing significant growth due to the increasing popularity of luxury vehicles. In developed economies, consumers are shifting towards purchasing premium cars, which are equipped with advanced interior applications, including sun visors. This trend is driven by rising disposable incomes and low unemployment rates, leading to increased consumer confidence and willingness to invest in high-end products. Automotive sun visors are essential components in both passenger cars and commercial vehicles, providing relief from the glare of sunlight and heat absorption. These visors come in various designs, including rectangular-shaped, manually operated shields, and expandable configurations. The market offers a range of sun visor types, such as conventional and LCD sun visors, with the latter featuring multifunctional components like DVD playback.
- Materials used in sun visor assembly include vinyl, fabric, and recycled plastics, catering to different vehicle types and consumer preferences. Lightweight alternatives and material combinations are gaining popularity for their efficiency and durability. Sun visors are integrated into the vehicle's ergonomic designs, ensuring optimal functionality and visual appeal. The market is influenced by various factors, including technological advancement, safety features, and macroeconomic conditions. The industry is expected to witness continuous growth, driven by increasing vehicle demand, urbanization, and emerging economies. The competitive environment is pushing manufacturers to innovate and offer smart sun visors with adaptive capabilities and optimal lighting conditions for enhanced user comfort and safety.
What are the market trends shaping the Automotive Sun Visor Industry?
- Use of eco-friendly material for making automotive sun visors is the upcoming market trend. The market is evolving, with a focus on eco-friendly materials for vehicle cabin components. Traditionally, sun visors have been made from synthetic plastics like polyvinyl chloride. However, consumer awareness and industry trends are driving a shift towards sustainable materials. Key suppliers are investing in renewably sourced materials, catering to the growing demand for eco-friendly automotive interiors. Heat absorption and glare from sunlight are concerns for both passengers and drivers. Sun visors play a crucial role in enhancing driver safety by reducing the impact of sunlight. The market for sun visors is diverse, catering to passenger cars, commercial vehicles, and electric vehicles.
- The global automotive sector's electrification and increasing sales of electric vehicles are influencing the sun visor market. The market offers various configurations, including fixed and expandable, and component types like conventional sun visors and LCD sun visors. These visors come in various materials, such as vinyl, fabric, and lightweight alternatives. Manufacturers are exploring material combinations, including recycled plastics, to enhance efficiency and reduce environmental impact. Sun visor assemblies consist of electric cables, mirror frames, padding, and screws. The assembly process requires durability, functionality, and minimal maintenance requirements. Luxury vehicles prioritize interior aesthetics and visual appeal, making sun visors an essential accessory.
What challenges does the Automotive Sun Visor Industry face during its growth?
- Incurring extra cost for designing apt sun visors is a key challenge affecting the industry growth. The market is witnessing significant growth due to the increasing demand for comfort and safety features in vehicles. The glare of sunlight and heat absorption in the vehicle cabin can negatively impact driver and co-driver safety, leading to the need for effective sun visors. Electronic equipment in modern vehicles, such as LCD screens and audio systems, can also create glare, making sun visors a necessary component. Automotive sun visors come in various types and designs, including rectangular-shaped, manually operated shields, and LCD sun visors with DVD playback. Materials used in sun visor assembly include vinyl, fabric, and recycled plastics, catering to different vehicle types and consumer preferences.
- The market is witnessing technological advancements, with smart sun visors featuring adaptive capabilities and optimal visibility in various lighting conditions. The global automotive sector is a significant contributor to the economy, with sales channels ranging from OEM to aftermarket. The market performance is influenced by macroeconomic factors, including population growth, vehicle penetration, and lifestyle patterns. Safety features, such as integrated ergonomic designs and multifunctional components, are essential considerations for automotive sun visors. The market is competitive, with players focusing on cost-effective installation, minimal maintenance requirements, and sturdy designs.
Exclusive Customer Landscape
The market forecasting report includes the adoption lifecycle of the market, covering from the innovator’s stage to the laggard’s stage. It focuses on adoption rates in different regions based on penetration. Furthermore, the market report also includes key purchase criteria and drivers of price sensitivity to help companies evaluate and develop their market growth analysis strategies.
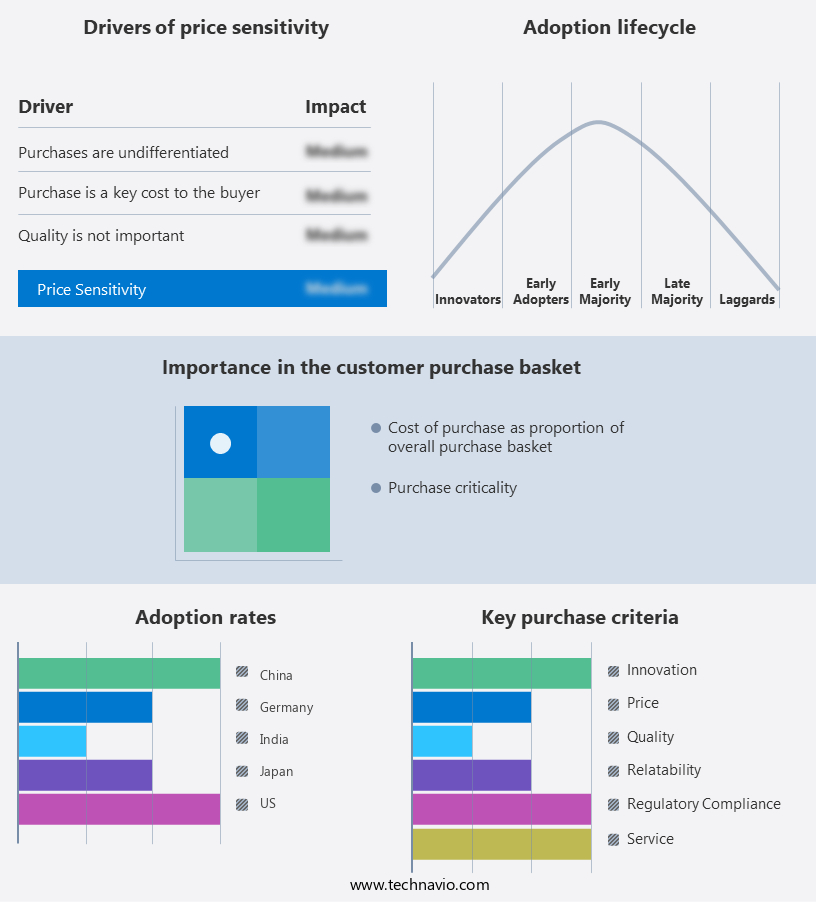
Customer Landscape
Key Companies & Market Insights
Companies are implementing various strategies, such as strategic alliances, market forecast, partnerships, mergers and acquisitions, geographical expansion, and product/service launches, to enhance their presence in the industry.
ACME Specialty Manufacturing Co. - This company focuses on manufacturing exterior mirrors and interior mirrors. The key offerings of the company include automotive sun-visors.
The industry research and growth report includes detailed analyses of the competitive landscape of the market and information about key companies, including:
- ACME Specialty Manufacturing Co.
- American Stitchco Inc.
- Continental AG
- Faucher Industries
- Grios s.r.o.
- Grupo Antolin Irausa SA
- Gumotex Group
- Hansen International Inc.
- HAYASHI TELEMPU CORPORATION
- Howa Co. Ltd.
- Kasai Kogyo Co. Ltd.
- KB Foam Inc.
- Magna International Inc.
- Martur Fompak International
- Piston Group
- Rosco Inc.
- Seatz Manufacturing
- Shanghai Daimay Automotive Interior Co. Ltd.
- Sunvisors India Pvt. Ltd.
- Toyota Boshoku Corp.
Qualitative and quantitative analysis of companies has been conducted to help clients understand the wider business environment as well as the strengths and weaknesses of key industry players. Data is qualitatively analyzed to categorize companies as pure play, category-focused, industry-focused, and diversified; it is quantitatively analyzed to categorize companies as dominant, leading, strong, tentative, and weak.
Research Analyst Overview
The market encompasses a vital segment of the vehicle cabin, designed to mitigate the glare of sunlight and heat absorption during travel. These components play a crucial role in ensuring driver and co-driver safety and comfort, particularly in various traffic flow conditions. The sun visor's complex design includes electric cables, mirror frames, padding, and screws, which are integral to its functionality. The global automotive sector's technological advancement and electrification trends have led to the development of electric vehicles (EVs) and various sun visor alternatives. Traditional sun visors, typically made of vinyl or fabric, have given way to more sophisticated LCD sun visors, offering multifunctional components such as DVD playback and LCD screens.
Moreover, the market's growth is influenced by several macroeconomic factors, including population growth, urbanization, and increasing disposable incomes. The passenger car segment dominates the market, with sales driven by the lifestyle patterns and safety features prioritized by consumers. The material combinations used in sun visor assembly vary, with lightweight alternatives such as recycled plastics gaining popularity due to their efficiency and eco-friendly attributes. The industry experts anticipate that the market performance will continue to be strong, driven by the increasing demand for in-vehicle entertainment options and cost-effective installation. The competitive environment in the market is characterized by the presence of various component types, including rectangular-shaped, manually operated shields, and expandable configurations.
Furthermore, smart sun visors with adaptive capabilities and optimal visibility features are gaining traction, catering to the evolving needs of drivers and passengers. The sun visor assembly process involves the use of electric cables, mirror frames, and screws, ensuring durability and functionality. The integration of ergonomic designs and multifunctional components enhances the vehicle experience, particularly in luxury cars where interior aesthetics and visual appeal are essential. The market's future growth is influenced by various governing factors, including safety standards and vehicle manufacturing processes. Domestic consumption and population base are significant drivers, with emerging economies contributing to the market's expansion.
|
Market Scope |
|
|
Report Coverage |
Details |
|
Page number |
231 |
|
Base year |
2024 |
|
Historic period |
2019-2023 |
|
Forecast period |
2025-2029 |
|
Growth momentum & CAGR |
Accelerate at a CAGR of 2.1% |
|
Market growth 2025-2029 |
USD 197.6 million |
|
Market structure |
Fragmented |
|
YoY growth 2024-2025(%) |
2.1 |
|
Key countries |
US, China, Japan, India, UK, Canada, South Korea, Germany, France, and Italy |
|
Competitive landscape |
Leading Companies, Market Positioning of Companies, Competitive Strategies, and Industry Risks |
What are the Key Data Covered in this Automotive Sun Visor Market Research and Growth Report?
- CAGR of the Automotive Sun Visor industry during the forecast period
- Detailed information on factors that will drive the market growth and forecasting between 2025 and 2029
- Precise estimation of the size of the market and its contribution of the industry in focus to the parent market
- Accurate predictions about upcoming growth and trends and changes in consumer behaviour
- Growth of the market across APAC, Europe, North America, Middle East and Africa, and South America
- Thorough analysis of the market’s competitive landscape and detailed information about companies
- Comprehensive analysis of factors that will challenge the automotive sun visor market growth of industry companies
We can help! Our analysts can customize this automotive sun visor market research report to meet your requirements.
 RIA -
RIA - 
