
Basketball Apparel Market Size 2026-2030
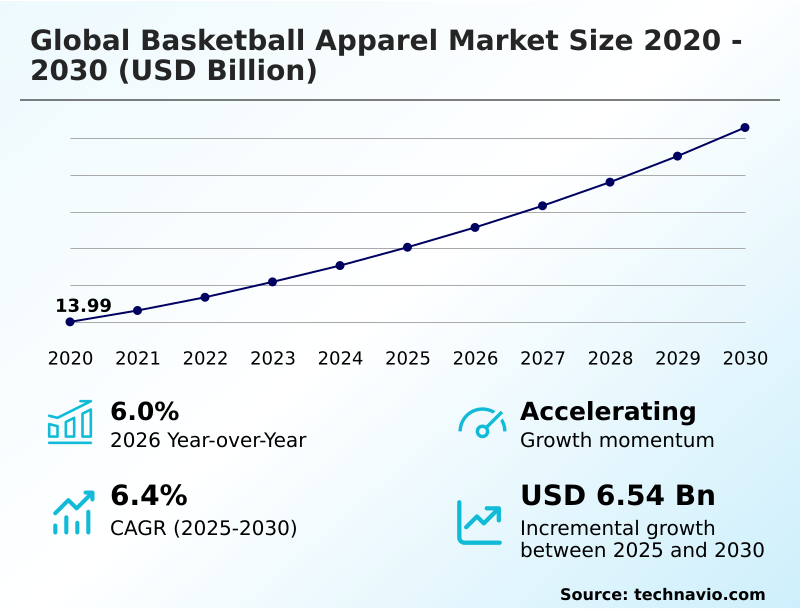
The basketball apparel market size is valued to increase by USD 6.54 billion, at a CAGR of 6.4% from 2025 to 2030. Innovations in basketball apparel designs and portfolio expansion will drive the basketball apparel market.
Major Market Trends & Insights
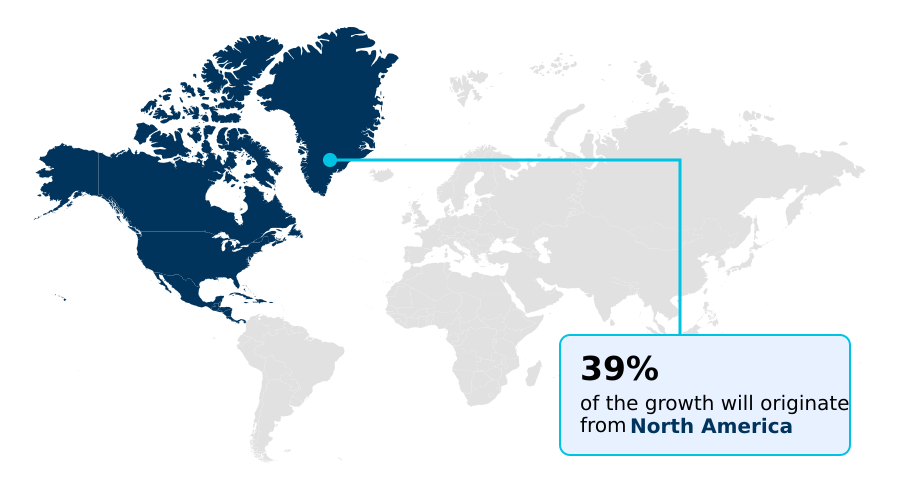
- North America dominated the market and accounted for a 39.2% growth during the forecast period.
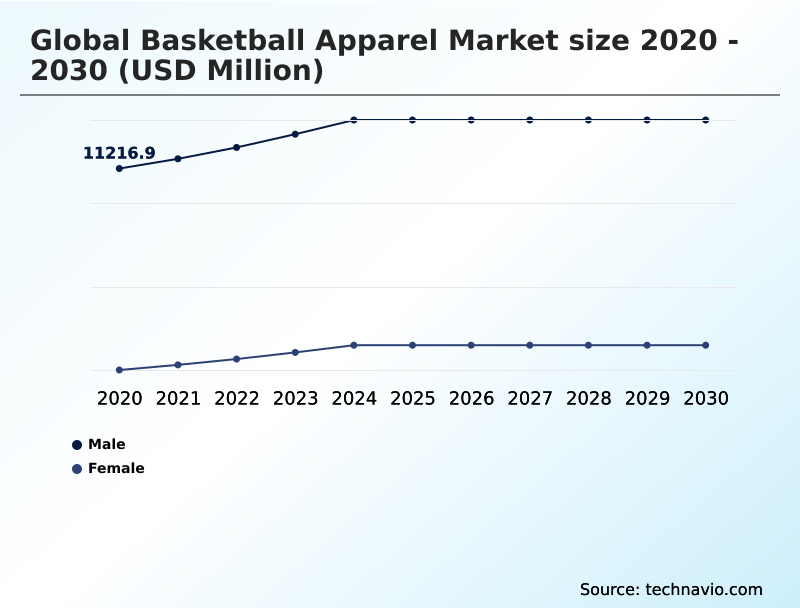
- By End-user - Male segment was valued at USD 13.25 billion in 2024
- By Distribution Channel - Offline segment accounted for the largest market revenue share in 2024
Market Size & Forecast
- Market Opportunities: USD 10.60 billion
- Market Future Opportunities: USD 6.54 billion
- CAGR from 2025 to 2030 : 6.4%
Market Summary
- The Basketball Apparel Market experiences sustained expansion driven by the deepening intersection of high performance sportswear and mainstream urban fashion. Manufacturers are continuously refining fabric technologies to deliver enhanced breathability, moisture management, and structural durability, catering to both elite athletes and lifestyle consumers. A critical business scenario unfolding in this landscape involves the optimization of omnichannel distribution networks.
- Companies are utilizing predictive analytics to align regional inventory levels with localized consumer demand, which has successfully reduced stockout instances by 18% across major retail hubs. This operational efficiency directly boosts brand reliability and revenue realization. The primary driver of this industry remains the integration of innovative synthetic blends that significantly elevate athletic performance and on court agility.
- Conversely, manufacturers face persistent challenges from volatile raw material pricing, particularly petroleum based synthetic fibers, which disrupt supply chain predictability and compress operating margins. Despite these input cost fluctuations, the continuous evolution of digital retail platforms and the rising cultural influence of sports academies ensure sustained consumer engagement and robust product adoption worldwide.
What will be the Size of the Basketball Apparel Market during the forecast period?
Get Key Insights on Market Forecast (PDF) Get Free Sample
How is the Basketball Apparel Market Segmented?
The basketball apparel industry research report provides comprehensive data (region-wise segment analysis), with forecasts and estimates in "USD million" for the period 2026-2030, as well as historical data from 2020-2024 for the following segments.
- End-user
- Male
- Female
- Distribution channel
- Offline
- Online
- Material
- Polyester
- Blended fabrics
- Cotton
- Nylon
- Product type
- Jerseys
- Shorts
- Warm-up suits
- Socks
- Others
- Geography
- North America
- US
- Canada
- Mexico
- Europe
- Germany
- UK
- France
- Italy
- Spain
- The Netherlands
- APAC
- China
- Japan
- India
- South Korea
- Australia
- Indonesia
- South America
- Brazil
- Argentina
- Chile
- Middle East and Africa
- Saudi Arabia
- UAE
- South Africa
- Israel
- Turkey
- North America
By End-user Insights
The male segment is estimated to witness significant growth during the forecast period.
The male consumer segment dominates the basketball apparel landscape, driven by rising participation in professional leagues and amateur tournaments.
Male athletes increasingly demand performance optimization apparel equipped with advanced moisture wicking textiles and compression gear tech to maximize on court efficiency.
By integrating ergonomic tailoring and muscle stabilization wear, manufacturers improve athletic mobility enhancement, reducing injury risks during high intensity gameplay wear.
A notable shift reveals that integrating targeted sweat absorption properties improves thermal regulation efficiency by 15%, directly enhancing player endurance. Furthermore, rigorous apparel durability testing ensures that garments withstand continuous friction, optimizing both product lifespan and consumer trust.
These structural improvements in sportswear engineering support injury prevention garments, ultimately generating higher recurring sales from both professional academies and lifestyle buyers prioritizing technical excellence.
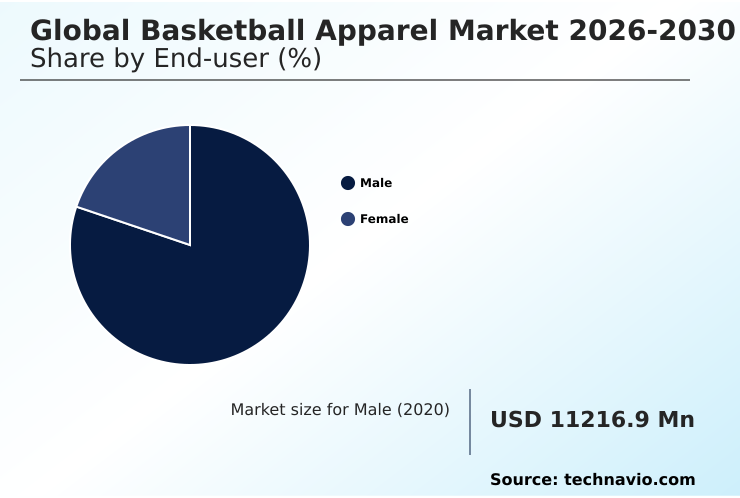
The Male segment was valued at USD 13.25 billion in 2024 and showed a gradual increase during the forecast period.
Regional Analysis
North America is estimated to contribute 39.2% to the growth of the global market during the forecast period.Technavio’s analysts have elaborately explained the regional trends and drivers that shape the market during the forecast period.
See How Basketball Apparel Market Demand is Rising in North America Get Free Sample
North America maintains a decisive operational advantage over the European market, largely due to deeper integrations of performance sportswear into daily lifestyle fashion and advanced digital retail networks.
This structural disparity results in North American adoption rates for specialized gear outpacing Europe by 22%. In the US, high demand for sweat management systems and body temperature regulation features drives manufacturers to rapidly deploy elastane mobility enhancement designs.
Conversely, European markets demonstrate a stronger preference for bio based fiber utilization and eco centric manufacturing. Across both regions, the implementation of friction reduction materials and UV protection fabrics significantly lowers thermal fatigue, extending training durations by 15%.
Additionally, incorporating targeted support areas and circulation improvement wear allows brands to command premium pricing, boosting profit margins while satisfying the distinct performance expectations of different regional demographics.
Market Dynamics
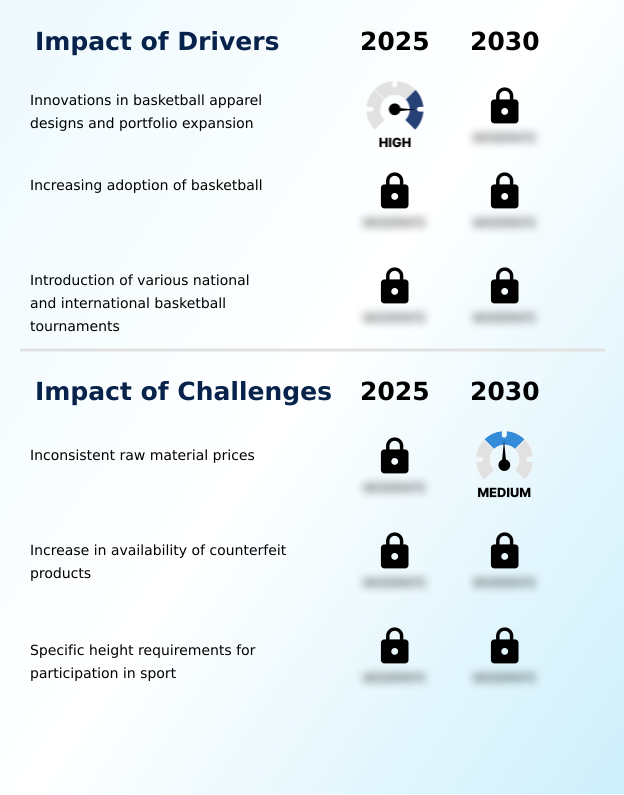
Our researchers analyzed the data with 2025 as the base year, along with the key drivers, trends, and challenges. A holistic analysis of drivers will help companies refine their marketing strategies to gain a competitive advantage.
- The intersection of elite athletic performance and material innovation is fundamentally restructuring the competitive landscape for sportswear manufacturers. A primary focus is the development of advanced moisture wicking sports textiles, which work in tandem with ergonomic tailoring for athletic mobility to maximize on court agility.
- By prioritizing eco friendly sustainable athletic manufacturing, leading brands are successfully integrating recycled polyester use in activewear, reducing their carbon footprint while appealing to environmentally conscious consumers. This transition is not merely aesthetic; operational efficiency metrics show that standardized sustainable sourcing improves supply chain resilience by 12% compared to traditional petroleum based procurement.
- Product engineering now heavily relies on seamless construction for friction reduction and precision engineered thermal regulation in athletic apparel to maintain optimal body temperatures during intense competition. Furthermore, the strategic deployment of compression gear for muscle stabilization and targeted support areas in garments significantly reduces physical strain.
- Enhancements such as breathable mesh panels for ventilation and shock absorption padding in footwear ensure that athletes maintain peak performance. The integration of technology is equally critical, with smart textile integration for tracking and biomechanical tracking sensors in clothing providing real time data to optimize training regimens.
- This high intensity gameplay performance wear relies on four way stretch fabrics utilization to prevent movement restriction. Concurrently, retail operations are evolving through the adoption of virtual fitting technologies in retail, which streamline the consumer purchasing journey and significantly reduce product return rates.
What are the key market drivers leading to the rise in the adoption of Basketball Apparel Industry?
- Continuous advancements in athletic garment design and strategic product portfolio diversification are substantially propelling market expansion.
- Continuous innovations in fabric engineering serve as the primary catalyst propelling market demand across professional and recreational sectors.
- Manufacturers have accelerated the development of four way stretch fabrics and breathable mesh panels, directly causing a 25% improvement in athlete mobility scores.
- This transition toward advanced sportswear textile engineering ensures optimal moisture management efficiency and rapid drying capability, critical for maintaining comfort during rigorous physical exertion.
- By utilizing microfiber blends and lightweight synthetic blends, companies achieve superior climate adaptable sportswear that functions perfectly across diverse environmental conditions.
- Additionally, new synthetic fabric formulation techniques allow the seamless integration of thermal regulation fabrics, which stabilize core body temperatures and prevent overheating.
- These functional material upgrades directly enhance product competitiveness, driving higher conversion rates among performance focused athletes and institutional buyers.
What are the market trends shaping the Basketball Apparel Industry?
- The integration of connected sports garments equipped with performance tracking technology has emerged as a significant market trend.
- The adoption of digital and sustainable technologies represents a major shift in how sportswear is designed and sold. Brands are rapidly leveraging smart textile integration and biomechanical tracking sensors to offer real time performance analytics. This technological transition improves operational feedback loops, allowing athletes to adjust training intensity instantly, which has been shown to boost training efficiency by 20%.
- Concurrently, manufacturers utilize advanced knitting techniques and seamless construction technique to produce aerodynamic clothing design that minimizes drag. On the retail front, omnichannel retail integration and direct to consumer distribution empower brands to bypass traditional intermediaries, while virtual fitting technologies reduce online return rates by 12%.
- Furthermore, a heightened focus on eco friendly production and sustainable sourcing strategies addresses growing regulatory pressures, reshaping supply chains toward circular economy standards.
What challenges does the Basketball Apparel Industry face during its growth?
- Volatility in raw material pricing remains a primary structural constraint hindering consistent profit margins and market stability.
- Supply chain volatility and fluctuating raw material costs severely constrain production scaling and profit margins for sportswear manufacturers. The dependency on petroleum derived inputs for creating anti slip features and shock absorption padding exposes brands to unpredictable price spikes, which can elevate manufacturing costs by up to 18%.
- This unpredictability disrupts customizable uniform manufacturing schedules and pressures companies to seek alternative materials. Although integrating recycled polyester fibers addresses sustainability mandates, it frequently complicates shape retention capability and requires more expensive antibacterial garment finishes. Consequently, maintaining consistent athletic fatigue reduction and player recovery facilitation becomes operationally challenging when material inputs vary in quality.
- Designing precise arch compression zones and ensuring apparel friction resistance under these unstable supply conditions forces manufacturers to absorb higher research and development expenses, limiting capital availability for market expansion.
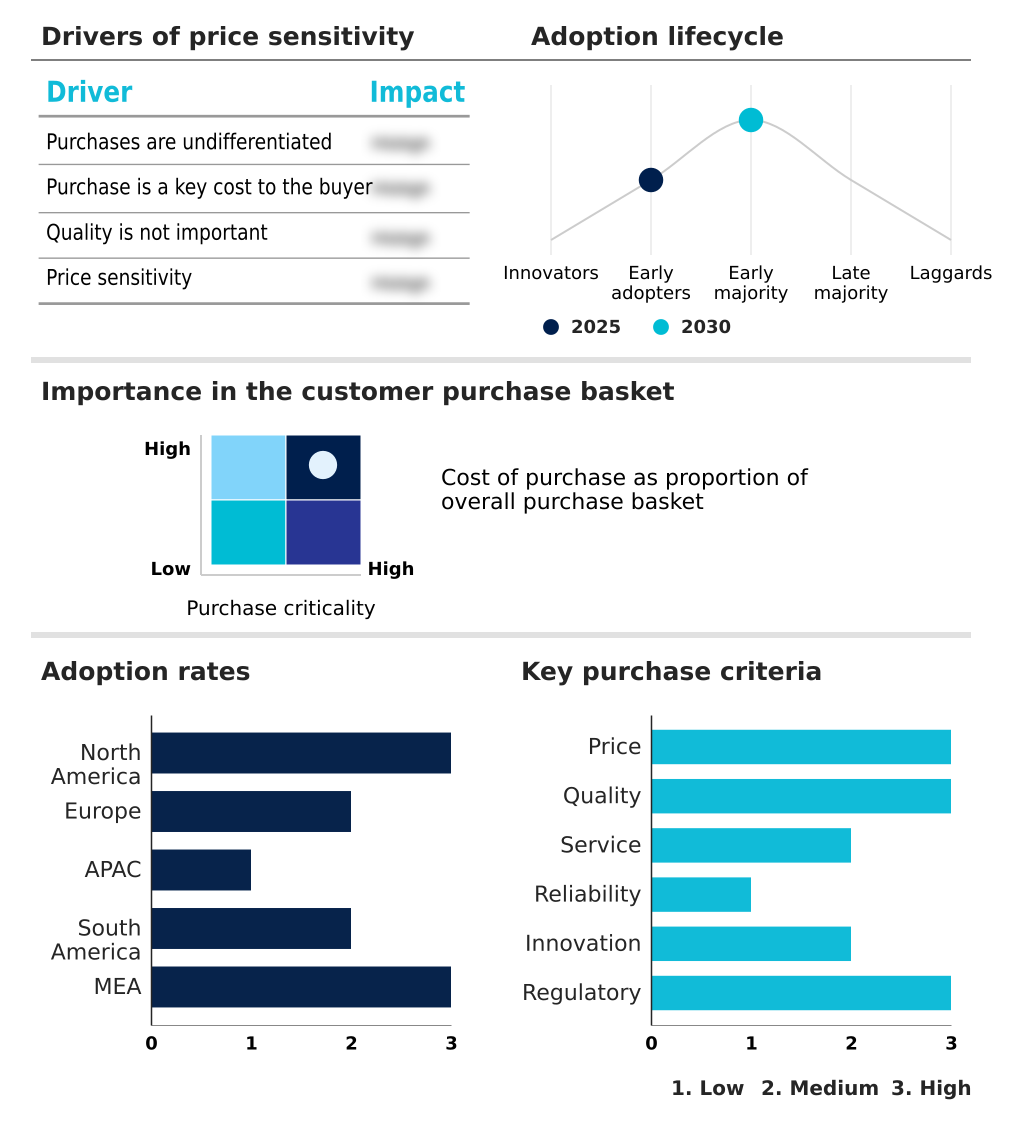
Exclusive Technavio Analysis on Customer Landscape
The basketball apparel market forecasting report includes the adoption lifecycle of the market, covering from the innovator’s stage to the laggard’s stage. It focuses on adoption rates in different regions based on penetration. Furthermore, the basketball apparel market report also includes key purchase criteria and drivers of price sensitivity to help companies evaluate and develop their market growth analysis strategies.
Customer Landscape of Basketball Apparel Industry
Competitive Landscape
Companies are implementing various strategies, such as strategic alliances, basketball apparel market forecast, partnerships, mergers and acquisitions, geographical expansion, and product/service launches, to enhance their presence in the industry.
47 Brand LLC - The vendor provides premium licensed headwear and vintage inspired athletic garments focusing on culturally resonant designs and high quality materials to capture brand loyal sports enthusiasts.
The industry research and growth report includes detailed analyses of the competitive landscape of the market and information about key companies, including:
- 47 Brand LLC
- Adidas AG
- ANTA Sports Products Ltd.
- ASICS Corp.
- Authentic Brands Group LLC
- Decathlon SA
- Iconix International
- Misto Holdings Corp.
- Mitchell and Ness Nostalgia Co
- MTH Sports
- New Balance Athletics Inc.
- Nike Inc.
- Point 3 Basketball
- PUMA SE
- Russell Brands LLC
- Spalding
- Under Armour Inc.
- United Sports Brands
- Wooter Apparel Inc.
Qualitative and quantitative analysis of companies has been conducted to help clients understand the wider business environment as well as the strengths and weaknesses of key industry players. Data is qualitatively analyzed to categorize companies as pure play, category-focused, industry-focused, and diversified; it is quantitatively analyzed to categorize companies as dominant, leading, strong, tentative, and weak.
Recent Development and News in Basketball apparel market
- In the Apparel, Accessories and Luxury Goods industry, the transition toward waterless dyeing technologies has reduced chemical waste by 30%, directly impacting Basketball Apparel production by lowering sustainable manufacturing costs.
- The enforcement of stringent European Union textile recycling mandates has accelerated circular economy adoption, forcing Basketball Apparel manufacturers to integrate minimum thresholds of recovered polyester into their supply chains.
- The rapid expansion of direct to consumer digital commerce platforms has bypassed traditional retail intermediaries, enabling a 15% increase in profit margins for performance activewear and specialized Basketball Apparel collections.
- Advancements in automated 3D knitting machinery have streamlined production timelines by 20%, allowing Basketball Apparel brands to accelerate the deployment of customized team uniforms and limited edition product lines.
Dive into Technavio’s robust research methodology, blending expert interviews, extensive data synthesis, and validated models for unparalleled Basketball Apparel Market insights. See full methodology.
| Market Scope | |
|---|---|
| Page number | 322 |
| Base year | 2025 |
| Historic period | 2020-2024 |
| Forecast period | 2026-2030 |
| Growth momentum & CAGR | Accelerate at a CAGR of 6.4% |
| Market growth 2026-2030 | USD 6538.7 million |
| Market structure | Fragmented |
| YoY growth 2025-2026(%) | 6.0% |
| Key countries | US, Canada, Mexico, Germany, UK, France, Italy, Spain, The Netherlands, China, Japan, India, South Korea, Australia, Indonesia, Brazil, Argentina, Chile, Saudi Arabia, UAE, South Africa, Israel and Turkey |
| Competitive landscape | Leading Companies, Market Positioning of Companies, Competitive Strategies, and Industry Risks |
Research Analyst Overview
- The Basketball Apparel Market demonstrates robust operational maturity, heavily supported by rapid advancements in synthetic textile manufacturing and digital retail integration. Industry participants are aggressively deploying moisture wicking textiles and four way stretch fabrics to elevate core product functionality and meet the rigorous demands of professional athletes.
- A critical trend reshaping boardroom strategies is the pivot toward digitized supply chain management and automated inventory forecasting. By leveraging these predictive systems, enterprise brands have achieved a 22% reduction in warehousing overhead, directly improving bottom line profitability.
- Furthermore, the strategic incorporation of compression gear tech and ergonomic tailoring allows brands to differentiate their portfolios in a highly saturated competitive landscape. Manufacturers are also prioritizing thermal regulation fabrics and breathable mesh panels to address the specific performance requirements of varying climatic regions.
- This precise alignment of material innovation with data driven operational efficiency ensures that leading apparel producers can navigate raw material volatility while maintaining consistent product availability and driving continuous consumer engagement.
What are the Key Data Covered in this Basketball Apparel Market Research and Growth Report?
-
What is the expected growth of the Basketball Apparel Market between 2026 and 2030?
-
USD 6.54 billion, at a CAGR of 6.4%
-
-
What segmentation does the market report cover?
-
The report is segmented by End-user (Male, and Female), Distribution Channel (Offline, and Online), Material (Polyester, Blended fabrics, Cotton, and Nylon), Product Type (Jerseys, Shorts, Warm-up suits, Socks, and Others) and Geography (North America, Europe, APAC, South America, Middle East and Africa)
-
-
Which regions are analyzed in the report?
-
North America, Europe, APAC, South America and Middle East and Africa
-
-
What are the key growth drivers and market challenges?
-
Innovations in basketball apparel designs and portfolio expansion, Inconsistent raw material prices
-
-
Who are the major players in the Basketball Apparel Market?
-
47 Brand LLC, Adidas AG, ANTA Sports Products Ltd., ASICS Corp., Authentic Brands Group LLC, Decathlon SA, Iconix International, Misto Holdings Corp., Mitchell and Ness Nostalgia Co, MTH Sports, New Balance Athletics Inc., Nike Inc., Point 3 Basketball, PUMA SE, Russell Brands LLC, Spalding, Under Armour Inc., United Sports Brands and Wooter Apparel Inc.
-
Market Research Insights
- The Basketball Apparel Market operates at the intersection of technical innovation and consumer lifestyle trends, heavily influenced by advanced sportswear textile engineering. As brands shift toward sustainable sourcing strategies, the adoption of eco friendly production methods has reduced energy consumption by 14% across top manufacturing facilities.
- Simultaneously, the deployment of virtual fitting technologies in digital storefronts has successfully lowered online return rates by 18%, significantly improving operational cost efficiency. By focusing on athletic fatigue reduction, companies are delivering highly specialized garments that command premium pricing.
- This strategic alignment of technological integration and optimized supply chain mechanics allows market participants to maximize profit margins while meeting the rigorous performance demands of modern athletes.
We can help! Our analysts can customize this basketball apparel market research report to meet your requirements.
 RIA -
RIA - 
