Berries Market Analysis, Size, and Forecast 2026-2030: Europe (Germany, UK, and Spain), North America (US, Canada, and Mexico), APAC (China, Japan, and India), South America (Brazil and Argentina), Middle East and Africa (Saudi Arabia, UAE, and South Africa), and Rest of World (ROW)

Berries Market Analysis, Size, and Forecast 2026-2030:
Europe (Germany, UK, and Spain), North America (US, Canada, and Mexico), APAC (China, Japan, and India), South America (Brazil and Argentina), Middle East and Africa (Saudi Arabia, UAE, and South Africa), and Rest of World (ROW)

Published: Mar 2026 298 Pages SKU: IRTNTR71695

Market Overview at a Glance

$14.57 B
Market Opportunity
6.7%
CAGR 2025 - 2030
43.2%
Europe Growth
$31.02 B
Food and beverages segment 2024

Berries Market Size 2026-2030

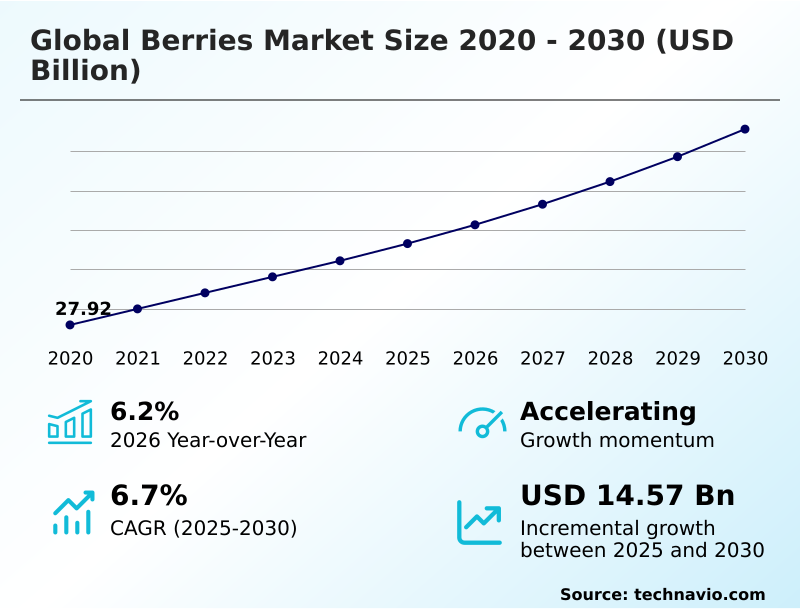
The berries market size is valued to increase by USD 14.57 billion, at a CAGR of 6.7% from 2025 to 2030. Growing awareness and promotion of benefits of consuming berries will drive the berries market.

Major Market Trends & Insights

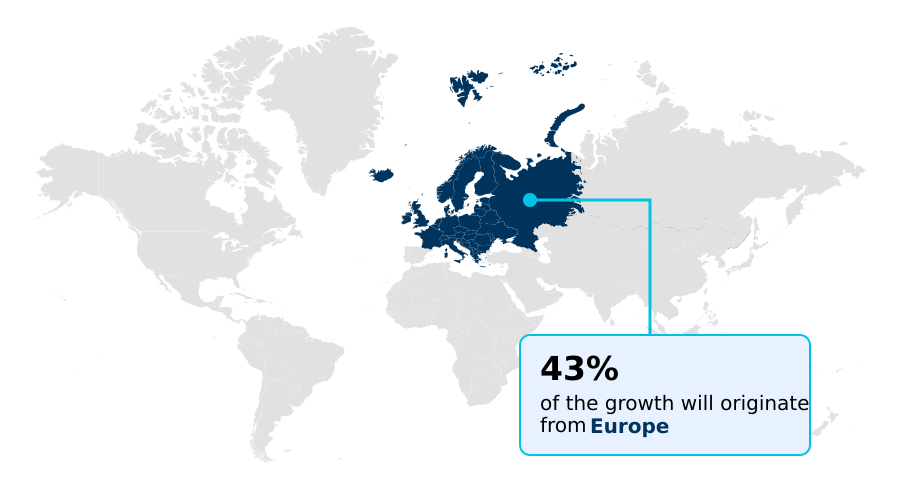
  • Europe dominated the market and accounted for a 43.2% growth during the forecast period.
  • By Application - Food and beverages segment was valued at USD 31.02 billion in 2024
  • By Type - Strawberries segment accounted for the largest market revenue share in 2024

Market Size & Forecast

  • Market Opportunities: USD 24.92 billion
  • Market Future Opportunities: USD 14.57 billion
  • CAGR from 2025 to 2030 : 6.7%

Market Summary

  • The berries market is evolving beyond simple agricultural output, transforming into a sophisticated sector driven by proprietary genetics and advanced cultivation methods. A significant driver is the rising consumer health awareness, which fuels demand for antioxidant-rich extracts and clean-label ingredients in functional foods. This trend supports the superfood market positioning of berries and their integration into plant-based diets.
  • Consequently, producers are adopting sustainable farming practices and investing in varietal innovation to enhance bioactive compounds and improve crop resilience. However, the industry grapples with challenges related to post-harvest waste reduction and the high costs of implementing traceability systems.
  • For instance, a large-scale distributor aiming to ensure supply chain transparency must balance the expense of sophisticated tracking technology against the market's demand for competitive pricing. This dynamic pushes the industry toward greater efficiency, encouraging investment in robotic harvesting technology and improved cold chain logistics to meet demand while managing operational complexities and food safety standards.

What will be the Size of the Berries Market during the forecast period?

Get Key Insights on Market Forecast (PDF) Request Free Sample

How is the Berries Market Segmented?

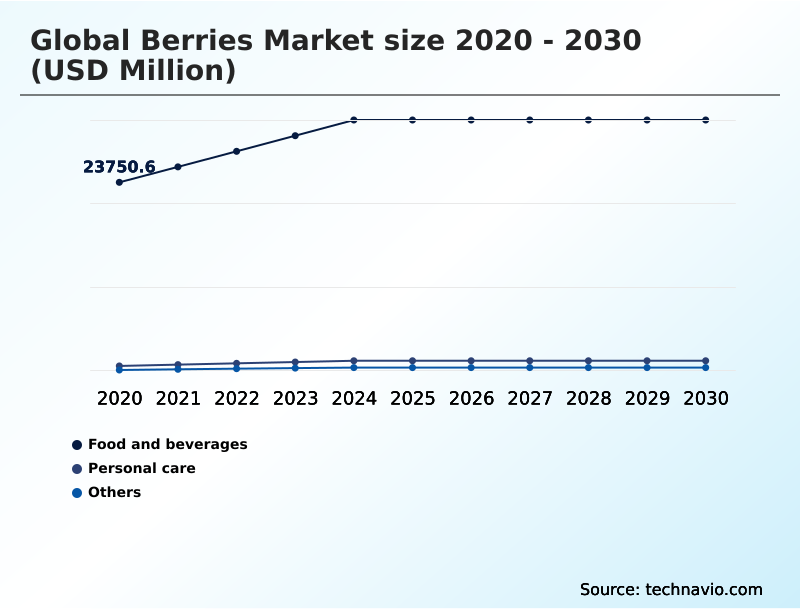
The berries industry research report provides comprehensive data (region-wise segment analysis), with forecasts and estimates in "USD million" for the period 2026-2030, as well as historical data from 2020-2024 for the following segments.

  • Application
    • Food and beverages
    • Personal care
    • Others
  • Type
    • Strawberries
    • Blueberries
    • Raspberries
    • Others
  • Distribution channel
    • Offline
    • Online
  • Geography
    • Europe
      • Germany
      • UK
      • Spain
    • North America
      • US
      • Canada
      • Mexico
    • APAC
      • China
      • Japan
      • India
    • South America
      • Brazil
      • Argentina
    • Middle East and Africa
      • Saudi Arabia
      • UAE
      • South Africa
    • Rest of World (ROW)

By Application Insights

The food and beverages segment is estimated to witness significant growth during the forecast period.

The food and beverages segment remains the primary application within the berries market, driven by the expanding use of berries as functional and clean-label ingredients.

Manufacturers are leveraging natural food colorants and flavors from berries to meet consumer demand for transparency and wellness.

Innovations in processing, such as freeze-drying techniques and the use of individually quick frozen (IQF) formats, are crucial for maintaining nutritional integrity and extending shelf-life extension.

These methods support the inclusion of berries in a wide array of products, from snacks and dairy to functional beverages. The foodservice sector supply chain, in particular, benefits from these advancements, enabling a 15% reduction in product spoilage.

Quality assurance protocols and proprietary genetics further ensure a consistent supply for high-value applications, including specialty berry cultivation for gourmet products.

Request Free Sample

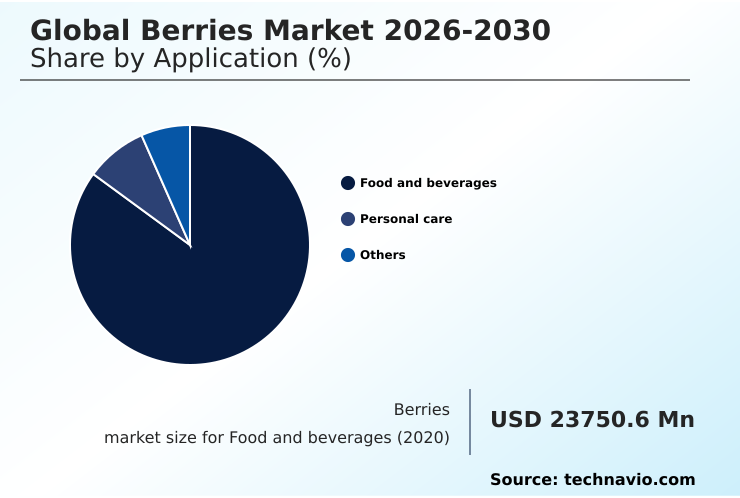
The Food and beverages segment was valued at USD 31.02 billion in 2024 and showed a gradual increase during the forecast period.

Request Free Sample

Regional Analysis

Europe is estimated to contribute 43.2% to the growth of the global market during the forecast period.Technavio’s analysts have elaborately explained the regional trends and drivers that shape the market during the forecast period.

See How Berries Market Demand is Rising in Europe Request Free Sample

The geographic landscape is defined by established hubs and emerging territories, with Europe leading incremental growth, contributing over 43% to the market's expansion.

In North America, the focus is on agritech investment to enhance domestic consumption growth and food security focus, with protected cropping systems and high-density tunnel cultivation becoming standard. South American nations continue to dominate export-oriented production, leveraging favorable climates.

Meanwhile, regions like the Middle East are pioneering hydroponic systems to overcome environmental constraints. This global geographic diversification requires complex logistics, where efficient farm-to-store delivery and sophisticated cold chain management are critical for maintaining quality across continents.

The strategic expansion into new cultivation areas is mitigating risks associated with climate change in traditional growing zones.

Market Dynamics

Our researchers analyzed the data with 2025 as the base year, along with the key drivers, trends, and challenges. A holistic analysis of drivers will help companies refine their marketing strategies to gain a competitive advantage.

  • Understanding the core dynamics of the global berries market 2026-2030 requires analyzing the interplay between production challenges and consumer demands. The impact of weather on berry pricing remains a primary concern for growers, directly influencing profitability and supply stability.
  • As producers navigate the high cost of chemical-free berry farming, many are investing in technology for mechanized berry harvesting, which can reduce labor expenses by up to 30% compared to manual methods. A key focus is on improving the shelf life of strawberries, where innovations in post-harvest treatments and packaging are critical.
  • For consumers, the antioxidant levels in different berry types are a major purchasing driver, fueling research into varietal development. However, the challenges in organic berry cultivation, such as pest management and yield consistency, present significant hurdles. Optimizing the cold chain for fresh berries is essential for reducing spoilage, a constant issue in long-distance supply chains.
  • These factors, combined with consumer trends driving berry consumption and the rise of private label impact on berry market pricing, create a complex operational environment. Furthermore, addressing the risk of contamination in berry packaging and improving water management for berry agriculture are vital for ensuring long-term sustainability and regulatory compliance.

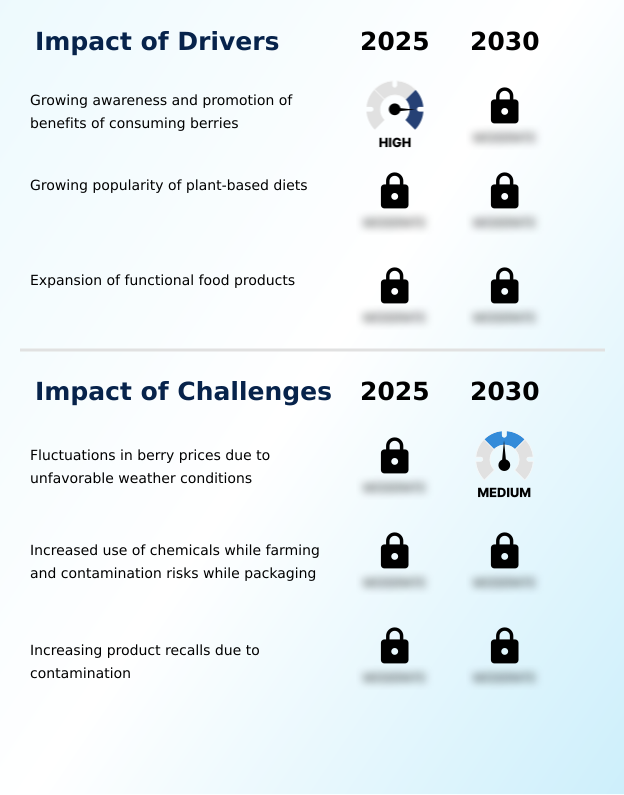
What are the key market drivers leading to the rise in the adoption of Berries Industry?

  • Growing consumer awareness regarding the health benefits of berries, amplified by promotional efforts, serves as a key market driver.

  • Market growth is significantly fueled by the mainstreaming of plant-based diet integration, where berries serve as a key component, contributing to a 20% rise in their use in vegan product formulations.
  • This aligns with the superfood market positioning of berries, which are sought for their antioxidant-rich extracts and bioactive compounds. The expansion of functional food ingredients and nutraceutical ingredient sourcing has created new, high-margin opportunities.
  • To meet this demand, producers are focusing on varietal innovation to ensure a year-round supply chain.
  • Effective retail inventory management and quality assurance protocols are critical to capitalizing on these drivers, with optimized systems reducing out-of-stock instances by up to 18%.

What are the market trends shaping the Berries Industry?

  • The increasing prominence of private-label brands is a significant upcoming trend, as retailers strategically enhance their market position through competitive pricing and quality control.

  • Key trends are reshaping the competitive landscape, with private-label branding gaining significant traction as retailers leverage it to offer value, which has led to a 15% increase in their market share in some categories. This is coupled with heightened consumer health awareness, driving the demand for clean-label ingredients and supporting a premiumization strategy focused on nutritional benefits.
  • As a result, the organic farming conversion rate has accelerated, with growers adopting sustainable packaging solutions to meet retailer and consumer expectations. Supply chain transparency is also paramount, with direct-to-consumer platforms emerging as a key channel. These trends are underpinned by robust food safety standards, compelling the entire industry to innovate.

What challenges does the Berries Industry face during its growth?

  • Fluctuations in berry prices, driven by unfavorable weather conditions, pose a key challenge to the industry's growth trajectory.

  • Persistent challenges require strategic adaptation, particularly in climate-resilient agriculture, where unpredictable weather can cause supply shifts of up to 30% in a single season. This volatility complicates management of counter-seasonal imports and puts pressure on cold chain logistics. Furthermore, growers in export-oriented production regions face issues of water scarcity management and rising costs associated with food safety regulations.
  • The need to reduce post-harvest waste has accelerated the adoption of robotic harvesting technology and advanced traceability systems. These investments, while necessary, increase operational expenses, making it difficult for smaller producers to compete without significant agritech investment and support.

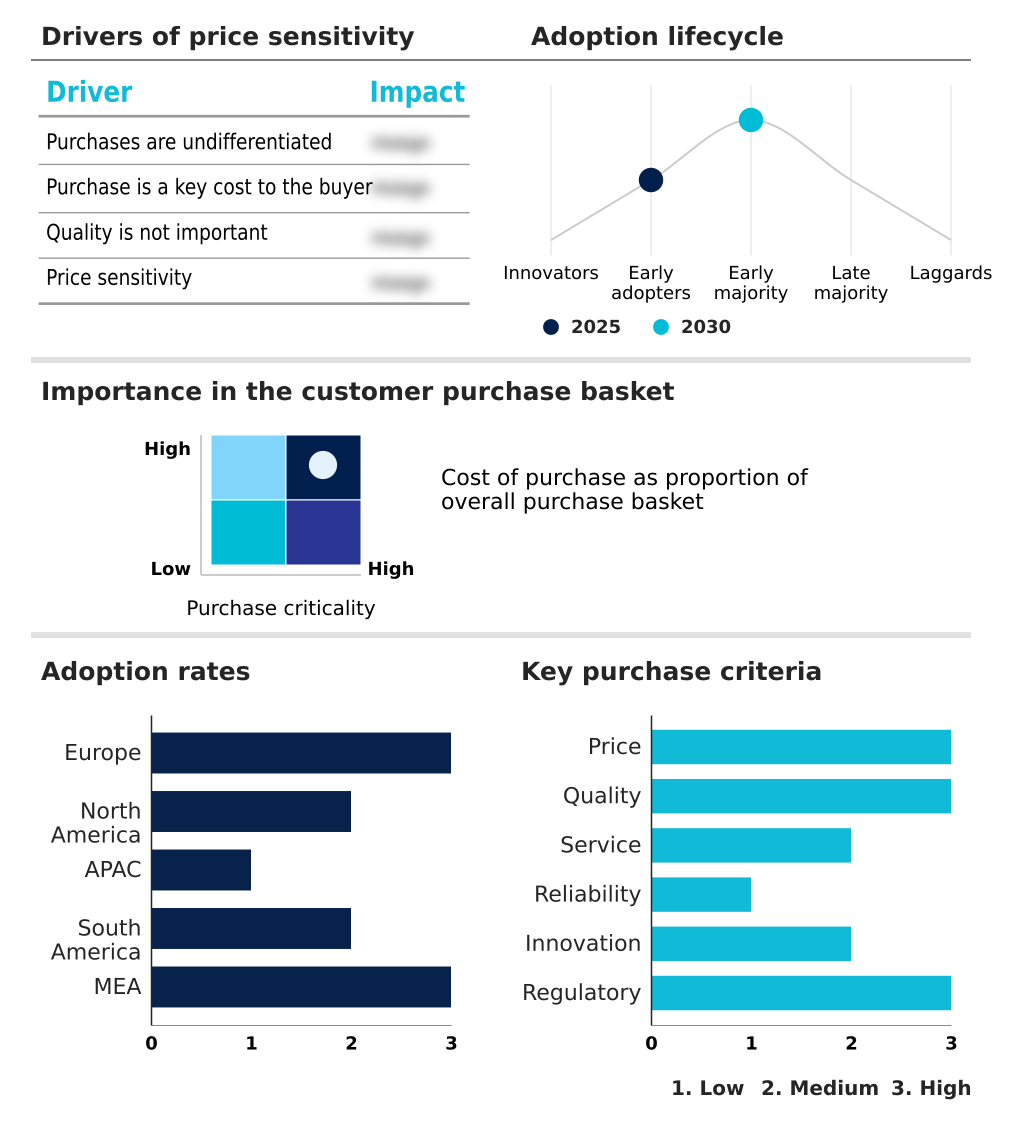
Exclusive Technavio Analysis on Customer Landscape

The berries market forecasting report includes the adoption lifecycle of the market, covering from the innovator’s stage to the laggard’s stage. It focuses on adoption rates in different regions based on penetration. Furthermore, the berries market report also includes key purchase criteria and drivers of price sensitivity to help companies evaluate and develop their market growth analysis strategies.

Customer Landscape of Berries Industry

Competitive Landscape

Companies are implementing various strategies, such as strategic alliances, berries market forecast, partnerships, mergers and acquisitions, geographical expansion, and product/service launches, to enhance their presence in the industry.

AGRANA Beteiligungs AG - Vendors offer a range of fresh and processed berries, focusing on varietal innovation to meet global demand for quality and year-round availability.

The industry research and growth report includes detailed analyses of the competitive landscape of the market and information about key companies, including:

  • AGRANA Beteiligungs AG
  • Arctic Flavors
  • Ardo NV
  • BerryWorld Group
  • Betec
  • California Giant Inc
  • Coast Berry Co. Ltd.
  • Dole plc
  • Driscolls Inc.
  • Earthbound Farm
  • Family Tree Farms
  • Haygrove Ltd.
  • Hortifrut SA
  • Jones Family Farms
  • Joy Wing Mau Group
  • Kenburn Orchards
  • MBG Marketing
  • Naturipe Farms LLC
  • Rainier Fruit Co.
  • World Variety Produce Inc.

Qualitative and quantitative analysis of companies has been conducted to help clients understand the wider business environment as well as the strengths and weaknesses of key industry players. Data is qualitatively analyzed to categorize companies as pure play, category-focused, industry-focused, and diversified; it is quantitatively analyzed to categorize companies as dominant, leading, strong, tentative, and weak.

Recent Development and News in Berries market

  • In May 2025, the European Union implemented stricter mandates regarding chemical residues, specifically capping thiacloprid levels at 0.01 milligrams per kilogram, necessitating immediate modifications in farming practices to maintain access to high-value European markets.
  • In March 2025, the Costa Group initiated a landmark blueberry development project in Laos, establishing seventeen hectares of cultivation with the intent to expand to two hundred hectares, signaling a strategic move to leverage local climate conditions for the burgeoning Asian consumer base.
  • In March 2025, Brazil formally approved the importation of strawberries from South Korea, representing the first agreement of its kind within the South American continent and granting consumers access to premium varieties.
  • In January 2025, the United Kingdom implemented a critical regulatory change by reclassifying strawberries from the European Union as low-risk imports, removing the requirement for phytosanitary certificates and physical checks, which has significantly enhanced the competitiveness of European growers within the British market.

Dive into Technavio’s robust research methodology, blending expert interviews, extensive data synthesis, and validated models for unparalleled Berries Market insights. See full methodology.

Market Scope
Page number 298
Base year 2025
Historic period 2020-2024
Forecast period 2026-2030
Growth momentum & CAGR Accelerate at a CAGR of 6.7%
Market growth 2026-2030 USD 14570.4 million
Market structure Fragmented
YoY growth 2025-2026(%) 6.2%
Key countries Germany, UK, Spain, France, Italy, The Netherlands, US, Canada, Mexico, China, Japan, India, South Korea, Australia, Indonesia, Brazil, Argentina, Chile, Saudi Arabia, UAE, South Africa, Israel and Turkey
Competitive landscape Leading Companies, Market Positioning of Companies, Competitive Strategies, and Industry Risks

Request Free Sample

Research Analyst Overview

  • The berries market has matured into a highly technical sector where varietal innovation and a premiumization strategy dictate success. The deployment of proprietary genetics is central to developing fruits that meet stringent food safety standards and offer extended shelf-life extension, which is critical for minimizing post-harvest waste reduction.
  • Leading producers are investing in protected cropping systems, including high-density tunnel cultivation and advanced hydroponic systems, to ensure a consistent, high-quality supply. These capital-intensive methods are increasingly paired with mechanical harvesting solutions and robotic harvesting technology to mitigate labor shortages.
  • For boardroom consideration, the adoption of comprehensive traceability systems is no longer optional; it directly impacts brand reputation and market access, with integrated platforms improving recall management efficiency by over 40%.
  • The entire value chain, from sustainable farming practices and integrated pest management to sophisticated cold chain logistics and the development of clean-label ingredients, is geared toward delivering premium, safe, and transparent products to a discerning global consumer base.

What are the Key Data Covered in this Berries Market Research and Growth Report?

  • What is the expected growth of the Berries Market between 2026 and 2030?

    • USD 14.57 billion, at a CAGR of 6.7%

  • What segmentation does the market report cover?

    • The report is segmented by Application (Food and beverages, Personal care, and Others), Type (Strawberries, Blueberries, Raspberries, and Others), Distribution Channel (Offline, and Online) and Geography (Europe, North America, APAC, South America, Middle East and Africa)

  • Which regions are analyzed in the report?

    • Europe, North America, APAC, South America and Middle East and Africa

  • What are the key growth drivers and market challenges?

    • Growing awareness and promotion of benefits of consuming berries, Fluctuations in berry prices due to unfavorable weather conditions

  • Who are the major players in the Berries Market?

    • AGRANA Beteiligungs AG, Arctic Flavors, Ardo NV, BerryWorld Group, Betec, California Giant Inc, Coast Berry Co. Ltd., Dole plc, Driscolls Inc., Earthbound Farm, Family Tree Farms, Haygrove Ltd., Hortifrut SA, Jones Family Farms, Joy Wing Mau Group, Kenburn Orchards, MBG Marketing, Naturipe Farms LLC, Rainier Fruit Co. and World Variety Produce Inc.

Market Research Insights

  • Market dynamics are shaped by a strategic focus on year-round supply chain management, balancing domestic production with counter-seasonal imports to stabilize availability. This approach has led to a 10% improvement in retail inventory management efficiency.
  • The rise of direct-to-consumer platforms is also reshaping distribution, allowing for better quality assurance protocols and strengthening private-label branding, which now accounts for a significant portion of sales in developed markets. Concurrently, the expansion of cosmeceutical applications and nutraceutical ingredient sourcing is creating new high-value revenue streams.
  • For instance, the adoption rate for berry-derived extracts in new skincare formulations has increased by over 25% in the last two years, reflecting a broader consumer shift toward natural ingredients.

We can help! Our analysts can customize this berries market research report to meet your requirements.

Get in touch

1. Executive Summary

1.1 Market overview

Executive Summary - Chart on Market Overview
Executive Summary - Data Table on Market Overview
Executive Summary - Chart on Global Market Characteristics
Executive Summary - Chart on Market by Geography
Executive Summary - Chart on Market Segmentation by Application
Executive Summary - Chart on Market Segmentation by Type
Executive Summary - Chart on Market Segmentation by Distribution Channel
Executive Summary - Chart on Incremental Growth
Executive Summary - Data Table on Incremental Growth
Executive Summary - Chart on Company Market Positioning

2. Technavio Analysis

2.1 Analysis of price sensitivity, lifecycle, customer purchase basket, adoption rates, and purchase criteria

2.2 Criticality of inputs and Factors of differentiation

Chart on Overview on criticality of inputs and factors of differentiation

2.3 Factors of disruption

Chart on Overview on factors of disruption

2.4 Impact of drivers and challenges

Chart on Impact of drivers and challenges in 2025 and 2030

3. Market Landscape

3.1 Market ecosystem

Chart on Parent Market
Data Table on - Parent Market

3.2 Market characteristics

Chart on Market characteristics analysis

3.3 Value chain analysis

Chart on Value chain analysis

4. Market Sizing

4.1 Market definition

Data Table on Offerings of companies included in the market definition

4.2 Market segment analysis

Market segments

4.3 Market size 2025

4.4 Market outlook: Forecast for 2025-2030

Chart on Global - Market size and forecast 2025-2030 ($ million)
Data Table on Global - Market size and forecast 2025-2030 ($ million)
Chart on Global Market: Year-over-year growth 2025-2030 (%)
Data Table on Global Market: Year-over-year growth 2025-2030 (%)

5. Historic Market Size

5.1 Global Berries Market 2020 - 2024

Historic Market Size - Data Table on Global Berries Market 2020 - 2024 ($ million)

5.2 Application segment analysis 2020 - 2024

Historic Market Size - Application Segment 2020 - 2024 ($ million)

5.3 Type segment analysis 2020 - 2024

Historic Market Size - Type Segment 2020 - 2024 ($ million)

5.4 Distribution Channel segment analysis 2020 - 2024

Historic Market Size - Distribution Channel Segment 2020 - 2024 ($ million)

5.5 Geography segment analysis 2020 - 2024

Historic Market Size - Geography Segment 2020 - 2024 ($ million)

5.6 Country segment analysis 2020 - 2024

Historic Market Size - Country Segment 2020 - 2024 ($ million)

6. Qualitative Analysis

6.1 The AI impact on Global Berries Market

6.2 Impact of Geopolitical Conflicts on Global Berries Market

7. Five Forces Analysis

7.1 Five forces summary

Five forces analysis - Comparison between 2025 and 2030

7.2 Bargaining power of buyers

Bargaining power of buyers - Impact of key factors 2025 and 2030

7.3 Bargaining power of suppliers

Bargaining power of suppliers - Impact of key factors in 2025 and 2030

7.4 Threat of new entrants

Threat of new entrants - Impact of key factors in 2025 and 2030

7.5 Threat of substitutes

Threat of substitutes - Impact of key factors in 2025 and 2030

7.6 Threat of rivalry

Threat of rivalry - Impact of key factors in 2025 and 2030

7.7 Market condition

Chart on Market condition - Five forces 2025 and 2030

8. Market Segmentation by Application

8.1 Market segments

Chart on Application - Market share 2025-2030 (%)
Data Table on Application - Market share 2025-2030 (%)

8.2 Comparison by Application

Chart on Comparison by Application
Data Table on Comparison by Application

8.3 Food and beverages - Market size and forecast 2025-2030

Chart on Food and beverages - Market size and forecast 2025-2030 ($ million)
Data Table on Food and beverages - Market size and forecast 2025-2030 ($ million)
Chart on Food and beverages - Year-over-year growth 2025-2030 (%)
Data Table on Food and beverages - Year-over-year growth 2025-2030 (%)

8.4 Personal care - Market size and forecast 2025-2030

Chart on Personal care - Market size and forecast 2025-2030 ($ million)
Data Table on Personal care - Market size and forecast 2025-2030 ($ million)
Chart on Personal care - Year-over-year growth 2025-2030 (%)
Data Table on Personal care - Year-over-year growth 2025-2030 (%)

8.5 Others - Market size and forecast 2025-2030

Chart on Others - Market size and forecast 2025-2030 ($ million)
Data Table on Others - Market size and forecast 2025-2030 ($ million)
Chart on Others - Year-over-year growth 2025-2030 (%)
Data Table on Others - Year-over-year growth 2025-2030 (%)

8.6 Market opportunity by Application

Market opportunity by Application ($ million)
Data Table on Market opportunity by Application ($ million)

9. Market Segmentation by Type

9.1 Market segments

Chart on Type - Market share 2025-2030 (%)
Data Table on Type - Market share 2025-2030 (%)

9.2 Comparison by Type

Chart on Comparison by Type
Data Table on Comparison by Type

9.3 Strawberries - Market size and forecast 2025-2030

Chart on Strawberries - Market size and forecast 2025-2030 ($ million)
Data Table on Strawberries - Market size and forecast 2025-2030 ($ million)
Chart on Strawberries - Year-over-year growth 2025-2030 (%)
Data Table on Strawberries - Year-over-year growth 2025-2030 (%)

9.4 Blueberries - Market size and forecast 2025-2030

Chart on Blueberries - Market size and forecast 2025-2030 ($ million)
Data Table on Blueberries - Market size and forecast 2025-2030 ($ million)
Chart on Blueberries - Year-over-year growth 2025-2030 (%)
Data Table on Blueberries - Year-over-year growth 2025-2030 (%)

9.5 Raspberries - Market size and forecast 2025-2030

Chart on Raspberries - Market size and forecast 2025-2030 ($ million)
Data Table on Raspberries - Market size and forecast 2025-2030 ($ million)
Chart on Raspberries - Year-over-year growth 2025-2030 (%)
Data Table on Raspberries - Year-over-year growth 2025-2030 (%)

9.6 Others - Market size and forecast 2025-2030

Chart on Others - Market size and forecast 2025-2030 ($ million)
Data Table on Others - Market size and forecast 2025-2030 ($ million)
Chart on Others - Year-over-year growth 2025-2030 (%)
Data Table on Others - Year-over-year growth 2025-2030 (%)

9.7 Market opportunity by Type

Market opportunity by Type ($ million)
Data Table on Market opportunity by Type ($ million)

10. Market Segmentation by Distribution Channel

10.1 Market segments

Chart on Distribution Channel - Market share 2025-2030 (%)
Data Table on Distribution Channel - Market share 2025-2030 (%)

10.2 Comparison by Distribution Channel

Chart on Comparison by Distribution Channel
Data Table on Comparison by Distribution Channel

10.3 Offline - Market size and forecast 2025-2030

Chart on Offline - Market size and forecast 2025-2030 ($ million)
Data Table on Offline - Market size and forecast 2025-2030 ($ million)
Chart on Offline - Year-over-year growth 2025-2030 (%)
Data Table on Offline - Year-over-year growth 2025-2030 (%)

10.4 Online - Market size and forecast 2025-2030

Chart on Online - Market size and forecast 2025-2030 ($ million)
Data Table on Online - Market size and forecast 2025-2030 ($ million)
Chart on Online - Year-over-year growth 2025-2030 (%)
Data Table on Online - Year-over-year growth 2025-2030 (%)

10.5 Market opportunity by Distribution Channel

Market opportunity by Distribution Channel ($ million)
Data Table on Market opportunity by Distribution Channel ($ million)

11. Customer Landscape

11.1 Customer landscape overview

Analysis of price sensitivity, lifecycle, customer purchase basket, adoption rates, and purchase criteria

12. Geographic Landscape

12.1 Geographic segmentation

Chart on Market share by geography 2025-2030 (%)
Data Table on Market share by geography 2025-2030 (%)

12.2 Geographic comparison

Chart on Geographic comparison
Data Table on Geographic comparison

12.3 Europe - Market size and forecast 2025-2030

Chart on Europe - Market size and forecast 2025-2030 ($ million)
Data Table on Europe - Market size and forecast 2025-2030 ($ million)
Chart on Europe - Year-over-year growth 2025-2030 (%)
Data Table on Europe - Year-over-year growth 2025-2030 (%)
Chart on Regional Comparison - Europe
Data Table on Regional Comparison - Europe

12.3.1 Germany - Market size and forecast 2025-2030

Chart on Germany - Market size and forecast 2025-2030 ($ million)
Data Table on Germany - Market size and forecast 2025-2030 ($ million)
Chart on Germany - Year-over-year growth 2025-2030 (%)
Data Table on Germany - Year-over-year growth 2025-2030 (%)

12.3.2 UK - Market size and forecast 2025-2030

Chart on UK - Market size and forecast 2025-2030 ($ million)
Data Table on UK - Market size and forecast 2025-2030 ($ million)
Chart on UK - Year-over-year growth 2025-2030 (%)
Data Table on UK - Year-over-year growth 2025-2030 (%)

12.3.3 Spain - Market size and forecast 2025-2030

Chart on Spain - Market size and forecast 2025-2030 ($ million)
Data Table on Spain - Market size and forecast 2025-2030 ($ million)
Chart on Spain - Year-over-year growth 2025-2030 (%)
Data Table on Spain - Year-over-year growth 2025-2030 (%)

12.3.4 France - Market size and forecast 2025-2030

Chart on France - Market size and forecast 2025-2030 ($ million)
Data Table on France - Market size and forecast 2025-2030 ($ million)
Chart on France - Year-over-year growth 2025-2030 (%)
Data Table on France - Year-over-year growth 2025-2030 (%)

12.3.5 Italy - Market size and forecast 2025-2030

Chart on Italy - Market size and forecast 2025-2030 ($ million)
Data Table on Italy - Market size and forecast 2025-2030 ($ million)
Chart on Italy - Year-over-year growth 2025-2030 (%)
Data Table on Italy - Year-over-year growth 2025-2030 (%)

12.3.6 The Netherlands - Market size and forecast 2025-2030

Chart on The Netherlands - Market size and forecast 2025-2030 ($ million)
Data Table on The Netherlands - Market size and forecast 2025-2030 ($ million)
Chart on The Netherlands - Year-over-year growth 2025-2030 (%)
Data Table on The Netherlands - Year-over-year growth 2025-2030 (%)

12.4 North America - Market size and forecast 2025-2030

Chart on North America - Market size and forecast 2025-2030 ($ million)
Data Table on North America - Market size and forecast 2025-2030 ($ million)
Chart on North America - Year-over-year growth 2025-2030 (%)
Data Table on North America - Year-over-year growth 2025-2030 (%)
Chart on Regional Comparison - North America
Data Table on Regional Comparison - North America

12.4.1 US - Market size and forecast 2025-2030

Chart on US - Market size and forecast 2025-2030 ($ million)
Data Table on US - Market size and forecast 2025-2030 ($ million)
Chart on US - Year-over-year growth 2025-2030 (%)
Data Table on US - Year-over-year growth 2025-2030 (%)

12.4.2 Canada - Market size and forecast 2025-2030

Chart on Canada - Market size and forecast 2025-2030 ($ million)
Data Table on Canada - Market size and forecast 2025-2030 ($ million)
Chart on Canada - Year-over-year growth 2025-2030 (%)
Data Table on Canada - Year-over-year growth 2025-2030 (%)

12.4.3 Mexico - Market size and forecast 2025-2030

Chart on Mexico - Market size and forecast 2025-2030 ($ million)
Data Table on Mexico - Market size and forecast 2025-2030 ($ million)
Chart on Mexico - Year-over-year growth 2025-2030 (%)
Data Table on Mexico - Year-over-year growth 2025-2030 (%)

12.5 APAC - Market size and forecast 2025-2030

Chart on APAC - Market size and forecast 2025-2030 ($ million)
Data Table on APAC - Market size and forecast 2025-2030 ($ million)
Chart on APAC - Year-over-year growth 2025-2030 (%)
Data Table on APAC - Year-over-year growth 2025-2030 (%)
Chart on Regional Comparison - APAC
Data Table on Regional Comparison - APAC

12.5.1 China - Market size and forecast 2025-2030

Chart on China - Market size and forecast 2025-2030 ($ million)
Data Table on China - Market size and forecast 2025-2030 ($ million)
Chart on China - Year-over-year growth 2025-2030 (%)
Data Table on China - Year-over-year growth 2025-2030 (%)

12.5.2 Japan - Market size and forecast 2025-2030

Chart on Japan - Market size and forecast 2025-2030 ($ million)
Data Table on Japan - Market size and forecast 2025-2030 ($ million)
Chart on Japan - Year-over-year growth 2025-2030 (%)
Data Table on Japan - Year-over-year growth 2025-2030 (%)

12.5.3 India - Market size and forecast 2025-2030

Chart on India - Market size and forecast 2025-2030 ($ million)
Data Table on India - Market size and forecast 2025-2030 ($ million)
Chart on India - Year-over-year growth 2025-2030 (%)
Data Table on India - Year-over-year growth 2025-2030 (%)

12.5.4 South Korea - Market size and forecast 2025-2030

Chart on South Korea - Market size and forecast 2025-2030 ($ million)
Data Table on South Korea - Market size and forecast 2025-2030 ($ million)
Chart on South Korea - Year-over-year growth 2025-2030 (%)
Data Table on South Korea - Year-over-year growth 2025-2030 (%)

12.5.5 Australia - Market size and forecast 2025-2030

Chart on Australia - Market size and forecast 2025-2030 ($ million)
Data Table on Australia - Market size and forecast 2025-2030 ($ million)
Chart on Australia - Year-over-year growth 2025-2030 (%)
Data Table on Australia - Year-over-year growth 2025-2030 (%)

12.5.6 Indonesia - Market size and forecast 2025-2030

Chart on Indonesia - Market size and forecast 2025-2030 ($ million)
Data Table on Indonesia - Market size and forecast 2025-2030 ($ million)
Chart on Indonesia - Year-over-year growth 2025-2030 (%)
Data Table on Indonesia - Year-over-year growth 2025-2030 (%)

12.6 South America - Market size and forecast 2025-2030

Chart on South America - Market size and forecast 2025-2030 ($ million)
Data Table on South America - Market size and forecast 2025-2030 ($ million)
Chart on South America - Year-over-year growth 2025-2030 (%)
Data Table on South America - Year-over-year growth 2025-2030 (%)
Chart on Regional Comparison - South America
Data Table on Regional Comparison - South America

12.6.1 Brazil - Market size and forecast 2025-2030

Chart on Brazil - Market size and forecast 2025-2030 ($ million)
Data Table on Brazil - Market size and forecast 2025-2030 ($ million)
Chart on Brazil - Year-over-year growth 2025-2030 (%)
Data Table on Brazil - Year-over-year growth 2025-2030 (%)

12.6.2 Argentina - Market size and forecast 2025-2030

Chart on Argentina - Market size and forecast 2025-2030 ($ million)
Data Table on Argentina - Market size and forecast 2025-2030 ($ million)
Chart on Argentina - Year-over-year growth 2025-2030 (%)
Data Table on Argentina - Year-over-year growth 2025-2030 (%)

12.6.3 Chile - Market size and forecast 2025-2030

Chart on Chile - Market size and forecast 2025-2030 ($ million)
Data Table on Chile - Market size and forecast 2025-2030 ($ million)
Chart on Chile - Year-over-year growth 2025-2030 (%)
Data Table on Chile - Year-over-year growth 2025-2030 (%)

12.7 Middle East and Africa - Market size and forecast 2025-2030

Chart on Middle East and Africa - Market size and forecast 2025-2030 ($ million)
Data Table on Middle East and Africa - Market size and forecast 2025-2030 ($ million)
Chart on Middle East and Africa - Year-over-year growth 2025-2030 (%)
Data Table on Middle East and Africa - Year-over-year growth 2025-2030 (%)
Chart on Regional Comparison - Middle East and Africa
Data Table on Regional Comparison - Middle East and Africa

12.7.1 Saudi Arabia - Market size and forecast 2025-2030

Chart on Saudi Arabia - Market size and forecast 2025-2030 ($ million)
Data Table on Saudi Arabia - Market size and forecast 2025-2030 ($ million)
Chart on Saudi Arabia - Year-over-year growth 2025-2030 (%)
Data Table on Saudi Arabia - Year-over-year growth 2025-2030 (%)

12.7.2 UAE - Market size and forecast 2025-2030

Chart on UAE - Market size and forecast 2025-2030 ($ million)
Data Table on UAE - Market size and forecast 2025-2030 ($ million)
Chart on UAE - Year-over-year growth 2025-2030 (%)
Data Table on UAE - Year-over-year growth 2025-2030 (%)

12.7.3 South Africa - Market size and forecast 2025-2030

Chart on South Africa - Market size and forecast 2025-2030 ($ million)
Data Table on South Africa - Market size and forecast 2025-2030 ($ million)
Chart on South Africa - Year-over-year growth 2025-2030 (%)
Data Table on South Africa - Year-over-year growth 2025-2030 (%)

12.7.4 Israel - Market size and forecast 2025-2030

Chart on Israel - Market size and forecast 2025-2030 ($ million)
Data Table on Israel - Market size and forecast 2025-2030 ($ million)
Chart on Israel - Year-over-year growth 2025-2030 (%)
Data Table on Israel - Year-over-year growth 2025-2030 (%)

12.7.5 Turkey - Market size and forecast 2025-2030

Chart on Turkey - Market size and forecast 2025-2030 ($ million)
Data Table on Turkey - Market size and forecast 2025-2030 ($ million)
Chart on Turkey - Year-over-year growth 2025-2030 (%)
Data Table on Turkey - Year-over-year growth 2025-2030 (%)

12.8 Market opportunity by geography

Market opportunity by geography ($ million)
Data Tables on Market opportunity by geography ($ million)

13. Drivers, Challenges, and Opportunity

13.1 Market drivers

Growing awareness and promotion of benefits of consuming berries
Growing popularity of plant‑based diets
Expansion of functional food products

13.2 Market challenges

Fluctuations in berry prices due to unfavorable weather conditions
Increased use of chemicals while farming and contamination risks while packaging
Increasing product recalls due to contamination

13.3 Impact of drivers and challenges

Impact of drivers and challenges in 2025 and 2030

13.4 Market opportunities

Increasing prominence of private-label brands
Higher consumer focus on antioxidants
Rapid growth of organic berry farming

14. Competitive Landscape

14.1 Overview

14.2

Overview on criticality of inputs and factors of differentiation

14.3 Landscape disruption

Overview on factors of disruption

14.4 Industry risks

Impact of key risks on business

15. Competitive Analysis

15.1 Companies profiled

Companies covered

15.2 Company ranking index

15.3 Market positioning of companies

Matrix on companies position and classification

15.4 AGRANA Beteiligungs AG

AGRANA Beteiligungs AG - Overview
AGRANA Beteiligungs AG - Business segments
AGRANA Beteiligungs AG - Key news
AGRANA Beteiligungs AG - Key offerings
AGRANA Beteiligungs AG - Segment focus
SWOT

15.5 Arctic Flavors

Arctic Flavors - Overview
Arctic Flavors - Product / Service
Arctic Flavors - Key offerings
SWOT

15.6 Ardo NV

Ardo NV - Overview
Ardo NV - Product / Service
Ardo NV - Key offerings
SWOT

15.7 BerryWorld Group

BerryWorld Group - Overview
BerryWorld Group - Product / Service
BerryWorld Group - Key offerings
SWOT

15.8 California Giant Inc

California Giant Inc - Overview
California Giant Inc - Product / Service
California Giant Inc - Key offerings
SWOT

15.9 Dole plc

Dole plc - Overview
Dole plc - Business segments
Dole plc - Key offerings
Dole plc - Segment focus
SWOT

15.10 Driscolls Inc.

Driscolls Inc. - Overview
Driscolls Inc. - Product / Service
Driscolls Inc. - Key offerings
SWOT

15.11 Earthbound Farm

Earthbound Farm - Overview
Earthbound Farm - Product / Service
Earthbound Farm - Key offerings
SWOT

15.12 Family Tree Farms

Family Tree Farms - Overview
Family Tree Farms - Product / Service
Family Tree Farms - Key offerings
SWOT

15.13 Haygrove Ltd.

Haygrove Ltd. - Overview
Haygrove Ltd. - Product / Service
Haygrove Ltd. - Key offerings
SWOT

15.14 Hortifrut SA

Hortifrut SA - Overview
Hortifrut SA - Product / Service
Hortifrut SA - Key offerings
SWOT

15.15 Jones Family Farms

Jones Family Farms - Overview
Jones Family Farms - Product / Service
Jones Family Farms - Key offerings
SWOT

15.16 Joy Wing Mau Group

Joy Wing Mau Group - Overview
Joy Wing Mau Group - Product / Service
Joy Wing Mau Group - Key offerings
SWOT

15.17 Naturipe Farms LLC

Naturipe Farms LLC - Overview
Naturipe Farms LLC - Product / Service
Naturipe Farms LLC - Key offerings
SWOT

15.18 World Variety Produce Inc.

World Variety Produce Inc. - Overview
World Variety Produce Inc. - Product / Service
World Variety Produce Inc. - Key offerings
SWOT

16. Appendix

16.1 Scope of the report

Market definition
Objectives
Notes and caveats

16.2 Inclusions and exclusions checklist

Inclusions checklist
Exclusions checklist

16.3 Currency conversion rates for US$

16.4 Research methodology

16.5 Data procurement

Information sources

16.6 Data validation

16.7 Validation techniques employed for market sizing

16.8 Data synthesis

16.9 360 degree market analysis

16.10 List of abbreviations

Research Methodology

Technavio presents a detailed picture of the market by way of study, synthesis, and summation of data from multiple sources. The analysts have presented the various facets of the market with a particular focus on identifying the key industry influencers. The data thus presented is comprehensive, reliable, and the result of extensive research, both primary and secondary.

INFORMATION SOURCES

Primary sources

  • Manufacturers and suppliers
  • Channel partners
  • Industry experts
  • Strategic decision makers

Secondary sources

  • Industry journals and periodicals
  • Government data
  • Financial reports of key industry players
  • Historical data
  • Press releases

DATA ANALYSIS

Data Synthesis

  • Collation of data
  • Estimation of key figures
  • Analysis of derived insights

Data Validation

  • Triangulation with data models
  • Reference against proprietary databases
  • Corroboration with industry experts

REPORT WRITING

Qualitative

  • Market drivers
  • Market challenges
  • Market trends
  • Five forces analysis

Quantitative

  • Market size and forecast
  • Market segmentation
  • Geographical insights
  • Competitive landscape

Interested in this report?

Get your sample now to see our research methodology and insights!

Download Now

Frequently Asked Questions

Berries market growth will increase by USD 14570.4 million during 2026-2030.

The Berries market is expected to grow at a CAGR of 6.7% during 2026-2030.

Berries market is segmented by Application (Food and beverages, Personal care, Others) Type (Strawberries, Blueberries, Raspberries, Others) Distribution channel (Offline, Online)

AGRANA Beteiligungs AG, Arctic Flavors, Ardo NV, BerryWorld Group, Betec, California Giant Inc, Coast Berry Co. Ltd., Dole plc, Driscolls Inc., Earthbound Farm, Family Tree Farms, Haygrove Ltd., Hortifrut SA, Jones Family Farms, Joy Wing Mau Group, Kenburn Orchards, MBG Marketing, Naturipe Farms LLC, Rainier Fruit Co., World Variety Produce Inc. are a few of the key vendors in the Berries market.

Europe will register the highest growth rate of 43.2% among the other regions. Therefore, the Berries market in Europe is expected to garner significant business opportunities for the vendors during the forecast period.

Germany, UK, Spain, France, Italy, The Netherlands, US, Canada, Mexico, China, Japan, India, South Korea, Australia, Indonesia, Brazil, Argentina, Chile, Saudi Arabia, UAE, South Africa, Israel, Turkey

  • Growing awareness and promotion of benefits of consuming berries is the driving factor this market.

The Berries market vendors should focus on grabbing business opportunities from the Application segment as it accounted for the largest market share in the base year.
RIA - Research AI Assistant
Ask RIA