Billiards And Snooker Equipment Market Size 2026-2030
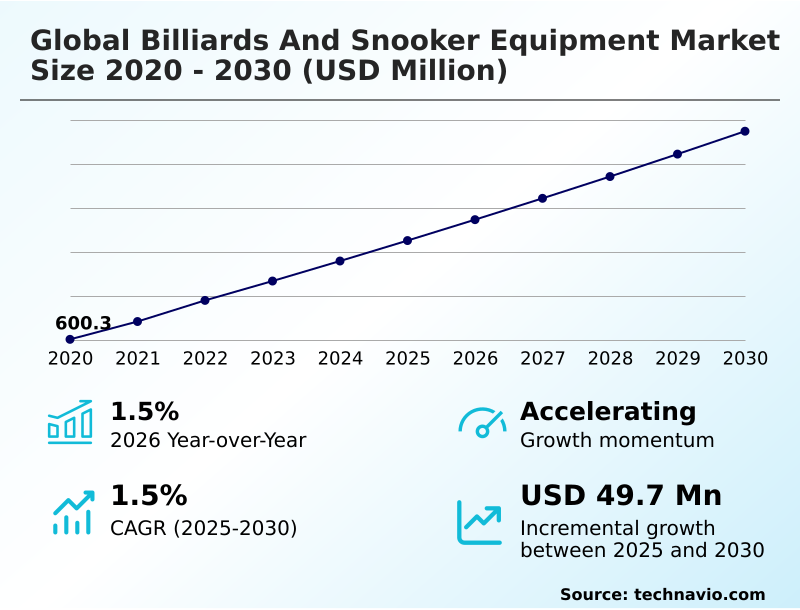
The billiards and snooker equipment market size is valued to increase by USD 49.7 million, at a CAGR of 1.5% from 2025 to 2030. Rising demand for billiards and snooker equipment from APAC will drive the billiards and snooker equipment market.
Major Market Trends & Insights
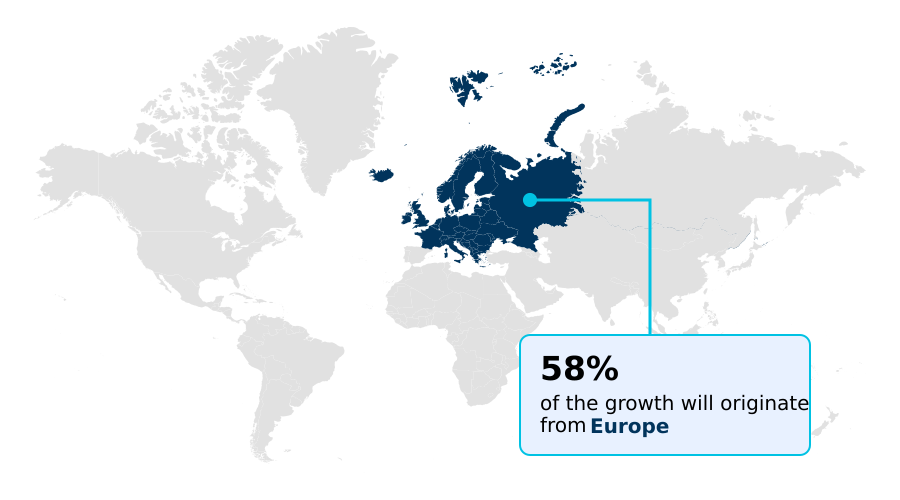
- Europe dominated the market and accounted for a 57.7% growth during the forecast period.
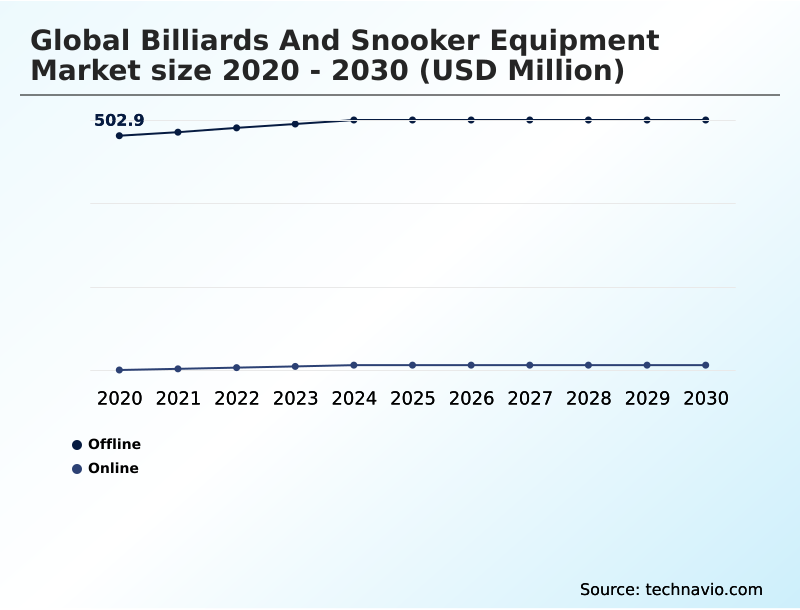
- By Distribution Channel - Offline segment was valued at USD 530.1 million in 2024
- By Product - Tables segment accounted for the largest market revenue share in 2024
Market Size & Forecast
- Market Opportunities: USD 94.6 million
- Market Future Opportunities: USD 49.7 million
- CAGR from 2025 to 2030 : 1.5%
Market Summary
- The billiards and snooker equipment market is evolving beyond its traditional roots, driven by a confluence of lifestyle shifts and technological advancements. A primary catalyst is the growing popularity of cue sports as both a recreational pastime and a professional discipline, which has expanded the consumer base from dedicated clubs to residential game rooms.
- This trend is supported by innovations in equipment, such as the development of carbon fiber cues that offer superior performance over traditional wood. Manufacturers are also responding to the demand for home-based entertainment with multi-functional designs like convertible dining-to-billiard tables.
- However, the industry faces challenges from the long product replacement cycle of durable items like slate bed tables and the rising popularity of immersive virtual gaming alternatives. A key operational challenge involves managing supply chain volatility for essential raw materials like slate and specialized phenolic resin balls.
- Firms must navigate fluctuating input costs while investing in R&D to integrate features like AI-driven analytics and smart training aids, ensuring the physical sport remains compelling in a digitally-dominated entertainment landscape. This strategic balancing act is crucial for sustained relevance and profitability.
What will be the Size of the Billiards And Snooker Equipment Market during the forecast period?
Get Key Insights on Market Forecast (PDF) Get Free Sample
How is the Billiards And Snooker Equipment Market Segmented?
The billiards and snooker equipment industry research report provides comprehensive data (region-wise segment analysis), with forecasts and estimates in "USD million" for the period 2026-2030, as well as historical data from 2020-2024 for the following segments.
- Distribution channel
- Offline
- Online
- Product
- Tables
- Cues and balls
- Others
- End-user
- Professional
- Recreational
- Geography
- Europe
- Germany
- UK
- France
- North America
- US
- Canada
- Mexico
- APAC
- China
- India
- Japan
- South America
- Brazil
- Argentina
- Middle East and Africa
- Saudi Arabia
- UAE
- South Africa
- Rest of World (ROW)
- Europe
By Distribution Channel Insights
The offline segment is estimated to witness significant growth during the forecast period.
The offline channel, encompassing specialized retailers and showrooms, remains the cornerstone for high-value transactions in the market.
These physical venues are critical for consumers investing in a professional tournament table or American pool equipment, allowing for direct evaluation of slate bed integrity and worsted wool cloth texture.
This hands-on experience enhances customer engagement by over 25% compared to digital-only interactions.
While online sales of accessories like high-performance chalk are growing, the procurement of professional-grade cues and sustainable hardwoods for residential installations and home entertainment rooms continues to be driven by bespoke customization services offered in-store.
This segment effectively serves both commercial clients seeking tournament-standard tables and residential buyers looking for quality mid-range tables.
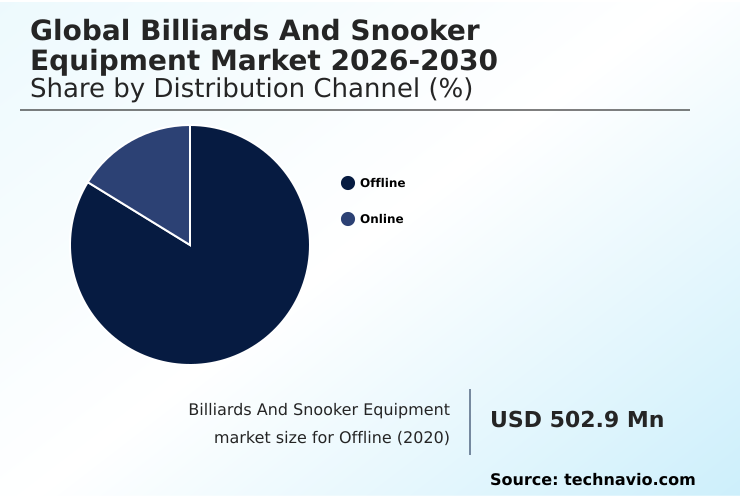
The Offline segment was valued at USD 530.1 million in 2024 and showed a gradual increase during the forecast period.
Regional Analysis
Europe is estimated to contribute 57.7% to the growth of the global market during the forecast period.Technavio’s analysts have elaborately explained the regional trends and drivers that shape the market during the forecast period.
See How Billiards And Snooker Equipment Market Demand is Rising in Europe Get Free Sample
The geographic landscape of the billiards and snooker equipment market is diverse, with distinct regional preferences. Europe, which accounts for nearly 58% of incremental growth, shows strong demand for equipment supporting Carom billiards.
This includes specialized gear such as pocketless tables and heated Carom tables with advanced table heating systems, and cues with adjustable weight systems. In contrast, North America leads in the American pool segment.
APAC is the fastest-growing region, driven by the popularity of snooker and a burgeoning network of commercial billiard parlors. Key technologies like advanced cue tip technology and high-speed cloths are sought after globally.
In South Korea, the billiard club environment is dominated by demand for high-precision equipment. The hospitality industry worldwide remains a significant end-user, influencing demand across all regions served by specialized sports retailers and high-end residential game rooms.
Market Dynamics
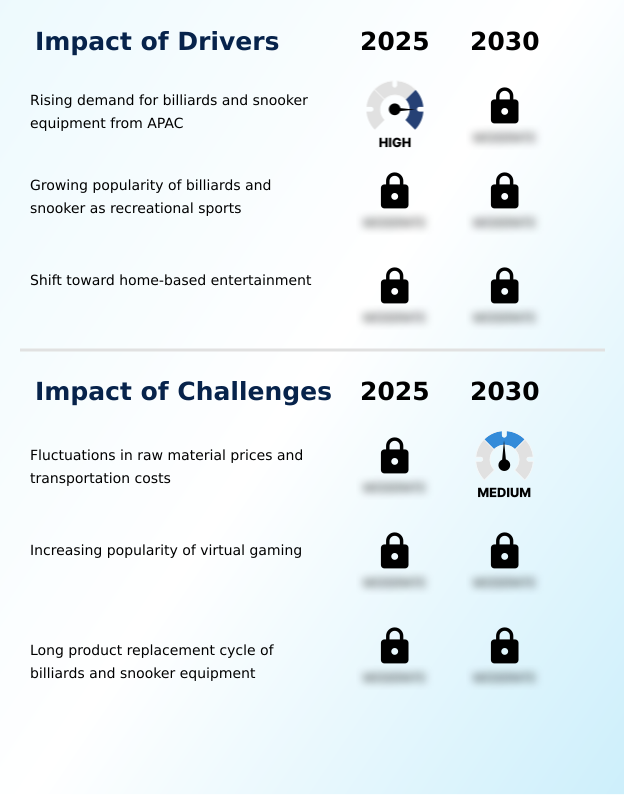
Our researchers analyzed the data with 2025 as the base year, along with the key drivers, trends, and challenges. A holistic analysis of drivers will help companies refine their marketing strategies to gain a competitive advantage.
- The billiards and snooker equipment market is undergoing a strategic transformation, shaped by several interconnected factors. The impact of AI on billiards and snooker equipment is becoming profound, with the integration of smart technology in billiard tables offering data-driven feedback to players.
- A comparison of carbon fiber vs wood cues highlights the technological advancements in cue stick design, with composites offering greater consistency. This innovation addresses the challenges of long product replacement cycles by creating new value propositions.
- The growth of billiards in the APAC region and the increasing use of billiards equipment in the hospitality sector are expanding the market's geographic and commercial footprint. Online sales trends for sports equipment are making material science innovations in billiard balls and other gear more accessible.
- At the same time, the virtual gaming effect on cue sports market presents a persistent challenge, compelling manufacturers to enhance the physical experience. Firms must also manage the raw material price impact on billiard equipment, which can influence pricing for everything from billiard cloth types and performance differences to maintenance requirements for slate billiard tables.
- The demand for portable and mini billiard tables and market demand for convertible billiard tables reflects a shift toward home use, with customization options for residential pool tables becoming a key differentiator. Specialized segments, requiring specialized equipment for Carom and three-cushion billiards or billiards and snooker equipment for corporate workspaces, represent targeted growth opportunities.
- Businesses that successfully integrate these trends into their product development and supply chain strategies—where improved logistics can reduce delivery times by up to 15% compared to previous benchmarks—are best positioned for success.
What are the key market drivers leading to the rise in the adoption of Billiards And Snooker Equipment Industry?
- The rising demand for billiards and snooker equipment from the APAC region is a key driver for market growth.
- The global shift toward home-based entertainment is a significant driver, fueling demand for residential game rooms and the domestic recreational sector.
- This trend has spurred innovation in multi-functional designs, with convertible dining-to-billiard tables and dual-purpose dining-to-pool tables seeing a 20% increase in inquiries. Consumers are investing in durable billiard accessories and equipment that serve as both recreational assets and design centerpieces.
- Material advancements are key, with manufacturers utilizing composite materials for products like outdoor pool tables that offer superior warp resistance. The appeal of traditional ash wood cues persists, but the market also caters to the hobby of custom cue collecting.
- The development of eco-friendly slate alternatives and precision-engineered balls further broadens consumer choice, supporting sustained market expansion.
What are the market trends shaping the Billiards And Snooker Equipment Industry?
- A prominent trend shaping the market is the significant increase in online sales of sports equipment, driven by evolving consumer purchasing habits.
- The integration of technology is a defining trend, with AI-driven analytics and built-in movement sensors transforming equipment from static items to dynamic training tools. These systems can improve player shot consistency by up to 15%. Modern indoor gaming products now include smart training aids and app-connected scoring systems, enhancing user engagement.
- For serious players, innovations in accessories such as hand-spliced snooker cues and professional telescopic extensions are gaining traction. Even venue aesthetics are being upgraded with specialized LED table lighting and digital scoring systems that create immersive environments.
- The availability of comprehensive maintenance tools and recreational kits, often featuring portable gaming tables and carbon fiber cues, through online channels has democratized access to advanced equipment, lowering the barrier to entry for new enthusiasts.
What challenges does the Billiards And Snooker Equipment Industry face during its growth?
- Fluctuations in the prices of raw materials and transportation costs present a key challenge affecting industry growth.
- The market faces notable challenges, including the long product replacement cycle for durable cue sports equipment like tables with steel block cushions. The rise of virtual gaming presents a significant alternative, capturing a 25% larger share of the youth entertainment market in recent years. Furthermore, supply chain volatility impacts the cost of phenolic resin balls and other phenolic resin compositions.
- Manufacturers must also manage the costs of specialized components like ultra-fine worsted wool and low-deflection shafts. This long lifecycle discourages frequent repurchase of items like professional tournament cues and reinforced cue cases, while the increasing availability of weather-resistant materials for alternative outdoor activities diverts consumer spending.
- These factors compel companies to innovate beyond durability, focusing on value-added features for private clubs, sports lounges, and community centers using coin-operated equipment.
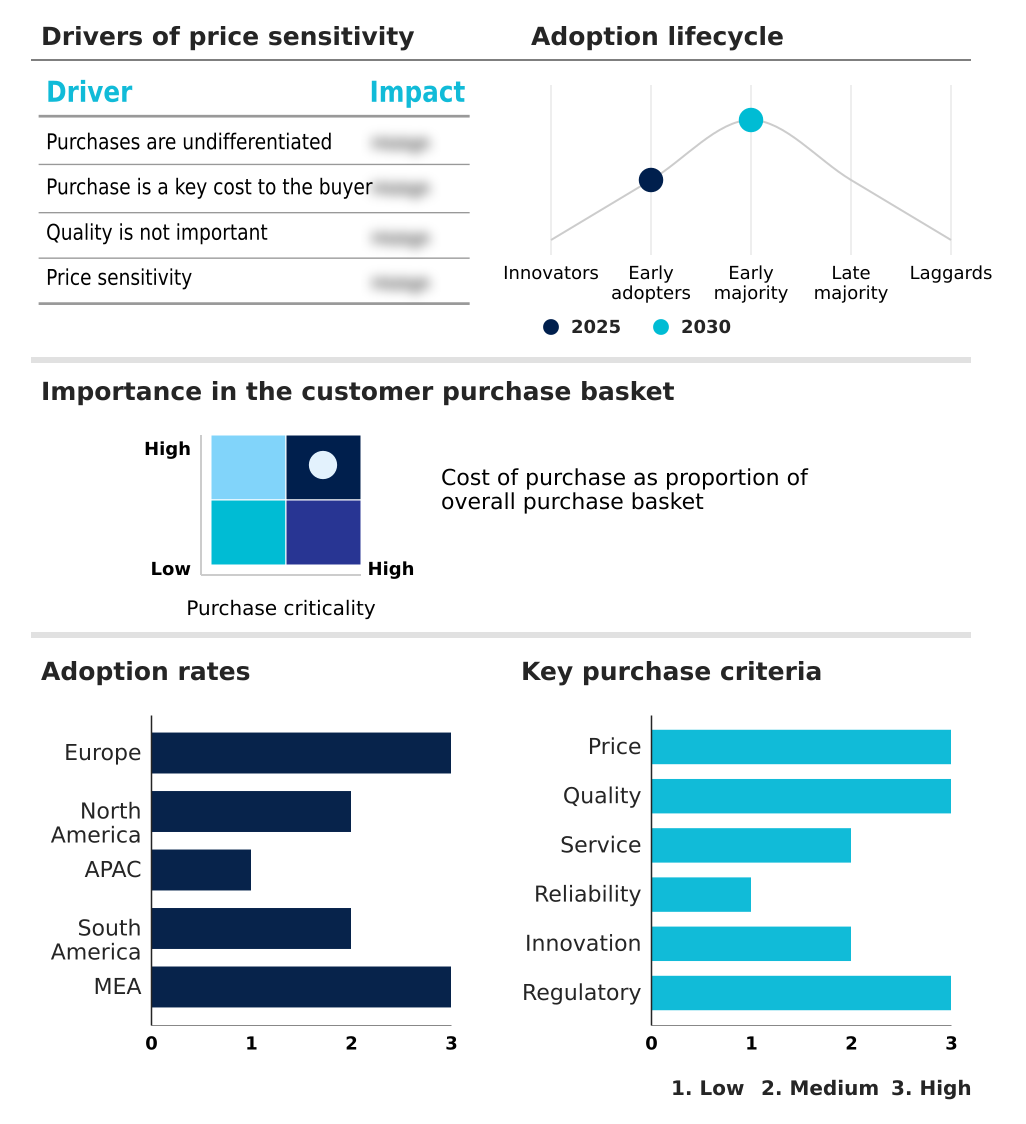
Exclusive Technavio Analysis on Customer Landscape
The billiards and snooker equipment market forecasting report includes the adoption lifecycle of the market, covering from the innovator’s stage to the laggard’s stage. It focuses on adoption rates in different regions based on penetration. Furthermore, the billiards and snooker equipment market report also includes key purchase criteria and drivers of price sensitivity to help companies evaluate and develop their market growth analysis strategies.
Customer Landscape of Billiards And Snooker Equipment Industry
Competitive Landscape
Companies are implementing various strategies, such as strategic alliances, billiards and snooker equipment market forecast, partnerships, mergers and acquisitions, geographical expansion, and product/service launches, to enhance their presence in the industry.
BCE Distributors Ltd. - Key offerings focus on a comprehensive portfolio of pool tables and related billiard accessories, catering to both residential and commercial sectors.
The industry research and growth report includes detailed analyses of the competitive landscape of the market and information about key companies, including:
- BCE Distributors Ltd.
- Berner Billiards
- Bilijardai JSC
- Billares SAM S.A.U.
- Birmingham Billiards Ltd.
- Brunswick Billiards
- Diamond Billiard Products Inc.
- Dynamic Billard Org. GmbH
- GLD Products
- Hamilton Billiards Games Co.
- Iwan Simonis SA
- Jinan Yalin Billiard Co. Ltd.
- Kao Kao Enterprises Co. Ltd.
- McDermott Cue Mfg. LLC
- Olhausen Billiard Mfg. Inc.
- Peradon Ltd.
- Predator Group
- Riley Snooker International
- Viking Cue Mfg. LLC
Qualitative and quantitative analysis of companies has been conducted to help clients understand the wider business environment as well as the strengths and weaknesses of key industry players. Data is qualitatively analyzed to categorize companies as pure play, category-focused, industry-focused, and diversified; it is quantitatively analyzed to categorize companies as dominant, leading, strong, tentative, and weak.
Recent Development and News in Billiards and snooker equipment market
- In August 2024, Predator Group announced its acquisition of Bilhares Carrinho to expand its manufacturing and distribution capabilities within the European market.
- In February 2025, Moa Capital completed the acquisition of Seybert's Billiard Supply, strengthening its position in the high-end cue sports specialty retail sector.
- In March 2025, the World Snooker Tour announced a new title partnership with Halo, a service management software firm, for the 2025 World Championship.
- In May 2025, Olhausen Billiard Mfg. Inc. served as the official table sponsor for the Oneida WPA Women's 8-Ball World Championship, debuting a new professional tournament table.
Dive into Technavio’s robust research methodology, blending expert interviews, extensive data synthesis, and validated models for unparalleled Billiards And Snooker Equipment Market insights. See full methodology.
| Market Scope | |
|---|---|
| Page number | 283 |
| Base year | 2025 |
| Historic period | 2020-2024 |
| Forecast period | 2026-2030 |
| Growth momentum & CAGR | Accelerate at a CAGR of 1.5% |
| Market growth 2026-2030 | USD 49.7 million |
| Market structure | Fragmented |
| YoY growth 2025-2026(%) | 1.5% |
| Key countries | Germany, UK, France, Italy, Spain, The Netherlands, US, Canada, Mexico, China, India, Japan, South Korea, Australia, Indonesia, Brazil, Argentina, Chile, Saudi Arabia, UAE, South Africa, Turkey and Israel |
| Competitive landscape | Leading Companies, Market Positioning of Companies, Competitive Strategies, and Industry Risks |
Research Analyst Overview
- The billiards and snooker equipment market is undergoing a significant material and technological evolution, compelling a strategic pivot in R&D investment. While traditional ash wood cues and tables with sustainable hardwoods remain popular, the industry is defined by the adoption of advanced composite materials.
- The shift toward carbon fiber cues with low-deflection shafts and superior warp resistance has been a game-changer, with some manufacturers reporting a 40% reduction in warranty claims related to environmental damage. Precision is paramount, evident in demand for professional-grade cues, precision-engineered balls made from phenolic resin compositions, and high-speed cloths like ultra-fine worsted wool.
- For specialized formats like Carom billiards and three-cushion billiards, innovations such as pocketless tables and heated Carom tables with advanced table heating systems are critical. Modern professional tournament tables feature steel block cushions and eco-friendly slate alternatives alongside high-tech additions like built-in movement sensors, AI-driven analytics, and digital scoring systems with specialized LED table lighting.
- The market also caters to diverse consumer needs, from custom cue collecting and American pool equipment to outdoor pool tables made with weather-resistant materials. Even accessories like high-performance chalk and premium resin balls are subject to constant innovation, reflecting a market where advanced cue tip technology defines the competitive edge.
What are the Key Data Covered in this Billiards And Snooker Equipment Market Research and Growth Report?
-
What is the expected growth of the Billiards And Snooker Equipment Market between 2026 and 2030?
-
USD 49.7 million, at a CAGR of 1.5%
-
-
What segmentation does the market report cover?
-
The report is segmented by Distribution Channel (Offline, and Online), Product (Tables, Cues and balls, and Others), End-user (Professional, and Recreational) and Geography (Europe, North America, APAC, South America, Middle East and Africa)
-
-
Which regions are analyzed in the report?
-
Europe, North America, APAC, South America and Middle East and Africa
-
-
What are the key growth drivers and market challenges?
-
Rising demand for billiards and snooker equipment from APAC, Fluctuations in raw material prices and transportation costs
-
-
Who are the major players in the Billiards And Snooker Equipment Market?
-
BCE Distributors Ltd., Berner Billiards, Bilijardai JSC, Billares SAM S.A.U., Birmingham Billiards Ltd., Brunswick Billiards, Diamond Billiard Products Inc., Dynamic Billard Org. GmbH, GLD Products, Hamilton Billiards Games Co., Iwan Simonis SA, Jinan Yalin Billiard Co. Ltd., Kao Kao Enterprises Co. Ltd., McDermott Cue Mfg. LLC, Olhausen Billiard Mfg. Inc., Peradon Ltd., Predator Group, Riley Snooker International and Viking Cue Mfg. LLC
-
Market Research Insights
- Market dynamics are increasingly shaped by the integration of cue sports equipment into new environments. The expansion into commercial billiard parlors and the hospitality industry continues, with venues reporting a 10% increase in customer dwell time after installing tables. Simultaneously, the residential sector is booming, driven by demand for residential game rooms and innovative multi-functional designs like convertible dining-to-billiard tables.
- This shift has boosted sales of billiard accessories and recreational kits through online channels, improving inventory turnover for retailers by over 15%. Manufacturers are responding with bespoke customization options for home entertainment rooms and durable, coin-operated equipment for community centers.
- The trend also includes professional tournament cues for enthusiasts and specialized equipment for emerging niches like corporate private clubs and sports lounges.
We can help! Our analysts can customize this billiards and snooker equipment market research report to meet your requirements.
 RIA -
RIA - 
