Bio-Based Fibre Market Size 2024-2028
The bio-based fibre market size is forecast to increase by USD 18.6 billion at a CAGR of 7.7% between 2023 and 2028.
- The bio-based fibers market is experiencing significant growth due to various factors. One key trend is the increasing utilization of diverse feedstocks for the production of bio-based fibers. This diversification allows for greater flexibility in supply and reduces reliance on a single source. Another trend is the growing preference for eco-friendly textiles, as consumers become more conscious of the environmental impact of their clothing choices. Regulatory pressures and environmental concerns are driving the adoption of bio-based fibers in various industries, such as bioplastics, natural fiber composites, and bio-based chemicals. However, the market is also facing challenges, such as the variability in costs of raw materials for bio-based fibers. Producers must navigate these fluctuations to remain competitive and meet consumer demand for sustainable and affordable textiles. Overall, the market for bio-based fibers is expected to continue growing, driven by these trends and the increasing demand for sustainable textile solutions.
What will be the Size of the Bio-Based Fibre Market During the Forecast Period?
- The market encompasses a range of plant-derived fibres, including Nien Foun fiber and industrial plant fibres like jute, hemp, and flax. This sector is gaining traction in textiles and apparel due to increasing consumer demand for eco-friendly alternatives to synthetic fibres. Sustainable construction materials, green packaging solutions, and eco-friendly textiles are other significant applications.
- Moreover, bio-based fibres are also used In the production of biodegradable films, compostable containers, insulation materials, bio-based concrete, and recycled fibers. Biorefinery processes, synthetic biology, and microbial sources are key areas of innovation, leading to the development of bio-based polymers like PLA (polylactic acid), Bio-PET, PHA (polyhydroxyalkanoates), cellulose-based materials, and other plant-based and waste-derived materials.
How is this Bio-Based Fibre Industry segmented and which is the largest segment?
The bio-based fibre industry research report provides comprehensive data (region-wise segment analysis), with forecasts and estimates in "USD billion" for the period 2024-2028, as well as historical data from 2018-2022 for the following segments.
- Application
- Textiles and apparel
- Home furnishings
- Automotive
- Others
- Type
- Synthetic fibers
- Natural fibers
- Geography
- APAC
- China
- India
- Europe
- Germany
- North America
- US
- Middle East and Africa
- South America
- APAC
By Application Insights
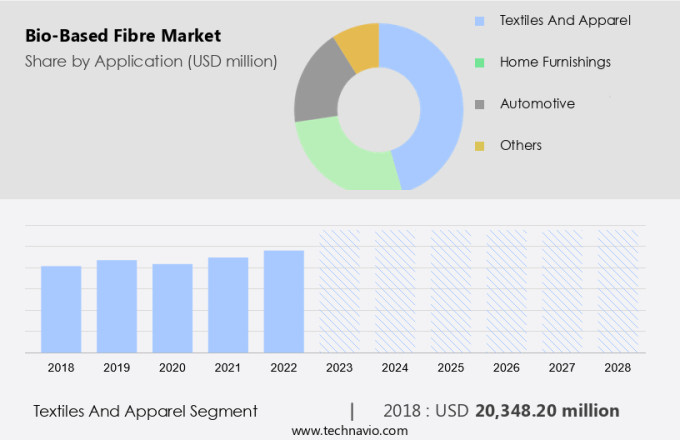
- The textiles and apparel segment is estimated to witness significant growth during the forecast period.
The market is experiencing notable growth In the textiles and apparel industry due to the increasing demand for eco-friendly alternatives to synthetic fibres. Mycelium composites, derived from the mycelium of mushrooms, are gaining attention as a potential sustainable solution. Mycelium, the web-like root structure of fungi, exhibits properties suitable for textile production. Compared to synthetic fibres, which are derived from non-renewable resources and contribute to environmental pollution, mycelium-based textiles offer environmental benefits. Other bio-based fibres, such as hemp, green steel, bio-based packaging, sustainable textiles, mycelium leather, and algae-based textiles, are also being explored for their sustainability advantages. These developments are crucial for reducing the carbon footprint of the textiles industry and promoting sustainable practices.
Get a glance at the Bio-Based Fibre Industry report of share of various segments Request Free Sample
The textiles and apparel segment was valued at USD 20.35 billion in 2018 and showed a gradual increase during the forecast period.
Regional Analysis
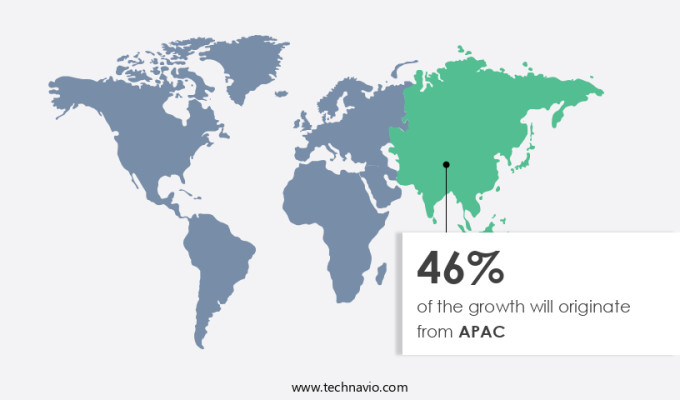
- APAC is estimated to contribute 46% to the growth of the global market during the forecast period.
Technavio's analysts have elaborately explained the regional trends and drivers that shape the market during the forecast period.
For more insights on the market share of various regions, Request Free Sample
The Asia Pacific region is leading the market's growth, driven by the textile industry's increasing adoption of biosynthetics. These fibres, derived from renewable resources like agricultural waste, food crops, and plants, provide a sustainable alternative to fossil-based fibres. The shift towards biosynthetics is gaining traction due to its potential to decrease reliance on non-renewable resources and mitigate climate change. The primary difference between biosynthetic fibres and traditional synthetic fibres lies In their raw materials.
Moreover, biosynthetic fibres are produced from starches, sugars, and lipids sourced from high-yielding crops such as corn, sugar cane, and sugar beets, as well as plant oils. Regulatory pressures are also propelling the market's expansion, with governments and organizations promoting the use of eco-friendly materials. Additionally, the production of bioplastics, natural fiber composites, and bio-based chemicals is increasing the demand for bio-based fibres.
Market Dynamics
Our bio-based fibre market researchers analyzed the data with 2023 as the base year, along with the key drivers, trends, and challenges. A holistic analysis of drivers will help companies refine their marketing strategies to gain a competitive advantage.
What are the key market drivers leading to the rise In the adoption of Bio-Based Fibre Industry?
Diverse feedstock utilization for the production of bio-based fibers is the key driver of the market.
- The market is experiencing a notable shift towards utilizing diverse feedstocks for production, driven by the demand for sustainability and resource efficiency. Innovative projects, such as Bio-LUSH, are pioneering this movement by exploring underutilized biomass feedstocks, including hemp hurd, forest residues, nettle, and seagrasses. These feedstocks provide ecological benefits and reduce competition with food production, contributing to a circular bioeconomy. The industry is optimizing biomass value chains and developing eco-friendly processing methods to enhance the properties of these feedstocks. As a result, they can be applied to various sectors, such as textiles and apparel, insulation materials, and bioplastics.
- Moreover, textile applications include eco-friendly textiles like mycelium leather and algae-based textiles, while bioplastics encompass biodegradable films, compostable containers, and bio-based coatings, resins, and adhesives. Bio-based fibres are also being used in sustainable construction materials like bio-based concrete and insulation materials, as well as in advanced biofuels, such as biodiesel and bioethanol. Additionally, the market is expanding into emerging areas like sustainable electronics, semiconductors, and chemical producers. Start-ups and established companies are collaborating to innovate and bring new bio-based products to market, further fueling the growth of this sector.
What are the market trends shaping the Bio-Based Fibre Industry?
A growing shift toward eco-friendly textiles is the upcoming market trend.
- The market is witnessing significant growth due to the increasing demand for eco-friendly textiles and apparel. Plant Fibres, such as Nien Foun Fiber, Hemp-based products, and Mycelium composites, are gaining popularity as sustainable alternatives to synthetic fibres. Regulatory pressures are driving the shift towards bio-based materials in various industries, including textiles, packaging, and construction. Bio-Based Chemicals, like Biodegradable films, Compostable containers, Insulation materials, and Bio-based concrete, are being adopted for sustainable construction materials and green packaging solutions.
- Moreover, bioplastics, such as PLA (Polylactic Acid), Bio-PET, and PHA (Polyhydroxyalkanoates), are increasingly used in place of traditional plastics. Synthetic biology and Biorefinery processes are enabling the production of Plant-based materials, Waste-derived materials, Microbial sources, and Bio-based polymers. Innovative start-ups and Chemical producers are investing In the development of advanced Bio-based materials, such as Mycelium-based products, Algal biomaterials, and Sustainable electronics. The market is also expanding into new applications, such as Bio-based coatings, Resins, Adhesives, Green steel production, and Sustainable semiconductors. These developments are expected to further fuel the growth of the market In the US and globally.
What challenges does the Bio-Based Fibre Industry face during its growth?
Variability in costs of raw materials of bio-based fibres is a key challenge affecting the industry growth.
- The market faces significant challenges due to the variability In the costs of raw materials, particularly in relation to cotton prices. In late 2023, the Cotton Corporation of India (CCI) procured 2.5 lakh bales of cotton at the Minimum Support Price (MSP) due to a sharp decline in prices. This drop is attributed to weak demand, caused by the global economic crisis and its impact on key markets such as the US and Britain. Despite a low crop yield and carryover stocks from the previous year, the demand for cotton remains subdued, leading to a two-year low in prices. This trend poses a challenge for the market, which includes plant fibres, Nien Foun Fiber, and recycled fibers, as well as bio-based chemicals, natural fiber composites, bioplastics, and sustainable construction materials. The market also encompasses eco-friendly textiles, biodegradable films, compostable containers, insulation materials, bio-based concrete, and various other applications. Key drivers for the market include regulatory pressures, the development of biorefinery processes, and advancements in synthetic biology and plant-based materials.
- However, innovative start-ups and chemical producers are also contributing to the growth of the market through the production of bio-based polymers such as PLA (Polylactic Acid), Bio-PET, and PHA (Polyhydroxyalkanoates), as well as cellulose-based materials, mycelium-based products, algal biomaterials, and natural fibers including hemp-based products and mycelium composites. Additionally, the market includes green steel production, bio-based packaging, sustainable textiles, mycelium leather, algae-based textiles, bio-based coatings, resins, adhesives, biofuels such as biodiesel and bioethanol, advanced biofuels, sustainable electronics, and sustainable semiconductors.
Exclusive Customer Landscape
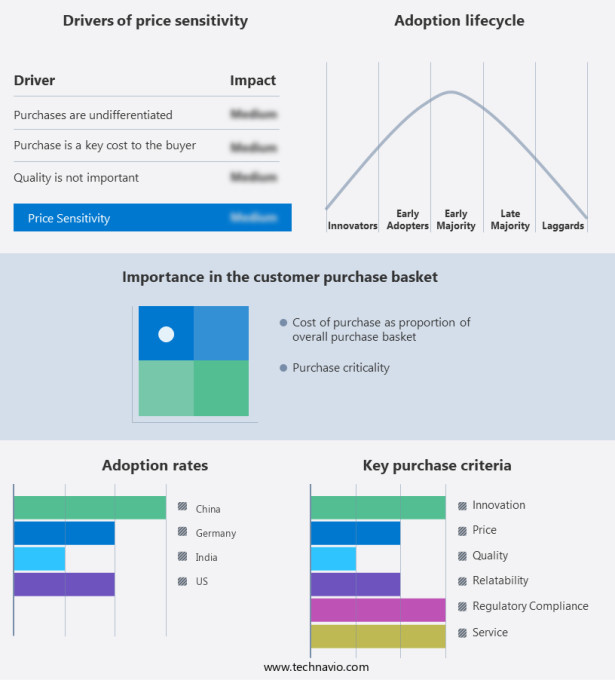
The bio-based fibre market forecasting report includes the adoption lifecycle of the market, covering from the innovator's stage to the laggard's stage. It focuses on adoption rates in different regions based on penetration. Furthermore, the bio-based fibre market report also includes key purchase criteria and drivers of price sensitivity to help companies evaluate and develop their market growth analysis strategies.
Customer Landscape
Key Companies & Market Insights
Companies are implementing various strategies, such as strategic alliances, bio-based fibre market forecast, partnerships, mergers and acquisitions, geographical expansion, and product/service launches, to enhance their presence In the industry. The industry research and growth report includes detailed analyses of the competitive landscape of the market and information about key companies, including:
- Acegreen Eco-Material Technology co, Ltd.
- AMSilk GmbH
- Bambooder Biobased Fibers B.V.
- Baoding Swan New Fiber Manufacturing Co., Ltd.
- BPREG Composites
- China Bambro Textile Co. Ltd.
- China Populus Textile Ltd
- David C. Poole Co. Inc.
- Grasim Industries Ltd
- Lenzing AG
- Qingdao Textiles Group Fiber Technology Co. Ltd.
- Sateri Shanghai Ltd.
- SCALE Advanced Biocomposites
- Shanghai Tenbro Bamboo Textile Co. Ltd.
- Smartfiber AG
- Teijin Ltd.
- USFibers
Qualitative and quantitative analysis of companies has been conducted to help clients understand the wider business environment as well as the strengths and weaknesses of key industry players. Data is qualitatively analyzed to categorize companies as pure play, category-focused, industry-focused, and diversified; it is quantitatively analyzed to categorize companies as dominant, leading, strong, tentative, and weak.
Research Analyst Overview
The bio-based fibers market is a burgeoning sector that is gaining significant traction due to the increasing demand for sustainable and eco-friendly alternatives to traditional fibers and materials. This market encompasses a diverse range of products, including textiles, construction materials, packaging solutions, and chemicals. Textiles and Apparel: The textile industry is undergoing a transformation as consumers seek out more sustainable options. Bio-based fibers, such as Nien Foun fiber and plant-based materials, are gaining popularity In the production of eco-friendly textiles and apparel. These fibers offer several advantages, including reduced carbon footprint, biodegradability, and renewability. Regulatory Pressures: Regulatory pressures are driving the growth of the bio-based fibers market. Governments and regulatory bodies are implementing policies and regulations that encourage the use of sustainable and biodegradable materials. For instance, the European Union's Single Use Plastics Directive aims to reduce the use of single-use plastics, creating opportunities for biodegradable films and compostable containers.
Moreover, the bio-based chemicals segment is another significant area of growth In the bio-based fibers market. These chemicals are derived from renewable sources and offer several advantages over their petrochemical counterparts. Bio-based chemicals are used In the production of various products, including resins, adhesives, and coatings. The construction industry is also embracing bio-based fibers as sustainable alternatives to traditional materials. Bio-based insulation materials, such as cellulose-based materials and mycelium-based products, offer improved thermal insulation and sound absorption properties. Bio-based concrete is another promising material that offers reduced carbon emissions and improved durability. The packaging industry is undergoing a shift towards sustainable and biodegradable solutions. Bio-based packaging, including bioplastics and compostable containers, offer several advantages over traditional packaging materials.
However, these materials are renewable, biodegradable, and offer reduced carbon emissions. Bio-Based Polymers: Bio-based polymers, such as PLA (polylactic acid), PHA (polyhydroxyalkanoates), and cellulose-based materials, are gaining popularity due to their sustainability and biodegradability. These polymers are used in various applications, including packaging, textiles, and construction materials. The bio-based fibers market is also witnessing significant innovation from start-ups. These companies are developing new and innovative products, such as mycelium leather, algae-based textiles, and bio-based coatings. These products offer improved sustainability and performance compared to traditional materials. Biorefinery processes are playing a crucial role In the production of bio-based fibers and materials.
Furthermore, these processes enable the conversion of biomass into various value-added products, including biofuels, biochemicals, and bio-based materials. Synthetic biology is another area of innovation In the bio-based fibers market. This technology enables the production of bio-based materials using microbial sources, such as algal biomaterials and waste-derived materials. These materials offer improved sustainability and performance compared to traditional materials. Overall, the bio-based fibers market is a dynamic and growing sector that offers several advantages over traditional fibers and materials. The market encompasses a diverse range of products, including textiles, construction materials, packaging solutions, and chemicals. Regulatory pressures, innovation, and biorefinery processes are driving the growth of this market, and the future looks promising for this sustainable and eco-friendly sector.
|
Bio-Based Fibre Market Scope |
|
|
Report Coverage |
Details |
|
Page number |
209 |
|
Base year |
2023 |
|
Historic period |
2018-2022 |
|
Forecast period |
2024-2028 |
|
Growth momentum & CAGR |
Accelerate at a CAGR of 7.7% |
|
Market growth 2024-2028 |
USD 18.6 billion |
|
Market structure |
Fragmented |
|
YoY growth 2023-2024(%) |
7.2 |
|
Key countries |
China, India, US, and Germany |
|
Competitive landscape |
Leading Companies, Market Positioning of Companies, Competitive Strategies, and Industry Risks |
What are the Key Data Covered in this Bio-Based Fibre Market Research and Growth Report?
- CAGR of the Bio-Based Fibre industry during the forecast period
- Detailed information on factors that will drive the Bio-Based Fibre growth and forecasting between 2024 and 2028
- Precise estimation of the size of the market and its contribution of the industry in focus to the parent market
- Accurate predictions about upcoming growth and trends and changes in consumer behaviour
- Growth of the market across APAC, Europe, North America, Middle East and Africa, and South America
- Thorough analysis of the market's competitive landscape and detailed information about companies
- Comprehensive analysis of factors that will challenge the bio-based fibre market growth of industry companies
We can help! Our analysts can customize this bio-based fibre market research report to meet your requirements.


