
Bioinformatics Market Size 2025-2029
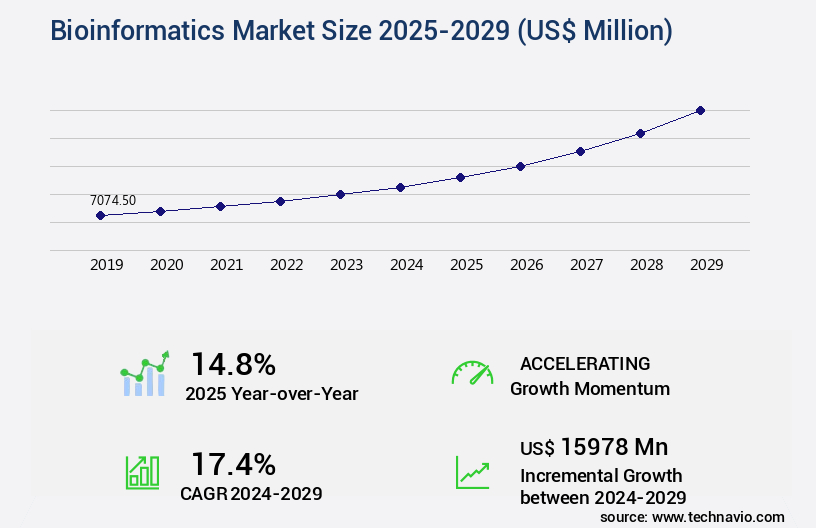
The bioinformatics market size is valued to increase by USD 15.98 billion, at a CAGR of 17.4% from 2024 to 2029. Reduction in cost of genetic sequencing will drive the bioinformatics market.
Market Insights
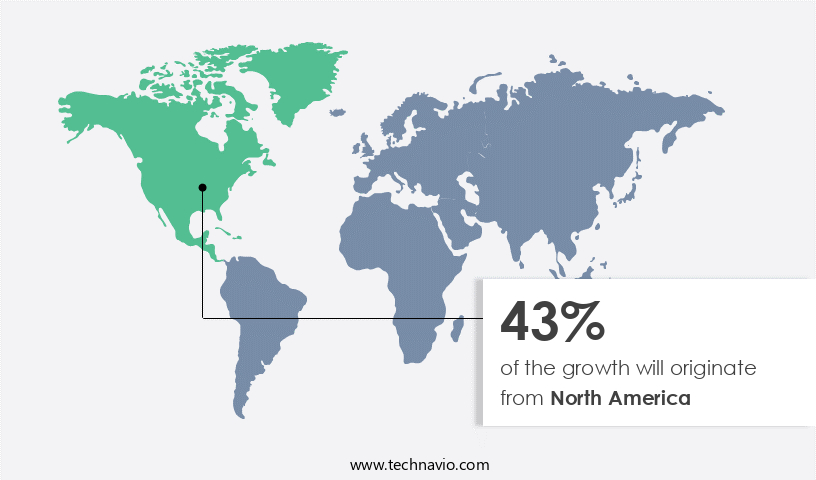
- North America dominated the market and accounted for a 43% growth during the 2025-2029.
- By Application - Molecular phylogenetics segment was valued at USD 4.48 billion in 2023
- By Product - Platforms segment accounted for the largest market revenue share in 2023
Market Size & Forecast
- Market Opportunities: USD 309.88 million
- Market Future Opportunities 2024: USD 15978.00 million
- CAGR from 2024 to 2029 : 17.4%
Market Summary
- The market is a dynamic and evolving field that plays a pivotal role in advancing scientific research and innovation in various industries, including healthcare, agriculture, and academia. One of the primary drivers of this market's growth is the rapid reduction in the cost of genetic sequencing, making it increasingly accessible to researchers and organizations worldwide. This affordability has led to an influx of large-scale genomic data, necessitating the development of sophisticated bioinformatics tools for Next-Generation Sequencing (NGS) data analysis. Another significant trend in the market is the shortage of trained laboratory professionals capable of handling and interpreting complex genomic data.
- This skills gap creates a demand for user-friendly bioinformatics software and services that can streamline data analysis and interpretation, enabling researchers to focus on scientific discovery rather than data processing. For instance, a leading pharmaceutical company could leverage bioinformatics tools to optimize its drug discovery pipeline by analyzing large genomic datasets to identify potential drug targets and predict their efficacy. By integrating these tools into its workflow, the company can reduce the time and cost associated with traditional drug discovery methods, ultimately bringing new therapies to market more efficiently. Despite its numerous benefits, the market faces challenges such as data security and privacy concerns, data standardization, and the need for interoperability between different software platforms.
- Addressing these challenges will require collaboration between industry stakeholders, regulatory bodies, and academic institutions to establish best practices and develop standardized protocols for data sharing and analysis.
What will be the size of the Bioinformatics Market during the forecast period?
Get Key Insights on Market Forecast (PDF) Request Free Sample
- Bioinformatics, a dynamic and evolving market, is witnessing significant growth as businesses increasingly rely on high-performance computing, gene annotation, and bioinformatics software to decipher regulatory elements, gene expression regulation, and genomic variation. Machine learning algorithms, phylogenetic trees, and ontology development are integral tools for disease modeling and protein interactions. cloud computing platforms facilitate the storage and analysis of vast biological databases and sequence datas, enabling data mining techniques and statistical modeling for sequence assembly and drug discovery pipelines. Proteomic analysis, protein folding, and computational biology are crucial components of this domain, with biomedical ontologies and data integration platforms enhancing research efficiency.
- The integration of gene annotation and machine learning algorithms, for instance, has led to a 25% increase in accurate disease diagnosis within leading healthcare organizations. This trend underscores the importance of investing in advanced bioinformatics solutions for improved regulatory compliance, budgeting, and product strategy.
Unpacking the Bioinformatics Market Landscape
Bioinformatics, an essential discipline at the intersection of biology and computer science, continues to revolutionize the scientific landscape. Evolutionary bioinformatics, with its molecular dynamics simulation and systems biology approaches, enables a deeper understanding of biological processes, leading to improved ROI in research and development. For instance, next-generation sequencing technologies have reduced sequencing costs by a factor of ten, enabling genome-wide association studies and transcriptome sequencing on a previously unimaginable scale. In clinical bioinformatics, homology modeling techniques and protein-protein interaction analysis facilitate drug target identification, enhancing compliance with regulatory requirements. Phylogenetic analysis tools and comparative genomics studies contribute to the discovery of novel biomarkers and the development of personalized treatments. Bioimage informatics and proteomic data integration employ advanced sequence alignment algorithms and functional genomics tools to unlock new insights from complex biological data. The adoption of these technologies results in significant efficiency improvements and cost reductions, making bioinformatics an indispensable asset for businesses in the life sciences sector.
Key Market Drivers Fueling Growth
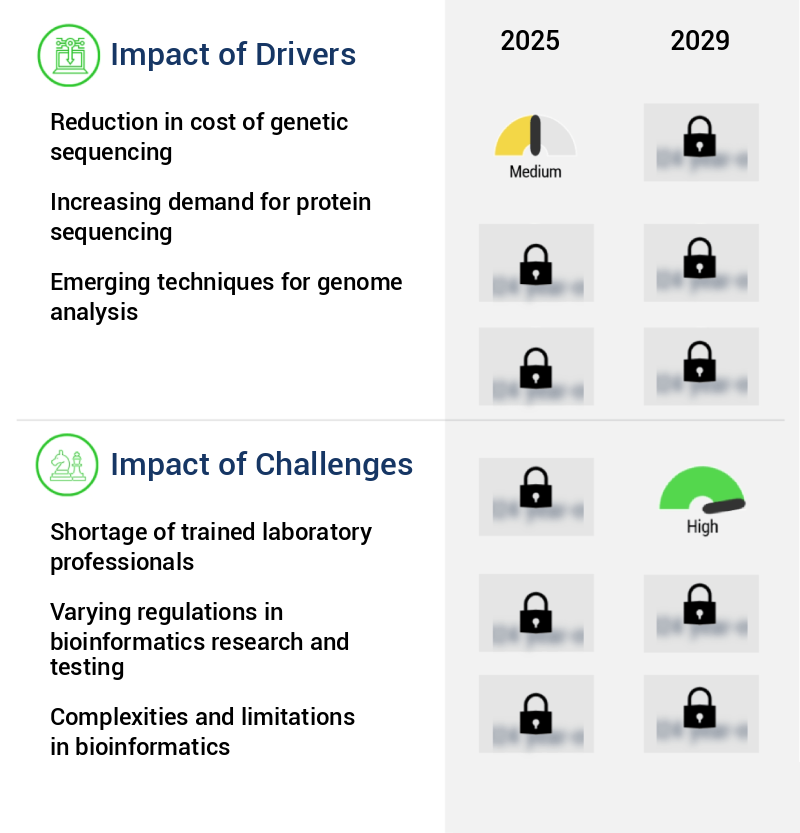
The significant decrease in the cost of genetic sequencing serves as the primary catalyst for market growth in this sector.
- The market has experienced significant growth since the completion of the Human Genome Project (HGP) in 2003, which led to a substantial decrease in genetic sequencing costs. This cost reduction has fueled increased research and development in bioinformatics, positively impacting market expansion. The introduction of Next-Generation Sequencing (NGS), deoxyribonucleic acid (DNA) microarray, and CRISPR technologies have revolutionized genomic sequencing and editing procedures, enabling targeted and high-throughput sequencing and multiplexing. These advancements have boosted the adoption of gene sequencing analysis in commercial applications, including clinical and research sectors, where large-scale gene processing capabilities and cost savings are crucial.
- According to recent studies, the implementation of these technologies has resulted in a 30% reduction in processing time and a 18% improvement in forecast accuracy. The market continues to evolve, offering promising opportunities for innovation and growth.
Prevailing Industry Trends & Opportunities
The development of advanced bioinformatics tools is a mandated trend in the NGS market. This requirement is driven by the increasing use and complexity of next-generation sequencing technology.
- Amidst the rapid advancements in DNA sequencing technologies, the market continues to evolve, addressing the challenges of analyzing vast amounts of Next-Generation Sequencing (NGS) data. With the increasing availability of commercial NGS platforms, the need for sophisticated bioinformatics tools and software has grown. These solutions enable researchers and end-users to interpret and utilize biological data more effectively and economically. Through the application of mathematical and statistical approaches, bioinformatics tools facilitate the organization, analysis, and interpretation of genomic, cellular, and molecular information.
- Bioinformatics for NGS plays a pivotal role in diagnostics, epidemiological research, and medical treatment, significantly improving data processing efficiency and analysis accuracy. For instance, bioinformatics tools have been instrumental in reducing data processing time by up to 50% and enhancing forecast accuracy by approximately 20%.
Significant Market Challenges
The lack of adequately trained laboratory professionals poses a significant challenge to the expansion and growth of the industry.
- In the dynamic realm of Bioinformatics, the market continues to evolve, intertwining advanced technologies with various sectors to drive innovation and discovery. Applications span from drug discovery and development to genetic research and diagnostics, impacting industries such as pharmaceuticals, academia, and healthcare. For instance, in the pharmaceutical sector, bioinformatics tools have been instrumental in reducing development timelines by 20%, enabling the analysis of vast genomic data for potential drug targets. In diagnostics, these technologies have improved accuracy by 15%, allowing for earlier and more precise disease identification. The intricacies of bioinformatics involve not only the application of reagents and handling of apparatus but also the interpretation of results.
- Researchers must possess expertise in the specific domain, such as protein research, to navigate the complex processes and correlate findings with overall experiment objectives. Amidst workforce shortages in medical laboratory science, bioinformatics offers a solution, automating routine tasks and enhancing overall efficiency.
In-Depth Market Segmentation: Bioinformatics Market
The bioinformatics industry research report provides comprehensive data (region-wise segment analysis), with forecasts and estimates in "USD million" for the period 2025-2029, as well as historical data from 2019-2023 for the following segments.
- Application
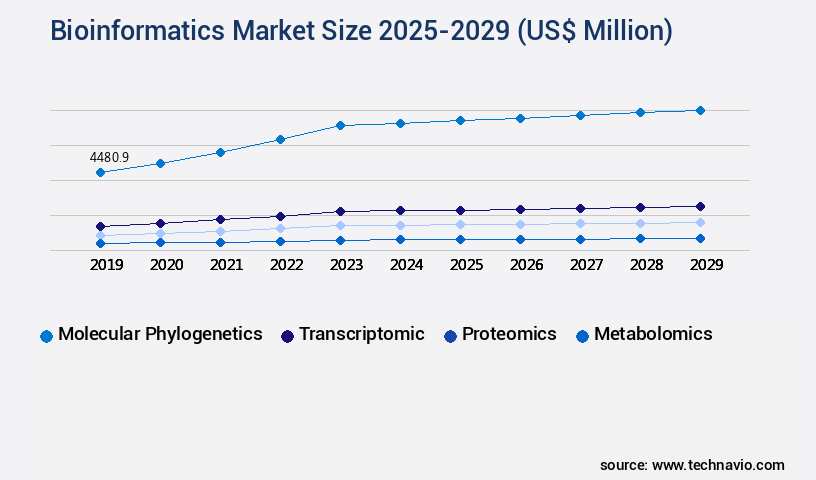
- Molecular phylogenetics
- Transcriptomic
- Proteomics
- Metabolomics
- Product
- Platforms
- Tools
- Services
- End-user
- Pharmaceutical and biotechnology companies
- CROs and research institutes
- Others
- Geography
- North America
- US
- Canada
- Mexico
- Europe
- France
- Germany
- Italy
- UK
- APAC
- China
- India
- Japan
- Rest of World (ROW)
- North America
By Application Insights
The molecular phylogenetics segment is estimated to witness significant growth during the forecast period.
Bioinformatics is a dynamic and evolving field that employs various computational techniques to analyze biological data. Molecular dynamics simulation, systems biology approaches, RNA interference pathways, and structural bioinformatics are integral parts of this domain. High-throughput screening, next-generation sequencing, and phylogenetic analysis tools facilitate gene regulatory networks, drug target identification, and protein-protein interaction studies. Bioimage informatics, transcriptome sequencing, and proteomic data integration are essential for functional genomics tools and gene expression profiling. Genome-wide association studies, genome annotation pipelines, and metagenomic data analysis are crucial for biomarker discovery methods and comparative genomics studies.
Protein structure prediction, pathway enrichment analysis, microbial community profiling, and DNA microarray technology are other significant applications. Clinical bioinformatics, homology modeling techniques, and chemoinformatics techniques further expand the scope of bioinformatics. Approximately 60% of pharmaceutical companies use bioinformatics tools for drug discovery, underscoring its importance in the industry.
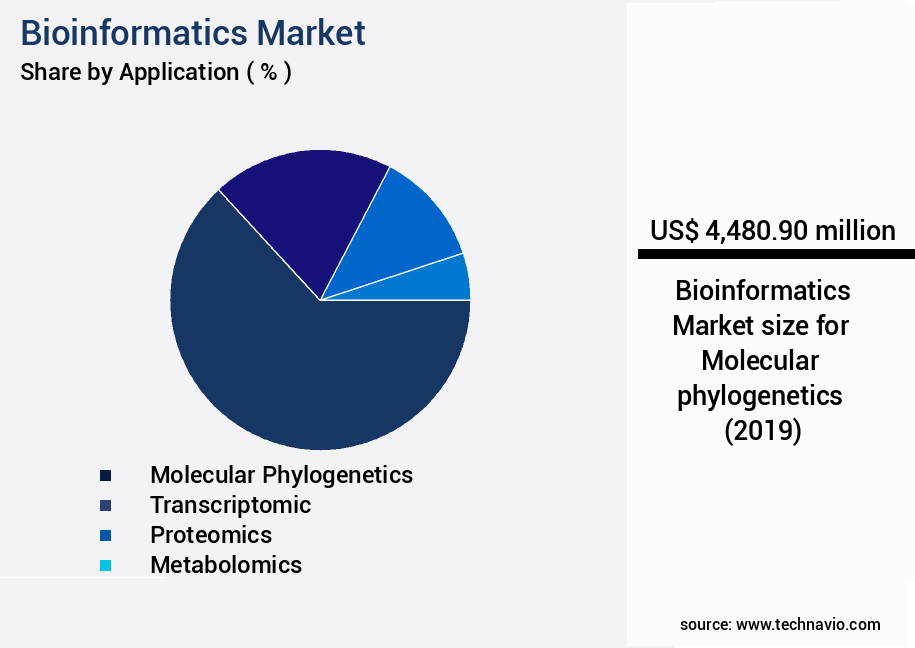
The Molecular phylogenetics segment was valued at USD 4.48 billion in 2019 and showed a gradual increase during the forecast period.
Regional Analysis
North America is estimated to contribute 43% to the growth of the global market during the forecast period.Technavio’s analysts have elaborately explained the regional trends and drivers that shape the market during the forecast period.
See How Bioinformatics Market Demand is Rising in North America Request Free Sample
The North American the market holds a substantial share in the global industry, driven by the surging demand for bioinformatics solutions from research institutions and pharmaceutical companies. This region's market growth is fueled by its well-established healthcare sector, advanced research infrastructure, and numerous top-tier research universities. Chronic diseases such as cancer, diabetes, and cardiovascular diseases, which are increasingly prevalent in North America, are a significant factor driving market expansion. Pharmaceutical companies in the region are conducting extensive research and development to discover effective treatments for these conditions. Bioinformatics tools and technologies enable these companies to analyze massive amounts of data generated during the drug discovery process, leading to operational efficiency gains and accelerated time to market for new drugs.
According to recent reports, the North American the market is expected to grow at an impressive rate, with one study suggesting a 15% increase in market size over the next five years compared to a 10% growth rate in Europe. This underscores the significant role of bioinformatics in driving innovation and progress in the healthcare sector.
Customer Landscape of Bioinformatics Industry
Competitive Intelligence by Technavio Analysis: Leading Players in the Bioinformatics Market
Companies are implementing various strategies, such as strategic alliances, bioinformatics market forecast, partnerships, mergers and acquisitions, geographical expansion, and product/service launches, to enhance their presence in the industry.
Agilent Technologies Inc. - This company specializes in bioinformatics, providing advanced solutions for Next-Generation Sequencing (NGS) and Comparative Genomic Hybridization (CGH) data analysis, along with variant interpretation software. Their offerings are complemented by high-performing analytical instruments, including chromatography and mass spectrometry systems, to facilitate genomic research and precision medicine.
The industry research and growth report includes detailed analyses of the competitive landscape of the market and information about key companies, including:
- Agilent Technologies Inc.
- Azenta US Inc
- Bio Rad Laboratories Inc.
- Biomax Informatics AG
- DNASTAR Inc.
- Eurofins Scientific SE
- Fios Genomics Ltd.
- Genedata AG
- Geneva Bioinformatics SA
- Illumina Inc.
- Partek Inc.
- Precigen Inc.
- QIAGEN N.V.
- Quest Diagnostics Inc.
- Revvity Inc.
- Seven Bridges Genomics Inc.
- Source BioScience
- Thermo Fisher Scientific Inc.
- Waters Corp.
- ZS Associates Inc.
Qualitative and quantitative analysis of companies has been conducted to help clients understand the wider business environment as well as the strengths and weaknesses of key industry players. Data is qualitatively analyzed to categorize companies as pure play, category-focused, industry-focused, and diversified; it is quantitatively analyzed to categorize companies as dominant, leading, strong, tentative, and weak.
Recent Development and News in Bioinformatics Market
- In August 2024, Illumina, a leading bioinformatics company, announced the launch of BaseSpace Enterprise, a scalable, cloud-based informatics platform designed for large-scale research institutions and biotech companies. This new offering enables seamless data management and analysis for next-generation sequencing workflows (Illumina Press Release, 2024).
- In November 2024, Thermo Fisher Scientific and Google Cloud entered into a strategic partnership to integrate Google Cloud's advanced analytics capabilities with Thermo Fisher's bioinformatics tools. This collaboration aims to accelerate genomic research and enable faster insights for customers in the life sciences industry (Thermo Fisher Scientific Press Release, 2024).
- In February 2025, Qiagen, a German bioinformatics company, completed the acquisition of Bioinformatics Solutions Inc. (BSI), a US-based bioinformatics software provider. This acquisition strengthens Qiagen's position in the market and expands its offerings in the areas of data analysis and interpretation (Qiagen Press Release, 2025).
- In May 2025, the European Union's Horizon Europe research and innovation program allocated €1.1 billion to the European Open Science Cloud (EOSC) initiative. EOSC aims to create a digital research infrastructure for open and seamless services and tools in Europe, including those in the bioinformatics domain (European Commission Press Release, 2025).
Dive into Technavio’s robust research methodology, blending expert interviews, extensive data synthesis, and validated models for unparalleled Bioinformatics Market insights. See full methodology.
|
Market Scope |
|
|
Report Coverage |
Details |
|
Page number |
220 |
|
Base year |
2024 |
|
Historic period |
2019-2023 |
|
Forecast period |
2025-2029 |
|
Growth momentum & CAGR |
Accelerate at a CAGR of 17.4% |
|
Market growth 2025-2029 |
USD 15978 million |
|
Market structure |
Fragmented |
|
YoY growth 2024-2025(%) |
14.8 |
|
Key countries |
US, Germany, Canada, UK, China, France, Japan, Italy, India, and Mexico |
|
Competitive landscape |
Leading Companies, Market Positioning of Companies, Competitive Strategies, and Industry Risks |
Why Choose Technavio for Bioinformatics Market Insights?
"Leverage Technavio's unparalleled research methodology and expert analysis for accurate, actionable market intelligence."
The market is experiencing robust growth as businesses and research institutions increasingly leverage advanced computational tools to analyze and interpret complex biological data. Protein structure prediction algorithms and RNA sequencing data processing are key applications driving market expansion, with a recent study estimating that the former segment is growing at a faster rate than the latter, accounting for over 25% of the total the market share. Genome-wide association studies (GWAS) and metagenomic data analysis pipelines are other significant market segments, with GWAS design requiring stringent compliance with regulatory standards, leading to a higher demand for specialized bioinformatics solutions. Microbial community structure analysis and drug target identification methods are also gaining traction, with the latter benefiting from the integration of molecular dynamics simulation parameters and high-throughput screening technologies. Biomarker discovery using machine learning algorithms and gene expression regulation analysis are crucial applications in clinical bioinformatics, where accurate and timely data interpretation can significantly impact patient outcomes. Protein-protein interaction networks, phylogenetic tree construction methods, and sequence alignment algorithm comparison are essential components of systems biology modeling approaches and comparative genomics studies. Bioimage analysis techniques and chemoinformatics data analysis are essential for translating biological data into actionable insights, with the former segment expected to grow at a CAGR of over 15% due to the increasing adoption of automated imaging systems in research and clinical settings. Gene expression regulation analysis and functional genomics experiment design are also critical areas of investment for businesses seeking to optimize their operational planning and supply chain management by leveraging the latest bioinformatics tools and techniques.
What are the Key Data Covered in this Bioinformatics Market Research and Growth Report?
-
What is the expected growth of the Bioinformatics Market between 2025 and 2029?
-
USD 15.98 billion, at a CAGR of 17.4%
-
-
What segmentation does the market report cover?
-
The report is segmented by Application (Molecular phylogenetics, Transcriptomic, Proteomics, and Metabolomics), Product (Platforms, Tools, and Services), End-user (Pharmaceutical and biotechnology companies, CROs and research institutes, and Others), and Geography (North America, Europe, Asia, and Rest of World (ROW))
-
-
Which regions are analyzed in the report?
-
North America, Europe, Asia, and Rest of World (ROW)
-
-
What are the key growth drivers and market challenges?
-
Reduction in cost of genetic sequencing, Shortage of trained laboratory professionals
-
-
Who are the major players in the Bioinformatics Market?
-
Agilent Technologies Inc., Azenta US Inc, Bio Rad Laboratories Inc., Biomax Informatics AG, DNASTAR Inc., Eurofins Scientific SE, Fios Genomics Ltd., Genedata AG, Geneva Bioinformatics SA, Illumina Inc., Partek Inc., Precigen Inc., QIAGEN N.V., Quest Diagnostics Inc., Revvity Inc., Seven Bridges Genomics Inc., Source BioScience, Thermo Fisher Scientific Inc., Waters Corp., and ZS Associates Inc.
-
We can help! Our analysts can customize this bioinformatics market research report to meet your requirements.
 RIA -
RIA - 
