
Biological Control Market Size 2024-2028
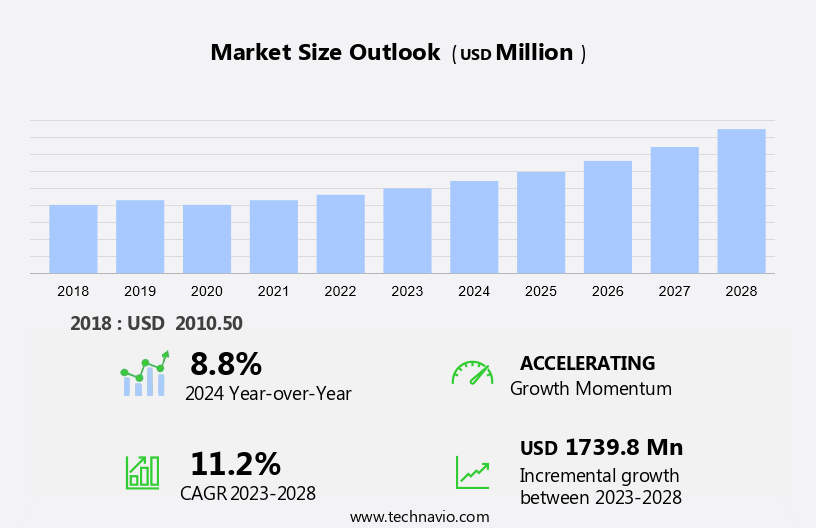
The biological control market size is forecast to increase by USD 1.74 billion at a CAGR of 11.2% between 2023 and 2028.
- The market is experiencing significant growth due to the rise in organic farming and the adoption of advanced technologies such as the Internet of Things and Artificial intelligence in insect pest management. Organic farming, which avoids synthetic fertilizers and pesticides, is gaining popularity among consumers who prioritize health and environmental sustainability. This trend is driving the demand for effective biological control methods. Furthermore, the implementation of IoT and AI-based technologies in insect pest control is revolutionizing the industry by enabling real-time monitoring and precise application of control agents. However, the slow response time to control pests remains a challenge for the market, necessitating continuous research and development of more efficient biological control solutions. Overall, the market is expected to witness steady growth In the coming years as these trends continue to shape the agricultural landscape.
What will be the Size of the Biological Control Market During the Forecast Period?
- The market encompasses a range of crop protection solutions, including biopesticides derived from natural sources such as microbials, biochemicals, and semiochemicals. These environmentally friendly alternatives to synthetic agrochemicals have gained significant traction due to increasing concerns over pest proliferation, pesticide hazards, and environmental sustainability. Biological control agents, including macrobials and microbial pesticides, have proven effective against various pests, such as Botrytis cinerea, and offer solutions for balanced plant nutrition and Seed treatment. The organic food demand and food security concerns further fuel the market's growth. Climate change and its impact on agricultural productivity also contribute to the market's direction.
- Biological control products, including biofungicides and biochemicals, cater to the certification requirements of organic cultivation and offer solutions for cereal and grains, fruits, and vegetables. Overall, the market continues to expand as a crucial component of sustainable agricultural practices.
How is this Biological Control Industry segmented and which is the largest segment?
The industry research report provides comprehensive data (region-wise segment analysis), with forecasts and estimates in "USD billion" for the period 2024-2028, as well as historical data from 2018-2022 for the following segments.
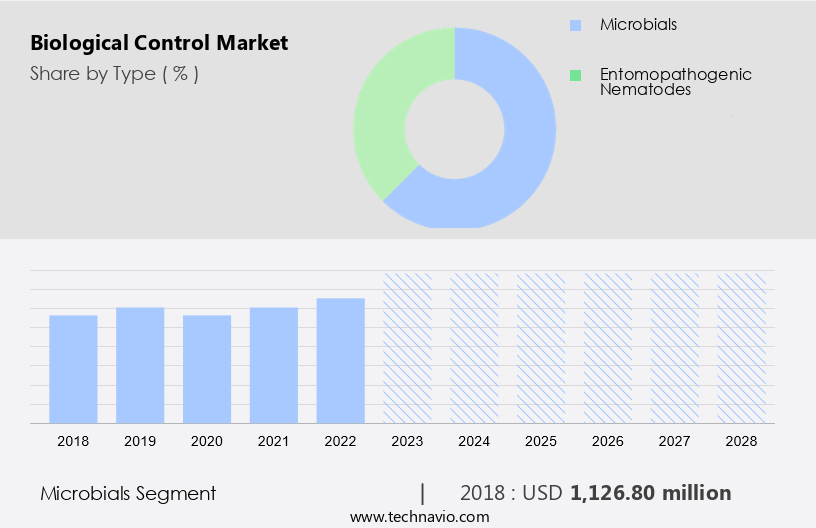
- Type
- Microbials
- Entomopathogenic nematodes
- Geography
- North America
- Canada
- US
- APAC
- China
- Europe
- France
- Italy
- Spain
- South America
- Middle East and Africa
- North America
By Type Insights
The microbials segment is estimated to witness significant growth during the forecast period. Microbes, also referred to as microorganisms, play a significant role in biological control, a natural approach to managing pests and diseases in agriculture. Biocontrol employs the use of biocontrol agents, which are typically beneficial microbes, to eliminate pests through predation and parasitism. This method is more reliable and healthier than relying on synthetic pesticides and chemicals, reducing risks of soil contamination and health hazards. Biocontrol agents include various microbes, such as bacteria, which are effective in controlling insects and diseases. Biochemicals, semiochemicals, and natural sources are other components of the market. This environmentally sustainable method aligns with the increasing demand for organic food and food safety.
However, with the impact of pest proliferation, climate change, and agricultural productivity, the need for effective and eco-friendly crop protection solutions is crucial. Biocontrol agents, such as microbial biocontrol, are gaining popularity in horticulture crops, fresh food production, and agricultural processing. Mass monitoring and certification are essential for economic swings and maintaining organic standards.
Get a glance at the market report of share of various segments Request Free Sample
The Microbials segment was valued at USD 1.13 billion in 2018 and showed a gradual increase during the forecast period.
Regional Analysis
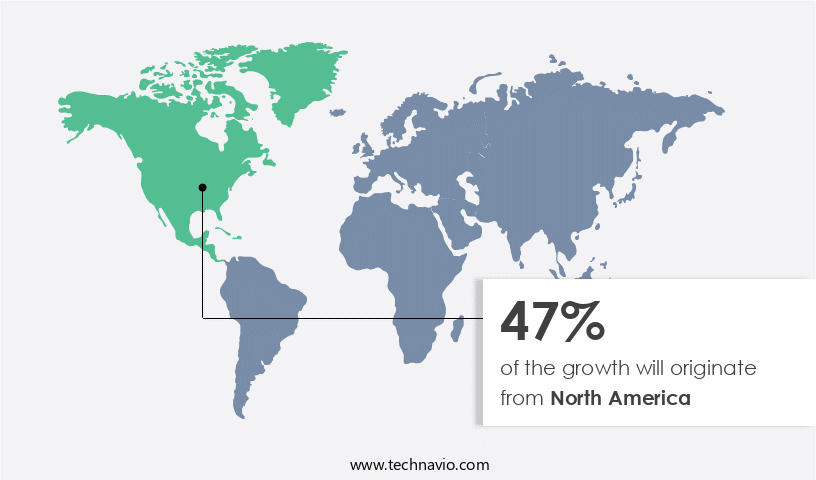
North America is estimated to contribute 47% to the growth of the global market during the forecast period. Technavio's analysts have elaborately explained the regional trends and drivers that shape the market during the forecast period.
For more insights on the market size of various regions, Request Free Sample
The market in North America is expected to dominate the global landscape due to the region's vast fertile land and early adoption of organic farming practices. The United States, with over half of the market share, leads the North American market. Key players are strategically located In the region to cater to the growing demand for environmentally friendly pest control solutions. The market's growth is driven by the increasing preference for organic food and the push for sustainable crop protection technology. Biological control agents, including biopesticides, semiochemicals, microbials, and bio fungicides, are gaining popularity as they offer safer alternatives to synthetic pesticides. These products help maintain balanced plant nutrition, increase crop yield, and ensure food safety. Additionally, the use of biocontrol agents in horticulture crops, mass monitoring, and economic swings contribute to the market's expansion. The market is poised for significant growth due to its role in addressing pest proliferation, climate change, and crop diseases while minimizing contamination risks and ensuring agricultural productivity.
Market Dynamics
Our researchers analyzed the data with 2023 as the base year, along with the key drivers, trends, and challenges. A holistic analysis of drivers will help companies refine their marketing strategies to gain a competitive advantage.
What are the key market drivers leading to the rise In the adoption of Biological Control Industry?
- Increase in organic farming is the key driver of the market. The market is experiencing significant growth due to the increasing demand for environmentally friendly crop protection solutions. Biopesticides, derived from natural sources such as microbials, biochemicals, and semiochemicals, are gaining popularity as they offer a more sustainable alternative to synthetic agrochemicals. These biopesticides are often more specific In their targeting, affecting only the intended pest and minimally impacting other organisms. This is in contrast to synthetic pesticides, which can pose hazards to non-target organisms such as birds, insects, and mammals. The ease of handling characteristics of biopesticides, including low-to-no re-entry intervals and post-harvest intervals, make them an attractive option for farmers.
- This is particularly important for horticulture crops, where fresh food production is a priority. Additionally, the organic food market's continued growth, driven by consumer demand for food safety and environmental sustainability, is fueling the demand for biopesticides in organic cultivation. Despite these advantages, the market faces challenges such as pest proliferation, climate change, and crop diseases, which can impact agricultural productivity and crop yield. However, the development of biocontrol agents and biological products offers a promising solution to these challenges. The use of mass monitoring techniques, such as pheromone traps, and economic swings In the market for crop protection products will also impact the market's growth during the forecast period.
What are the market trends shaping the Biological Control Industry?
- The adoption of IoT and AI-based technologies in insect pest control is the upcoming market trend. The market encompasses crop protection solutions that utilize biopesticides, semiochemicals derived from natural sources, microbials, and biochemicals. These environmentally friendly alternatives to synthetic agrochemicals address pest proliferation and crop diseases, ensuring food safety and organic food demand. With climate change increasing pest susceptibility and contamination risks, the need for effective and sustainable solutions is paramount. IPM, an integrated approach to pest control, employs biological agents like predators and microbes, foliar sprays, traps (including pheromone traps), and synthetic pheromones. AI and IoT technologies have significantly enhanced IPM by providing real-time monitoring and analysis, enabling mass monitoring and economic swings in crop protection.
- Biological control agents, such as microbial pesticides, offer an organic solution to pest resistance and organic farming standards. Fresh food production relies on these biological products to maintain crop yield and ensure balanced plant nutrition. Biofungicides, for instance, combat diseases like Botrytis cinerea, while biocontrol agents protect against various pests.
What challenges does the Biological Control Industry face during its growth?
- Slow response time to control pests is a key challenge affecting the industry's growth. The market encompasses the use of biopesticides as crop protection solutions against various pests, including weeds, plant diseases, insects, and vertebrates. Biopesticides are derived from natural sources such as animals, plants, microbes, and minerals. Biochemical pesticides are a subset of biopesticides, consisting of naturally occurring compounds that manage pests through non-toxic means. These include pheromones that disrupt insect mating and fragrant plant extracts that attract insect pests to traps. However, identifying whether a molecule qualifies as a biochemical pesticide can be challenging. Biological control methods and agents vary depending on the pest, with microbial biocontrol agents being particularly effective against plant diseases.
- Biochemical pesticides offer environmental sustainability and food safety benefits, aligning with the growing demand for organic food and the need to mitigate pesticide hazards. Agricultural productivity is also impacted by pest susceptibility, climate change, and crop diseases, which can lead to contamination and reduced crop yield. Synthetic agrochemicals, while effective, have faced scrutiny due to their potential hazards. Biological control products, including biofungicides and microbial pesticides, provide an environmentally friendly alternative to chemical inputs, contributing to balanced plant nutrition and organic cultivation. Fresh food production relies on biocontrol agents and biological products to maintain crop health and ensure food security.
Exclusive Customer Landscape
The market forecasting report includes the adoption lifecycle of the market, covering from the innovator's stage to the laggard's stage. It focuses on adoption rates in different regions based on penetration. Furthermore, the market report also includes key purchase criteria and drivers of price sensitivity to help companies evaluate and develop their market growth analysis strategies.
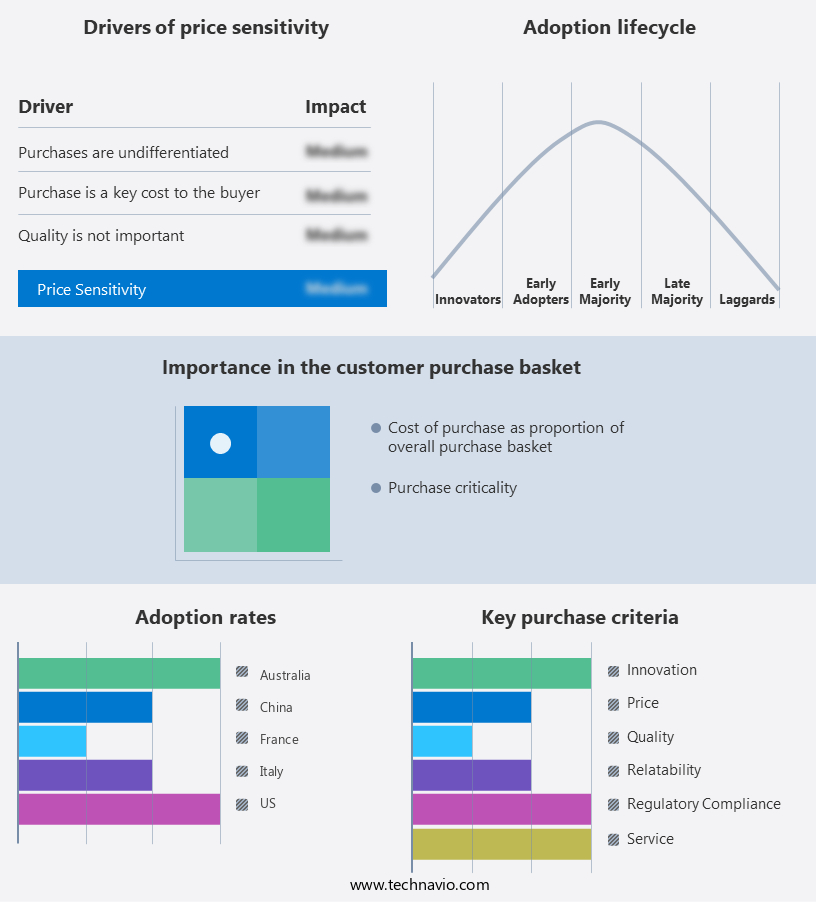
Customer Landscape
Key Companies & Market Insights
Companies are implementing various strategies, such as strategic alliances, market forecast, partnerships, mergers and acquisitions, geographical expansion, and product/service launches, to enhance their presence In the industry.
The industry research and growth report includes detailed analyses of the competitive landscape of the market and information about key companies, including:
- Andermatt Biocontrol UK Ltd.
- BASF SE
- Bayer AG
- Biobest Group NV
- CBC Co. Ltd.
- Chr Hansen AS
- Corteva Inc.
- Isagro Spa
- Koppert Biological Systems
- Lallemand Inc.
- Manidharma Biotech Pvt. Ltd.
- Mitsui and Co. Ltd.
- Novozymes AS
- Precision Laboratories LLC
- Syngenta Crop Protection AG
- Valent BioSciences LLC
- Verdesian Life Sciences LLC
- Vestaron Corp.
- VIRIDAXIS SA
Qualitative and quantitative analysis of companies has been conducted to help clients understand the wider business environment as well as the strengths and weaknesses of key industry players. Data is qualitatively analyzed to categorize companies as pure play, category-focused, industry-focused, and diversified; it is quantitatively analyzed to categorize companies as dominant, leading, strong, tentative, and weak.
Research Analyst Overview
The market encompasses a range of crop protection solutions that leverage natural sources to manage pests and diseases, enhance agricultural productivity, and promote environmental sustainability. This market includes various categories such as biopesticides, semiochemicals, microbials, and biochemicals. Biopesticides are derived from natural sources and function as alternatives to synthetic agrochemicals. They offer several advantages, including reduced environmental impact, improved target specificity, and lower risks to non-target organisms. Semiochemicals, on the other hand, are naturally occurring or synthetic substances that interfere with the communication between pests, providing an effective means of pest control. Microbials and macrobials are essential components of the market.
Moreover, microbials consist of microorganisms, such as bacteria and fungi, that can be used to control pests and diseases. Macrobials, also known as biocontrol agents, are larger organisms, such as insects, mites, and nematodes, that help manage pests and enhance crop health. Environmental sustainability and food safety are key drivers of the market. The increasing demand for organic food and the growing awareness of the hazards associated with synthetic agrochemicals have led to a rise in the adoption of biological control solutions. Organic cultivation, which relies on natural methods for pest control, has gained significant traction in recent years. Pest proliferation and climate change pose significant challenges to agricultural productivity, making the need for effective and environmentally friendly pest control solutions more pressing than ever.
Furthermore, crop diseases and contamination are major concerns for farmers and food processors, and biological control solutions offer a viable alternative to synthetic pesticides. The market caters to various crops, including horticulture crops, cereals and grains, and others. Foliar sprays, traps, and pheromone traps are some of the commonly used biological control methods. Mass monitoring and economic swings are critical factors influencing market dynamics. The use of biological control products is not limited to agricultural applications. They are also used in fresh food production, where the demand for clean and safe food is high. The certification process for organic farming and adherence to organic standards are essential aspects of the market.
|
Market Scope |
|
|
Report Coverage |
Details |
|
Page number |
158 |
|
Base year |
2023 |
|
Historic period |
2018-2022 |
|
Forecast period |
2024-2028 |
|
Growth momentum & CAGR |
Accelerate at a CAGR of 11.2% |
|
Market Growth 2024-2028 |
USD 1.74 billion |
|
Market structure |
Fragmented |
|
YoY growth 2023-2024(%) |
8.8 |
|
Key countries |
US, Australia, China, Italy, France, Spain, Indonesia, Canada, Greece, and Malaysia |
|
Competitive landscape |
Leading Companies, Market Positioning of Companies, Competitive Strategies, and Industry Risks |
What are the Key Data Covered in this Biological Control Market Research and Growth Report?
- CAGR of the Biological Control industry during the forecast period
- Detailed information on factors that will drive the market growth and forecasting between 2024 and 2028
- Precise estimation of the size of the market and its contribution of the industry in focus to the parent market
- Accurate predictions about upcoming growth and trends and changes in consumer behaviour
- Growth of the market across North America, APAC, Europe, South America, and Middle East and Africa
- Thorough analysis of the market's competitive landscape and detailed information about companies
- Comprehensive analysis of factors that will challenge the biological control market growth of industry companies
We can help! Our analysts can customize this biological control market research report to meet your requirements.
 RIA -
RIA - 
