
Biometric POS Terminals Market Size 2025-2029
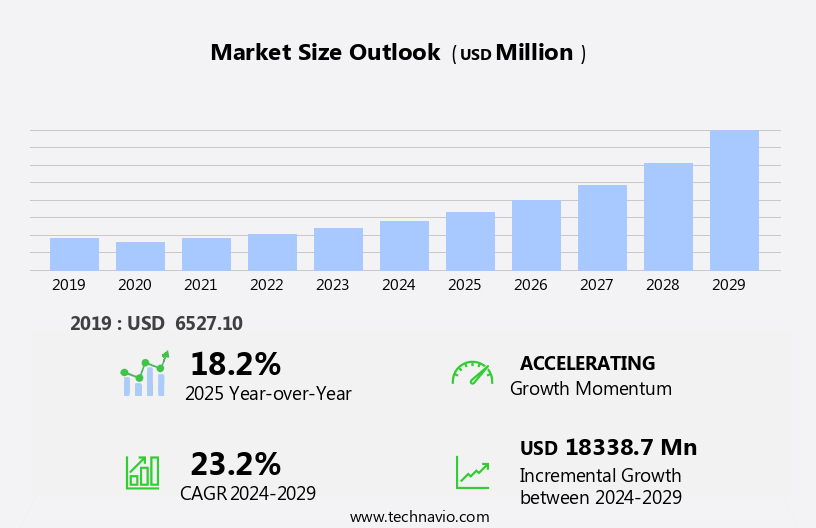
The biometric pos terminals market size is forecast to increase by USD 18.34 billion, at a CAGR of 23.2% between 2024 and 2029.
- The market is experiencing significant growth due to the increasing adoption of EMV (Europay, Mastercard, and Visa) standards for secure payment transactions. This shift towards more secure payment solutions is driving the demand for biometric POS terminals, which offer enhanced security features through the use of unique biometric data for authentication. Additionally, the growth in adoption of self-service kiosks in various industries, including retail and hospitality, is creating new opportunities for biometric POS terminals. However, the absence of uniform standards in The market poses a significant challenge. Companies must navigate the fragmented landscape and ensure compatibility with various biometric technologies and protocols to effectively capitalize on market opportunities.
- To remain competitive, it is essential for market players to focus on developing interoperable solutions and collaborating with industry partners to address the challenges of standardization and interoperability. By doing so, they can effectively cater to the growing demand for secure and convenient payment solutions and capture a larger share of the market.
What will be the Size of the Biometric POS Terminals Market during the forecast period?
Explore in-depth regional segment analysis with market size data - historical 2019-2023 and forecasts 2025-2029 - in the full report.
Request Free Sample
The market continues to evolve, driven by advancements in technology and the expanding application across various sectors. Employee time and attendance management, retail and hospitality industries, and government and public sector are among the key verticals adopting these systems. Biometric authentication methods, such as fingerprint scanning and palm vein scanning, ensure secure and efficient user experience. Deep learning and artificial intelligence (AI) are integral to these systems, enabling real-time transaction security, fraud prevention, and customer verification. Voice recognition and facial recognition add an additional layer of security, while iris recognition and spoof detection enhance accuracy. Compliance regulations, system maintenance, and data privacy are critical concerns, with data encryption, API integration, and machine learning playing essential roles in addressing these issues.
Loyalty programs and customer engagement are also key applications, with hardware platforms offering wireless connectivity and on-premise or cloud-based deployment options. Cost optimization, technical support, and training & implementation are crucial for market adoption. Biometric data management and data storage solutions ensure data protection and enable retail analytics, payment processing, and inventory management. Emerging technologies, such as multi-factor authentication and computer vision, further expand the market's potential. The market's continuous dynamism is reflected in its ongoing adoption across various industries, with financial services and access control being the latest additions. ROI analysis and deployment strategies remain vital for businesses considering implementation.
How is this Biometric POS Terminals Industry segmented?
The biometric pos terminals industry research report provides comprehensive data (region-wise segment analysis), with forecasts and estimates in "USD million" for the period 2025-2029, as well as historical data from 2019-2023 for the following segments.
- End-user
- Retail
- Medical and healthcare
- Restaurant
- Financial
- Others
- Technology
- Fingerprint identification
- Palm vein identification
- Others
- Type
- Standalone POS terminals
- Integrated POS terminals
- Sector
- Large enterprises
- SMEs
- Geography
- North America
- US
- Canada
- Europe
- France
- Germany
- Italy
- The Netherlands
- UK
- APAC
- China
- India
- Japan
- Rest of World (ROW)
- North America
.
By End-user Insights
The retail segment is estimated to witness significant growth during the forecast period.
The market encompasses various industries, with retail and hospitality being significant sectors. In these segments, biometric POS terminals enhance user experience by offering quick and secure transactions through technologies like fingerprint scanning and facial recognition. Biometric authentication ensures employee time & attendance accuracy and reduces the risk of fraud. Retail analytics and inventory management are streamlined with these terminals, enabling businesses to optimize costs and make informed decisions. Deep learning and machine learning technologies integrated into biometric POS terminals provide advanced security features, such as spoof detection and liveness detection. Technical support and system maintenance ensure seamless operations.
Compliance with security standards and data protection regulations are crucial, with data encryption and data privacy being essential considerations. Government and public sector organizations also utilize biometric POS terminals for access control and customer verification. Financial services and emerging technologies like artificial intelligence, computer vision, and mobile payments are transforming the market. Biometric sensors and cloud-based services are integral to the market's growth. Biometric POS terminals are integrated with point-of-sale systems, enabling multi-factor authentication, loyalty programs, and real-time transaction processing. Wireless connectivity and API integration facilitate seamless integration with existing systems. Training and implementation are crucial for market adoption, with software solutions and hardware platforms catering to diverse industry verticals.
Market dynamics include cost optimization, transaction security, and the need for user-friendly interfaces. Biometric data management and biometric sensor technologies are evolving to meet the demands of various industries. The market's future growth is driven by the increasing adoption of biometric technologies and the need for enhanced security and convenience.
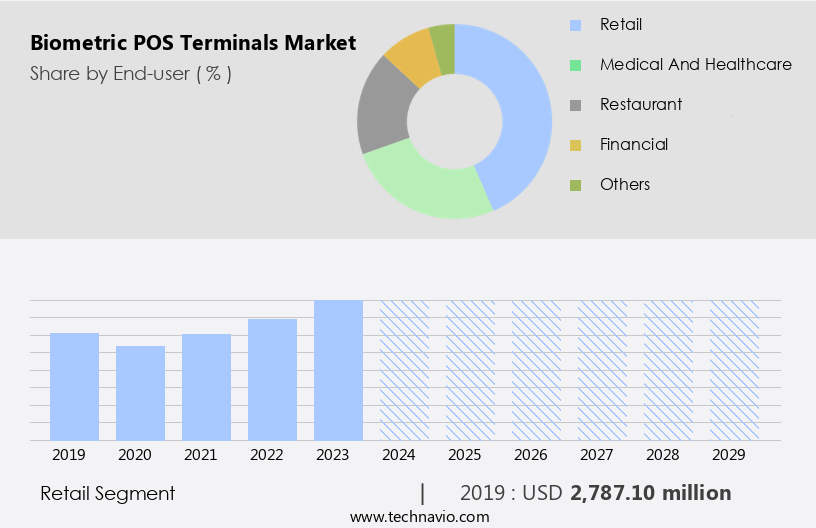
The Retail segment was valued at USD 2.79 billion in 2019 and showed a gradual increase during the forecast period.
Regional Analysis
North America is estimated to contribute 38% to the growth of the global market during the forecast period.Technavio's analysts have elaborately explained the regional trends and drivers that shape the market during the forecast period.
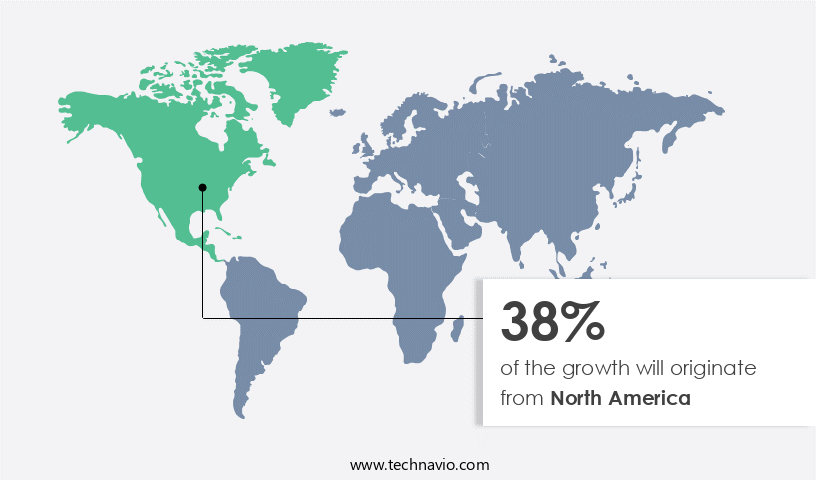
The market is witnessing significant growth, particularly in North America, due to the extensive use of credit and debit cards and the resulting security concerns. With the increasing number of cyberattacks, companies in this region are prioritizing transaction security to prevent fraudulent activities and protect customer data. Biometric authentication, such as fingerprint scanning and facial recognition, is becoming increasingly popular for secure point-of-sale transactions. Additionally, deep learning algorithms and artificial intelligence are being integrated into POS systems to enhance security and prevent spoofing. Retail and hospitality industries are also adopting biometric POS terminals for employee time and attendance management and customer verification.
The market is also witnessing the integration of biometric sensors into various hardware platforms, including mobile devices and cloud-based services, for contactless and convenient transactions. Furthermore, compliance regulations and security standards are driving the adoption of biometric POS terminals in the government and public sector. Technical support and training & implementation services are crucial for the successful deployment of these systems. Biometric data management and data privacy are also important considerations for market adoption. Market dynamics are further influenced by the integration of retail analytics, loyalty programs, and payment processing into biometric POS systems. Emerging technologies, such as machine learning and computer vision, are also contributing to the market's growth. Overall, the market is expected to continue its steady growth due to the increasing demand for secure and convenient transactions.
Market Dynamics
Our researchers analyzed the data with 2024 as the base year, along with the key drivers, trends, and challenges. A holistic analysis of drivers will help companies refine their marketing strategies to gain a competitive advantage.
What are the key market drivers leading to the rise in the adoption of Biometric POS Terminals Industry?
- The increasing adoption of EMV (Europay, Mastercard, and Visa) standards is a primary factor propelling market growth. EMV is a global standard for ensuring secure and authentic credit and debit card transactions. Its implementation is mandatory in many regions to mitigate fraud and enhance security in financial transactions. Therefore, the widespread acceptance of EMV technology is driving market expansion.
- Biometric Point-of-Sale (POS) terminals have gained significant traction in the market due to their ability to enhance customer verification and transaction security. These advanced systems utilize various biometric technologies, such as palm vein scanning and facial recognition, for multi-factor authentication, providing an additional layer of security. Hardware platforms for biometric POS terminals offer features like data storage and wireless connectivity, enabling seamless integration with mobile payments. Government and public sectors have been early adopters of biometric POS terminals for security reasons. Biometric data management and artificial intelligence (AI) are integral components of these systems, ensuring accurate and efficient customer identification.
- The transaction security offered by biometric POS terminals is crucial in preventing fraud and maintaining trust between businesses and their customers. The Europay, Mastercard, and Visa (EMV) standard, which ensures secure payment transactions between chip-based payment cards and POS terminals, has become a norm in the industry. The dynamic code generation during every transaction when an EMV card is inserted into a biometric POS terminal is a significant advantage, making it nearly impossible for hackers to decode and retrieve customer information. Overall, the integration of biometric technologies into POS systems is a game-changer in the financial sector, providing a more secure and convenient payment experience for customers.
What are the market trends shaping the Biometric POS Terminals Industry?
- Self-service kiosks are increasingly being adopted in various industries, marking a significant market trend. This growth is driven by the convenience and efficiency they offer to customers and businesses alike.
- Biometric POS terminals are gaining traction in the self-service market, particularly in retail check-outs and kiosks. These terminals, which consist of specialized hardware and software, offer quick and accurate transactions through various biometric authentication methods, such as palm vein scanning and fingerprint recognition. As the self-service market expands, there is an increasing demand for secure and efficient transactions. Security is a crucial factor in the adoption of biometric POS terminals. These terminals employ advanced security features, including liveness detection, spoof detection, and iris recognition, to ensure the authenticity of transactions. Furthermore, they adhere to industry security standards and compliance regulations, such as PCI DSS, to protect customer data privacy.
- Moreover, biometric POS terminals offer software solutions for loyalty programs, enabling businesses to enhance customer engagement and retention. System maintenance and data protection are also essential aspects of these terminals, ensuring seamless operations and data security. In conclusion, the growth of the self-service market presents significant opportunities for biometric POS terminals. Their ability to provide quick, accurate, and secure transactions, along with additional features like loyalty programs, make them an attractive solution for various industry verticals.
What challenges does the Biometric POS Terminals Industry face during its growth?
- The absence of uniform standards in the global biometric Point of Sale (POS) terminals market poses a significant challenge, impeding industry growth by introducing inconsistencies in technology, functionality, and user experience.
- Biometric POS terminals, which integrate machine learning, computer vision, and biometric sensors for payment processing and access control, are gaining traction in the financial services industry due to emerging technologies. However, the lack of standardization in these systems poses a significant challenge for interoperability. Interoperability is crucial for seamless integration and upgrades, ensuring minimal disruption to business operations. Without standardization, firms face difficulties in ensuring their biometric POS terminals work harmoniously with other systems. This issue can result in prolonged resolution times and increased operational costs. Moreover, cloud-based services and on-premise deployment options further complicate the situation.
- Firms must consider the return on investment (ROI) analysis of each deployment model and the impact on inventory management and data security. Biometric POS terminals offer enhanced customer engagement and data security, but the lack of standardization can hinder these benefits. As the market continues to evolve, it is essential for stakeholders to prioritize standardization to enable seamless integration and maximize the potential of biometric POS terminals in the financial services sector.
Exclusive Customer Landscape
The biometric pos terminals market forecasting report includes the adoption lifecycle of the market, covering from the innovator's stage to the laggard's stage. It focuses on adoption rates in different regions based on penetration. Furthermore, the biometric pos terminals market report also includes key purchase criteria and drivers of price sensitivity to help companies evaluate and develop their market growth analysis strategies.

Customer Landscape
Key Companies & Market Insights
Companies are implementing various strategies, such as strategic alliances, biometric pos terminals market forecast, partnerships, mergers and acquisitions, geographical expansion, and product/service launches, to enhance their presence in the industry.
Aratek Biometric - The company specializes in advanced biometric Point of Sale (POS) terminal solutions, including the Marshall 8 Plus, Marshall 8, and BM5510 models. These terminals utilize cutting-edge technology to enhance security and streamline transactions. By integrating biometric authentication, businesses can minimize fraud and improve efficiency. The company's commitment to innovation and quality ensures that its POS terminals meet the evolving needs of modern commerce. With a focus on user-friendly design and robust functionality, these terminals provide an essential tool for businesses seeking to optimize their operations.
The industry research and growth report includes detailed analyses of the competitive landscape of the market and information about key companies, including:
- Aratek Biometric
- BIYO LLC
- CiVinTec Global Co. Ltd.
- DERMALOG Identification Systems GmbH
- EKEMP Intl Ltd.
- ePortation Inc.
- Fujitsu Ltd.
- HID Global Corp.
- IDEMIA France SAS
- Ingenico Group SA
- International Secure Environments PTY LTD.
- M2SYS
- Mantra Softech India Pvt. Ltd.
- PayTango Inc.
- SmartMetric Inc.
- Sthaler Ltd.
- Telepower Communication Co. Ltd.
- VeriFone Inc.
- Verifi Inc.
- Zwipe AS
Qualitative and quantitative analysis of companies has been conducted to help clients understand the wider business environment as well as the strengths and weaknesses of key industry players. Data is qualitatively analyzed to categorize companies as pure play, category-focused, industry-focused, and diversified; it is quantitatively analyzed to categorize companies as dominant, leading, strong, tentative, and weak.
Recent Development and News in Biometric POS Terminals Market
- In March 2024, Ingenico Group, a leading global payment solutions provider, announced the launch of their new biometric Point of Sale (POS) terminal, the Telium Tetra BLE, equipped with a built-in fingerprint reader (Ingenico Group press release). This innovation aims to enhance security and streamline checkout processes for retailers and consumers.
- In August 2024, Mastercard and Microsoft entered into a strategic partnership to integrate Mastercard's biometric identification technology into Microsoft's Azure IoT Edge platform. This collaboration is expected to accelerate the adoption of biometric POS terminals, enabling contactless and secure transactions (Mastercard newsroom).
- In January 2025, Fujitsu Frontech North America, a leading provider of biometric solutions, secured a significant contract with a major retailer to deploy its biometric POS terminals across all stores. This expansion is projected to boost the market penetration of biometric technology in the retail sector (Fujitsu Frontech North America press release).
- In May 2025, NXT-ID, a biometric authentication company, announced the successful deployment of its Wocket⢠smart wallet, which includes a biometric POS terminal. This breakthrough marks a significant advancement in the convergence of biometric authentication and contactless payments (NXT-ID press release).
Research Analyst Overview
- The market is experiencing significant growth as businesses seek to enhance security and streamline operations. Market research indicates a rising demand for advanced surveillance systems, integrating AI-powered security features such as facial recognition software and self-service kiosks. Access control systems and identity management solutions are also gaining popularity, with digital identity becoming a priority for data breach prevention. SDK integration allows for seamless implementation of biometric APIs in security cameras and mobile POS terminals, enabling real-time verification for employee management and automated check-in.
- Competitor analysis reveals a trend towards the integration of biometric security solutions in smart cities, digital signage, and interactive kiosks, offering offline authentication for improved convenience and efficiency. Overall, the market is evolving to meet the demands of modern businesses, offering innovative solutions for HR, customer analytics, and offline authentication.
Dive into Technavio's robust research methodology, blending expert interviews, extensive data synthesis, and validated models for unparalleled Biometric POS Terminals Market insights. See full methodology.
|
Market Scope |
|
|
Report Coverage |
Details |
|
Page number |
236 |
|
Base year |
2024 |
|
Historic period |
2019-2023 |
|
Forecast period |
2025-2029 |
|
Growth momentum & CAGR |
Accelerate at a CAGR of 23.2% |
|
Market growth 2025-2029 |
USD 18338.7 million |
|
Market structure |
Fragmented |
|
YoY growth 2024-2025(%) |
18.2 |
|
Key countries |
US, Germany, UK, France, Italy, Canada, The Netherlands, Japan, China, and India |
|
Competitive landscape |
Leading Companies, Market Positioning of Companies, Competitive Strategies, and Industry Risks |
What are the Key Data Covered in this Biometric POS Terminals Market Research and Growth Report?
- CAGR of the Biometric POS Terminals industry during the forecast period
- Detailed information on factors that will drive the growth and forecasting between 2025 and 2029
- Precise estimation of the size of the market and its contribution of the industry in focus to the parent market
- Accurate predictions about upcoming growth and trends and changes in consumer behaviour
- Growth of the market across North America, Europe, APAC, Middle East and Africa, and South America
- Thorough analysis of the market's competitive landscape and detailed information about companies
- Comprehensive analysis of factors that will challenge the biometric pos terminals market growth of industry companies
We can help! Our analysts can customize this biometric pos terminals market research report to meet your requirements.