
Biotech Market Size 2025-2029
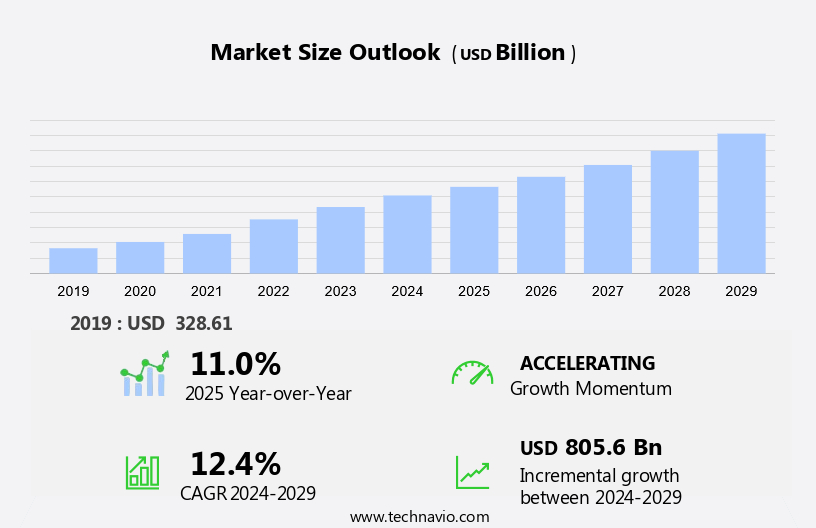
The biotech market size is forecast to increase by USD 805.6 billion at a CAGR of 12.4% between 2024 and 2029.
- The market is experiencing significant growth, driven by the increasing innovation and investment from market companies. These companies are expanding their research and development efforts to bring new products and technologies to market, addressing unmet medical needs and advancing scientific discoveries. However, this growth comes with challenges, primarily regulatory compliance. Stringent regulations governing the biotech industry ensure the safety and efficacy of products, but they also add costs and complexity to the development process. Biologics, comprised of monoclonal antibodies, vaccines, recombinant proteins, and cell and gene therapies, are derived from living organisms and cater to the treatment of numerous diseases, such as cancer, autoimmune disorders, and genetic conditions. Navigating these regulations requires the regulatory landscape and strategic planning.
- For companies seeking to capitalize on market opportunities and navigate challenges effectively, it is essential to stay informed of the latest regulatory trends and best practices. Additionally, collaboration with regulatory agencies and industry experts can help streamline the development process and bring products to market more efficiently. Overall, the market presents significant opportunities for growth, but companies must be prepared to navigate regulatory complexities and invest in innovation to stay competitive.
What will be the Size of the Biotech Market during the forecast period?
- The market encompasses a dynamic and innovative industry focused on advancing biological systems through engineering, gene therapies, and tissue culturing. This sector is driving progress in various areas, including medicine, environmental sustainability, and agriculture. Notable applications include the development of treatments for conditions such as HIV, diabetes, obesity, neurological disorders, and transfyretin amyloidosis. Significant investments continue to fuel market growth, with innovative companies spearheading clinical success in areas like personalized medicine and regeneration technologies. Biotech is also making strides in the production of genetically modified crops, leading to improved plant varieties and increased agricultural efficiency. Government support and approval processes are crucial components of the market's growth trajectory.
- Technological advancements, such as molecular breeding and cloning, are revolutionizing the way we approach challenges in healthcare and agriculture. The biotech industry's positive outcomes extend beyond the conventional plan, with potential solutions for societal issues like malaria and sedentary lifestyle-related diseases. Market revenue is expected to grow substantially as biotech continues to deliver breakthroughs in medicine, bio-pharmaceuticals, and bio-agriculture. The future of this sector is bright, as it continues to push the boundaries of science and technology to address some of the world's most pressing challenges.
How is this Biotech Industry segmented?
The biotech industry research report provides comprehensive data (region-wise segment analysis), with forecasts and estimates in "USD billion" for the period 2025-2029, as well as historical data from 2019-2023 for the following segments.
- Product
- Biologics
- Therapeutics
- Diagnostics
- Industrial biotechnology
- Others
- Type
- Red biotechnology
- White biotechnology
- Green biotechnology
- Grey biotechnology
- Others
- Geography
- North America
- US
- Canada
- Europe
- France
- Germany
- Sweden
- Switzerland
- UK
- Asia
- Rest of World (ROW)
- North America
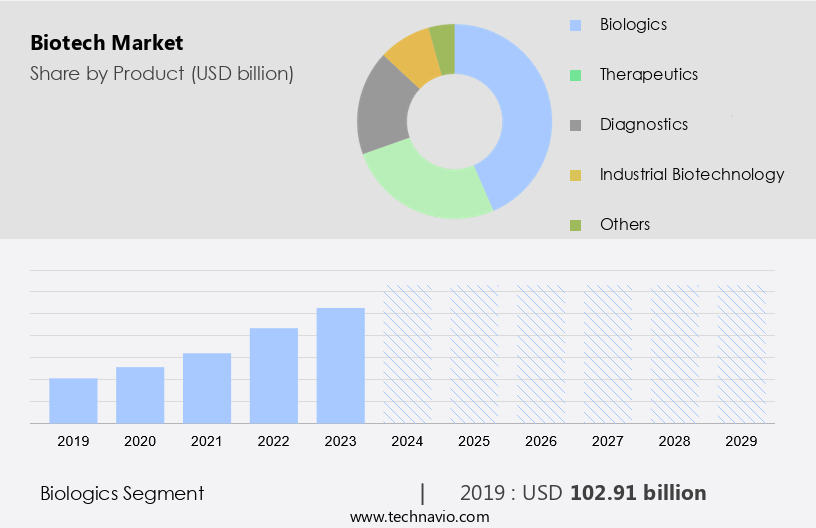
By Product Insights
The biologics segment is estimated to witness significant growth during the forecast period. The market encompasses a range of product categories, with biologics emerging as a key and expanding segment. In August 2023, Novartis finalized its acquisition of Chinook Therapeutics, Inc., a Seattle, WA-based biopharmaceutical company specializing in precision medicines for kidney diseases. Valued at up to USD 3.5 billion, this acquisition underscores the strategic significance of biologics within the global biotech sector. Biotechnology advancements in areas like gene editing, proteomics, and genomics continue to fuel innovation in disease treatment and prevention.
Biotech startups and established biopharma companies alike invest heavily in research and development, driving medical breakthroughs and healthcare solutions. The biotech industry's focus on patient care, disease management, and pharmaceutical innovation is transforming healthcare trends and improving health outcomes. Biotechnology education, policy, and regulation play crucial roles in fostering a sustainable and ethical industry.
Get a glance at the market report of share of various segments Request Free Sample
The biologics segment was valued at USD 102.91 billion in 2019 and showed a gradual increase during the forecast period.
Regional Analysis
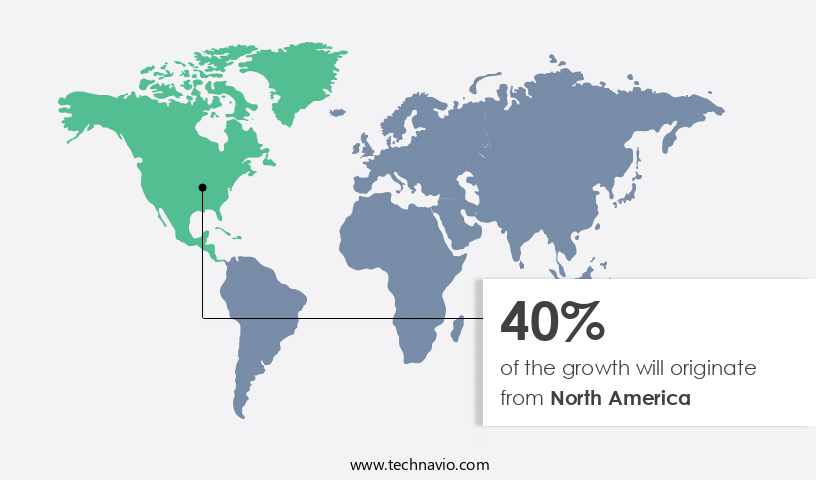
North America is estimated to contribute 40% to the growth of the global market during the forecast period. Technavio's analysts have elaborately explained the regional trends and drivers that shape the market during the forecast period.
For more insights on the market size of various regions, Request Free Sample
The North American market is witnessing notable expansion due to strong government backing and strategic partnerships among industry players. Notably, the Canadian government's 2024 Economic Statement introduced measures to expand investment capital and improve its utilization within the country. These initiatives were influenced by BIOTECanada's suggestions and aim to strengthen Canada's biotechnology sector through programs like the Scientific Research and Experimental Development (SR&ED), patent box incentives, and the Biomanufacturing and Life Sciences Strategy. The Economic Statement includes a substantial recapitalization of the Venture Capital Catalyst Initiative (VCCI), which is anticipated to significantly increase the availability of investment funds.
This growth is driven by a commitment to advancing biotechnology through policy and funding, with a focus on areas such as gene editing, cell therapy, and precision medicine. The biotech industry in North America continues to innovate, with breakthroughs in areas like genomics, clinical trials, and medical research funding contributing to improved health outcomes and disease management.
Market Dynamics
Our researchers analyzed the data with 2024 as the base year, along with the key drivers, trends, and challenges. A holistic analysis of drivers will help companies refine their marketing strategies to gain a competitive advantage.
What are the key market drivers leading to the rise in the adoption of Biotech Industry?
- The growing innovation by market players is the key driver of the market. The market is experiencing significant growth due to the innovative initiatives undertaken by companies. One such instance is Amgen's announcement in August 2024 to establish a new technology and innovation site in Hyderabad, India, named Amgen India. This facility aims to boost Amgen's digital capabilities, enabling it to accelerate drug discovery and development processes on a global scale.
- By focusing on digital innovation, Amgen intends to streamline operations, enhance efficiency, and foster the creation of novel therapies. This strategic move underscores the industry's commitment to leveraging technology to drive advancements in biotech.
What are the market trends shaping the Biotech Industry?
- The increasing investment by market players is the upcoming market trend. The market is experiencing substantial growth, fueled by increasing investments in research and development. One recent example is GlycoNet's commitment of approximately USD4.5 million to fund 21 research projects focusing on biological sugars.
- This initiative, which aims to address unresolved health issues, is further supported by significant co-investments from industry collaborators, health foundations, and business partners, totaling an additional USD 7.5 million. As a result, these projects are projected to receive a total investment of USD 12 million over the next two years. This trend reflects the growing recognition of biotech's potential to address critical health challenges and the increasing support from various stakeholders.
What challenges does the Biotech Industry face during its growth?
- The regulatory compliance associated with biotech is a key challenge affecting the industry growth. In The market, regulatory compliance poses a significant challenge for industry participants. Adhering to the evolving regulations and guidelines set forth by regulatory bodies such as the FDA and EMA is essential for ensuring the safety and efficacy of biotech products. To navigate this complex regulatory landscape, companies must implement quality control systems.
- These systems should include comprehensive quality assurance procedures, process validation, and meticulous documentation practices. Ensuring that all processes adhere to regulatory standards is crucial for maintaining compliance and the integrity of biotech operations. By prioritizing regulatory compliance, biotech companies can mitigate potential risks and build trust with regulatory agencies and consumers alike.
Exclusive Customer Landscape
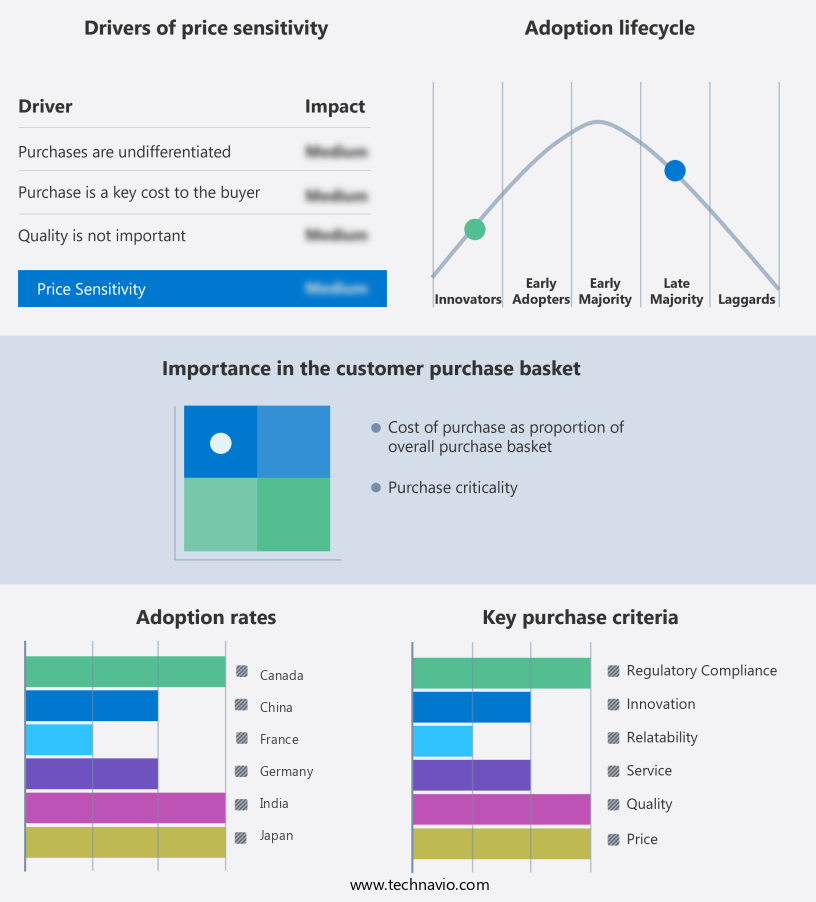
The biotech market forecasting report includes the adoption lifecycle of the market, covering from the innovator's stage to the laggard's stage. It focuses on adoption rates in different regions based on penetration. Furthermore, the biotech market report also includes key purchase criteria and drivers of price sensitivity to help companies evaluate and develop their market growth analysis strategies.
Customer Landscape
Key Companies & Market Insights
Companies are implementing various strategies, such as strategic alliances, biotech market forecast, partnerships, mergers and acquisitions, geographical expansion, and product/service launches, to enhance their presence in the industry.
The industry research and growth report includes detailed analyses of the competitive landscape of the market and information about key companies, including:
- AbbVie Inc.
- Amgen Inc.
- AstraZeneca Plc
- BeiGene Ltd.
- BioMarin Pharmaceutical Inc.
- BioNTech SE
- CSL Ltd.
- F. Hoffmann La Roche Ltd.
- Genmab AS
- Gilead Sciences Inc.
- Johnson and Johnson Inc.
- Moderna Inc.
- Novartis AG
- Novo Nordisk AS
- Pfizer Inc.
- Regeneron Pharmaceuticals Inc.
- Sanofi SA
- Takeda Pharmaceutical Co. Ltd.
- Thermo Fisher Scientific Inc.
- Vertex Pharmaceuticals Inc.
Qualitative and quantitative analysis of companies has been conducted to help clients understand the wider business environment as well as the strengths and weaknesses of key industry players. Data is qualitatively analyzed to categorize companies as pure play, category-focused, industry-focused, and diversified; it is quantitatively analyzed to categorize companies as dominant, leading, strong, tentative, and weak.
Research Analyst Overview
The market encompasses a broad spectrum of industries and technologies that leverage biological processes to develop innovative healthcare solutions and advance scientific research. This dynamic sector is characterized by its continuous evolution, driven by the convergence of various disciplines, including genetics, precision medicine, biostatistics, proteomics, and bioinformatics. Biotech companies are at the forefront of this revolution, focusing on disease management, drug discovery, and medical breakthroughs. Precision medicine, an emerging approach that utilizes an individual's genetic makeup to develop personalized treatments, is a significant area of investment and innovation. Immunotherapy, a form of treatment that harnesses the power of the immune system to fight diseases, has shown promising results in various clinical trials.
Medical devices and healthcare solutions are another critical component of the biotech industry. Advancements in biotechnology have led to the development of sophisticated medical devices and diagnostic tools, enabling early disease detection and improved patient care. Biotechnology is also playing a crucial role in disease prevention and public health, with a focus on data management and clinical data analysis. Biotech startups and emerging companies are driving innovation in various areas, including gene therapy, genome editing, cell therapy, and synthetic biology. These companies are pushing the boundaries of scientific research, developing novel technologies and applications that have the potential to transform the healthcare landscape.
The biopharma industry is a significant contributor to the market, with a focus on pharmaceutical innovation and biotechnology policy. Biotechnology education and ethics are also essential components of this sector, ensuring a skilled workforce and a responsible approach to scientific research and development. Biotechnology is not limited to healthcare applications. Agricultural biotechnology, for instance, is revolutionizing agriculture by developing disease-free banana varieties and herbicide-tolerant seeds. This sector is essential for ensuring food security and sustainability in an increasingly populated world. In summary, the market is a dynamic and evolving industry, driven by continuous innovation and the convergence of various disciplines. Biotechnology is transforming healthcare, agriculture, and various other sectors, offering numerous opportunities for investment, research, and career growth. The future of this industry is bright, with a focus on developing sustainable and responsible solutions that address the world's most pressing challenges.
Moreover, genetic engineering has revolutionized global health by enabling breakthroughs in health technology, clinical data analysis, and personalized medicine. Through advances in biomedical research and biotechnology, scientists are unlocking new treatments and therapies that promise to tackle complex diseases. The rise of biotechnology careers has created opportunities for professionals in fields like biotechnology patents, investment, and ethics. Biotechnology journals and regulatory bodies continue to explore the ethical implications of these innovations, ensuring sustainable practices in biotechnology agriculture, medicine, and the environment. PCR technologies and nucleic acid sequencing are critical tools in clinical diagnostics, driving biotechnology development and commercialization. As biotechnology continues to evolve, its applications in engineering, sustainability, and society highlight its transformative potential for both human health and the planet.
|
Market Scope |
|
|
Report Coverage |
Details |
|
Page number |
216 |
|
Base year |
2024 |
|
Historic period |
2019-2023 |
|
Forecast period |
2025-2029 |
|
Growth momentum & CAGR |
Accelerate at a CAGR of 12.4% |
|
Market growth 2025-2029 |
USD 805.6 billion |
|
Market structure |
Fragmented |
|
YoY growth 2024-2025(%) |
11.0 |
|
Key countries |
US, China, Germany, UK, Japan, France, India, Canada, Switzerland, and Sweden |
|
Competitive landscape |
Leading Companies, Market Positioning of Companies, Competitive Strategies, and Industry Risks |
What are the Key Data Covered in this Biotech Market Research and Growth Report?
- CAGR of the Biotech industry during the forecast period
- Detailed information on factors that will drive the growth and forecasting between 2025 and 2029
- Precise estimation of the size of the market and its contribution of the industry in focus to the parent market
- Accurate predictions about upcoming growth and trends and changes in consumer behaviour
- Growth of the market across North America, Europe, Asia, and Rest of World (ROW)
- Thorough analysis of the market's competitive landscape and detailed information about companies
- Comprehensive analysis of factors that will challenge the biotech market growth and forecasting
We can help! Our analysts can customize this biotech market research report to meet your requirements.
 RIA -
RIA - 
