Blood Plasma Market Size 2024-2028
The blood plasma market size is forecast to increase by USD 15.9 billion at a CAGR of 8.6% between 2023 and 2028. The market is experiencing significant growth due to the increasing demand for plasma-derived products in various therapeutic areas. Burn and shock treatment for trauma patients continue to be major applications, with clotting factors and immune deficiencies being key indications. Pharmaceutical companies are focusing on developing innovative solutions to address the global blood volume shortage crisis. Additionally, the use of microbial enzymes in blood transfusion technology is expanding, offering improved safety and efficacy. However, the closure of plasma donation centers due to operational network issues poses a challenge to market growth. In the US, the market is expected to grow steadily, driven by the increasing prevalence of liver disease and bleeding disorders, as well as the rising number of plasma donors. Key players in the market are investing in research and development to introduce advanced plasma-derived therapies, further fueling market growth.
What will be the Size of the Market During the Forecast Period?
Blood plasma is a vital component of human blood, making up approximately 55% of the total blood volume. This clear, straw-colored liquid is a rich source of essential proteins, including clotting factors, immunoglobulins, and albumin. In the biomedical industry, plasma plays a crucial role in various therapeutic indications, particularly in immunology, oncology, pulmonology, rheumatology, and trauma care. Plasma Composition and Therapeutics.
Further, these proteins play a significant role in the immune system, helping to neutralize pathogens, prevent bleeding, and support overall health. Immunology: In immunology, plasma is used to treat primary and secondary immunodeficiencies, as well as in the production of hyperimmune globulins for the prevention and treatment of infectious diseases. Oncology: Plasma proteins, particularly immunoglobulins, are essential in oncology for the treatment of various cancers. They help to boost the immune system, reduce the risk of infections, and improve overall patient outcomes. Pulmonology: Plasma is used in pulmonology for the treatment of respiratory disorders, such as emphysema and chronic obstructive pulmonary disease (COPD).
Also, plasma infusions help to improve lung function and reduce inflammation. Rheumatology: In rheumatology, plasma is used to treat various autoimmune disorders, such as rheumatoid arthritis and systemic lupus erythematosus. Plasma infusions help to reduce inflammation and improve joint function. Plasma is an essential component in trauma care for shock treatment and burn treatment. It helps to maintain blood pressure, prevent bleeding, and support organ function. Plasma is used in the treatment of various blood disorders, including hemophilia, von Willebrand disease, and other coagulation disorders. Plasma derivatives, such as Factor VIII and Factor IX, are used to replace missing or deficient clotting factors.
Convalescent plasma is collected from individuals who have recovered from an infection and contains antibodies that can help to prevent or treat the infection in others. It has been used successfully in the treatment of various infectious diseases, including influenza and COVID-19. Plasma donors play a crucial role in the production of plasma-derived products. They undergo a rigorous screening process to ensure the safety and quality of the plasma. Plasma is one of the essential blood constituents, along with red blood cells, white blood cells, and platelets. Each of these components plays a unique role in maintaining overall health and well-being.
In conclusion, blood plasma is a vital component of human blood with numerous therapeutic applications in various medical fields. Its rich protein content, including immunoglobulins, clotting factors, and albumin, makes it an essential tool in the prevention and treatment of various diseases and disorders. The continued research and development in the field of plasma-derived products will undoubtedly lead to new therapeutic applications and improved patient outcomes.
Market Segmentation
The market research report provides comprehensive data (region-wise segment analysis), with forecasts and estimates in "USD billion" for the period 2024-2028, as well as historical data from 2018-2022 for the following segments.
- Application
- Therapeutic use
- Diagnostic use
- Research and development
- Source
- Human plasma
- Synthetic plasma
- Geography
- North America
- Canada
- US
- Europe
- Germany
- UK
- France
- Italy
- Asia
- China
- India
- Japan
- Rest of World (ROW)
- North America
By Application Insights
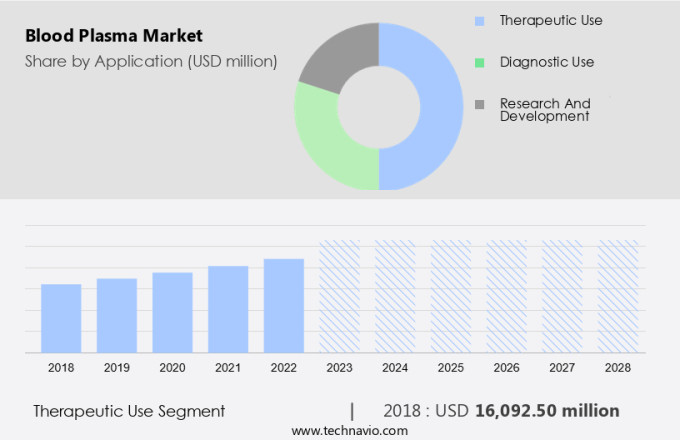
The therapeutic use segment is estimated to witness significant growth during the forecast period. Plasma-derived products, such as Coagulation Factor VIII and Immunoglobulins, play a significant role in addressing the healthcare needs of the geriatric population and individuals with primary immunodeficiency or secondary immunological deficits. These plasma-derived treatments are essential for managing various conditions, including hemorrhagic disorders and immunodeficiency diseases. The use of personalized medicine and orphan drug designations has expanded the application of plasma-derived products in treating rare diseases. Plasma collection is a crucial process in producing these life-saving therapies, ensuring their safety and efficacy. Immunodeficiency diseases, such as Hemophilia A and B, require regular infusions of Coagulation Factor VIII to prevent bleeding.
In addition, immunoglobulins, on the other hand, are used to prevent and treat infections in individuals with primary or secondary immunodeficiencies. In the US, the demand for plasma-derived products continues to grow, driven by an aging population, increasing prevalence of chronic diseases, and advancements in medical research. As a result, companies specializing in plasma collection and plasma-derived products are investing heavily in research and development to meet this demand. Plasma-derived products offer numerous benefits, including improved patient outcomes, reduced hospitalizations, and enhanced quality of life. As the healthcare industry continues to evolve, the importance of plasma-derived products in addressing the complex healthcare needs of the population will only become more significant.
Get a glance at the market share of various segments Request Free Sample
The therapeutic use segment accounted for USD 16.09 billion in 2018 and showed a gradual increase during the forecast period.
Regional Insights
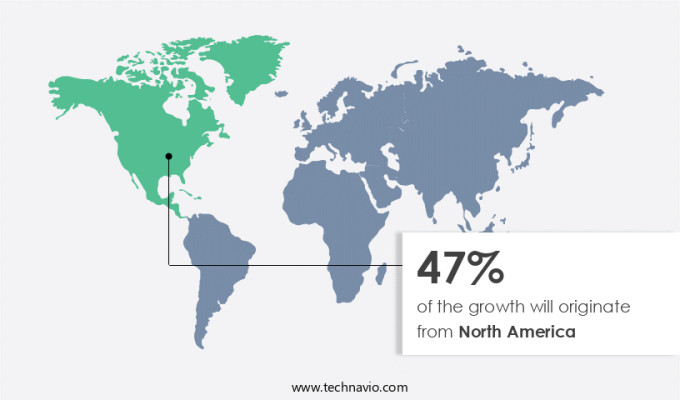
North America is estimated to contribute 47% to the growth of the global market during the forecast period. Technavio's analysts have elaborately explained the regional trends and drivers that shape the market during the forecast period.
For more insights on the market share of various regions Request Free Sample
The North American market is experiencing notable progress and strategic endeavors, specifically in the realm of dried plasma. Commencing in July 2024, Canadian Blood Services, in partnership with the Department of National Defence, will spearhead a project to reintroduce the use of dried plasma, an essential element in battlefield medicine. This initiative, financed by Veterans Affairs Canada, aims to improve the safety and production of dried blood plasma, utilizing historical freeze-drying technology from the Second World War. Dried plasma presents several logistical benefits over frozen plasma, including a shelf life of up to four years at room temperature, contrasting the one-year shelf life of frozen plasma.
Also, this prolonged shelf life offers significant advantages for military and emergency medical applications. In the biomedical sector, dried plasma is utilized in various forms such as Hyperimmune Globulin, Albumin, Factor VIII, Factor IX, Infusion Solutions, Gels, Sprays, and Biomedical Sealants for therapeutic indications in immunology. The revival of dried plasma is a promising development for the North American market.
Our researchers analyzed the data with 2023 as the base year, along with the key drivers, trends, and challenges. A holistic analysis of drivers will help companies refine their marketing strategies to gain a competitive advantage.
Market Driver
Innovative solutions targeting global blood shortage crisis is the key driver of the market. The Blood D.E.S.E.R.T Coalition, spearheaded by researchers from Harvard Medical School and Brigham and Women's Hospital, aims to tackle the issue of unmet clinical needs for blood components affecting billions of people as of February 15, 2024. To address this critical situation, the coalition proposes innovative strategies, such as the implementation of civilian walking blood banks. This concept, inspired by military practices, engages community volunteers prepared to donate blood on short notice, thereby reducing the reliance on central storage, particularly in rural areas.
Another proposed solution is intraoperative auto-transfusion, where a patient's own blood is collected and reused during medical procedures, thereby minimizing the requirement for external blood supplies. In Oncology, Pulmonology, Rheumatology, Transplantation, Neurology, Hematology, Hypogammaglobulinemia, and Immunodeficiency Diseases, as well as in Hemophilia patients, these solutions could significantly improve access to essential blood components. Hospitals and clinics stand to benefit from these initiatives, ensuring a more reliable and accessible blood supply for their patients.
Market Trends
The expanding use of microbial enzymes in blood transfusion technology is the upcoming trend in the market. The market is experiencing significant advancements, particularly in the field of blood transfusion technology. One notable development comes from a Scandinavian collaboration, which has made substantial progress towards creating universally compatible blood for transfusion and organ transplant recipients. This groundbreaking innovation utilizes microbial enzymes derived from gut bacteria to effectively eliminate A and B antigens from red blood cells.
Further, these antigens are responsible for determining an individual's blood type, with the A gene encoding N-acetylgalactosaminyl-transferase and the B gene encoding -galactosyltransferase. These enzymes add A- and B-specific sugars to the glycolipids and glycoproteins in red blood cells. This advancement holds immense potential for various applications, including burn treatment, shock treatment for trauma patients, and addressing clotting factors in liver disease, bleeding disorders, and immune deficiencies. The pharmaceutical industry stands to benefit significantly from these developments, as blood plasma remains a vital component in the production of various therapeutic products.
Market Challenge
The closure of plasma donation centers due to operational network issues is a key challenge affecting the market growth. In the intricate ecosystem of the blood plasma industry, Octapharma Plasma encountered a significant operational hurdle in April 2024. This challenge materialized when the company was compelled to shutter all 195 of its plasma collection centers spread across 35 states in the United States, including three situated in Columbus, Ohio. The closures were instigated by IT network complications, which impaired the organization's capacity to manage its centers proficiently. This incident underscores a pivotal vulnerability within the blood plasma sector, where technological disruptions can instigate far-reaching consequences on plasma procurement and distribution.
However, the affected centers, among them those in Columbus, assume a vital role in the collection of plasma, which comprises approximately 55% of human blood and is indispensable for conveying antibodies, proteins, enzymes, and clotting factors to patients with various blood disorders. Plasma donors, the lifeblood of the industry, contribute this essential fluid to aid individuals grappling with conditions such as hemophilia, immune deficiencies, and other disorders. The plasma undergoes rigorous processing to isolate its constituents, including red blood cells, white blood cells, and platelets, which are subsequently utilized to fortify the immune system and combat pathogens. In the face of this challenge, it is crucial for industry players to prioritize IT infrastructure and contingency plans to mitigate potential disruptions and ensure a consistent supply of this vital resource.
Exclusive Customer Landscape
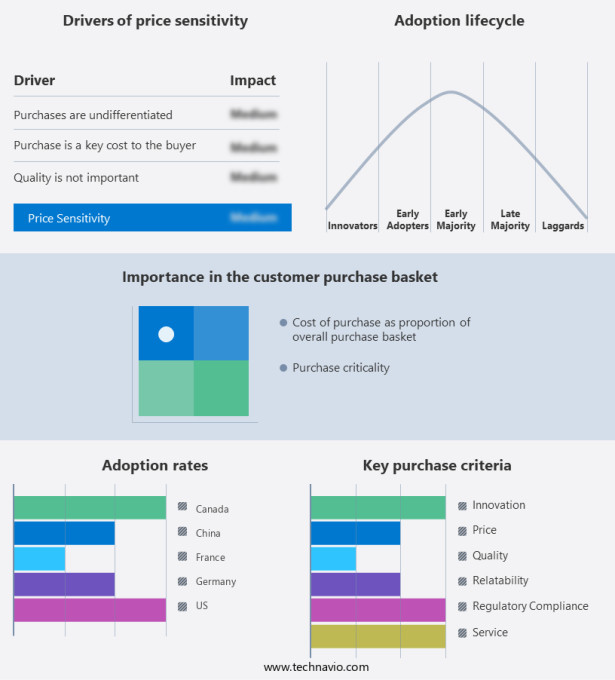
The market forecasting report includes the adoption lifecycle of the market, covering from the innovator's stage to the laggard's stage. It focuses on adoption rates in different regions based on penetration. Furthermore, the report also includes key purchase criteria and drivers of price sensitivity to help companies evaluate and develop their market growth analysis strategies.
Customer Landscape
Key Companies & Market Insights
Companies are implementing various strategies, such as strategic alliances, partnerships, mergers and acquisitions, geographical expansion, and product/service launches, to enhance their presence in the market.
ADMA Biologics Inc. - The company offers blood plasma products such as Bivigam -Immunoglobulin, Nabi-HB -Clotting Factor, and others.
The market research and growth report includes detailed analyses of the competitive landscape of the market and information about key companies, including:
- Bio Products Laboratory Ltd.
- Biotest AG
- CSL Ltd.
- GC Biopharma Corp.
- Grifols SA
- Kamada Ltd.
- Kedrion SpA
- LFB SA
- Meiji Holdings Co. Ltd.
- Octapharma AG
- Pfizer Inc.
- Sanquin
- SK Plasma Co. Ltd.
- Takeda Pharmaceutical Co. Ltd.
Qualitative and quantitative analysis of companies has been conducted to help clients understand the wider business environment as well as the strengths and weaknesses of key market players. Data is qualitatively analyzed to categorize companies as pure play, category-focused, industry-focused, and diversified; it is quantitatively analyzed to categorize companies as dominant, leading, strong, tentative, and weak.
Research Analyst Overview
Blood plasma is a crucial component of the blood, making up around 55% of the total volume. It is a liquid part of the blood that carries various essential proteins, including clotting factors, immunoglobulins, and albumin. These proteins play a significant role in various therapeutic indications, such as immunology, oncology, pulmonology, rheumatology, transplantation, neurology, hematology, and liver disease. Plasma-derived products, such as immunoglobulins, coagulation factor VIII, and albumin, are used to treat various conditions, including hypogammaglobulinemia, immunodeficiency diseases, hemophilia, and bleeding disorders. Plasma donors are essential for the production of these products, and the collection process is rigorously regulated to ensure safety and efficacy.
Further, the market encompasses various plasma-derived products, including infusion solutions, gels, sprays, biomedical sealants, and therapeutic drugs. These products find applications in non-therapeutic areas such as burn treatment, shock treatment, and trauma patients. The market is driven by the increasing prevalence of chronic diseases, clinical trials, and the growing demand for personalized medicine for rare diseases and orphan drug designations. The immune system plays a crucial role in protecting the body from pathogens, and plasma-derived products are essential in treating various immune deficiencies and secondary immunological deficits. The geriatric population is a significant consumer of these products due to their increased susceptibility to various chronic diseases and infections. The market faces challenges such as side effects, allergic conditions, and the high cost of production. However, the market is expected to grow due to the increasing demand for plasma-derived products and the development of new technologies for plasma collection and production.
|
Market Scope |
|
|
Report Coverage |
Details |
|
Page number |
201 |
|
Base year |
2023 |
|
Historic period |
2018-2022 |
|
Forecast period |
2024-2028 |
|
Growth momentum & CAGR |
Accelerate at a CAGR of 8.6% |
|
Market growth 2024-2028 |
USD 15.9 billion |
|
Market structure |
Fragmented |
|
YoY growth 2023-2024(%) |
8.4 |
|
Regional analysis |
North America, Europe, Asia, and Rest of World (ROW) |
|
Performing market contribution |
North America at 47% |
|
Key countries |
US, Germany, France, China, Canada, UK, Japan, Brazil, India, and Italy |
|
Competitive landscape |
Leading Companies, Market Positioning of Companies, Competitive Strategies, and Industry Risks |
|
Key companies profiled |
ADMA Biologics Inc., Bio Products Laboratory Ltd., Biotest AG, CSL Ltd., GC Biopharma Corp., Grifols SA, Kamada Ltd., Kedrion SpA, LFB SA, Meiji Holdings Co. Ltd., Octapharma AG, Pfizer Inc., Sanquin, SK Plasma Co. Ltd., and Takeda Pharmaceutical Co. Ltd. |
|
Market dynamics |
Parent market analysis, market growth inducers and obstacles, market forecast, fast-growing and slow-growing segment analysis, COVID-19 impact and recovery analysis and future consumer dynamics, market condition analysis for the forecast period |
|
Customization purview |
If our market report has not included the data that you are looking for, you can reach out to our analysts and get segments customized. |
What are the Key Data Covered in this Market Research and Growth Report?
- CAGR of the market during the forecast period
- Detailed information on factors that will drive the market growth and forecasting between 2024 and 2028
- Precise estimation of the size of the market and its contribution of the market in focus to the parent market
- Accurate predictions about upcoming market growth and trends and changes in consumer behaviour
- Growth of the market across North America, Europe, Asia, and Rest of World (ROW)
- Thorough analysis of the market's competitive landscape and detailed information about companies
- Comprehensive analysis of factors that will challenge the growth of market companies
We can help! Our analysts can customize this market research report to meet your requirements. Get in touch


