Boat Docks And Lifts Market Analysis, Size, and Forecast 2026-2030: North America (US, Canada, and Mexico), Europe (Germany, France, and Italy), APAC (China, Japan, and Australia), South America (Brazil and Argentina), Middle East and Africa (UAE, South Africa, and Saudi Arabia), and Rest of World (ROW)

Boat Docks And Lifts Market Analysis, Size, and Forecast 2026-2030:
North America (US, Canada, and Mexico), Europe (Germany, France, and Italy), APAC (China, Japan, and Australia), South America (Brazil and Argentina), Middle East and Africa (UAE, South Africa, and Saudi Arabia), and Rest of World (ROW)

Published: Mar 2026 292 Pages SKU: IRTNTR70263

Market Overview at a Glance

$300.8 Mn
Market Opportunity
4.6%
CAGR 2025 - 2030
56.7%
North America Growth
$853.4 Mn
Commercial segment 2024

Boat Docks And Lifts Market Size 2026-2030

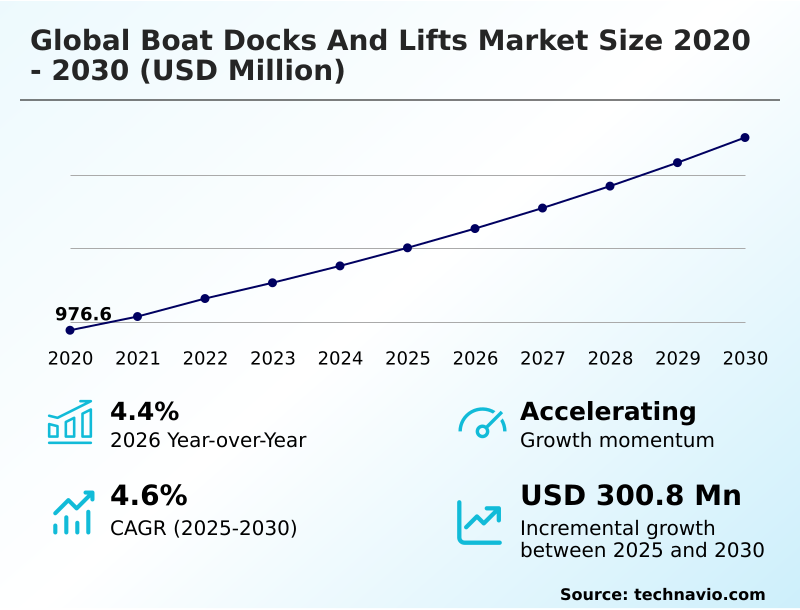
The boat docks and lifts market size is valued to increase by USD 300.8 million, at a CAGR of 4.6% from 2025 to 2030. Increasing participation in recreational boating and water-based leisure activities will drive the boat docks and lifts market.

Major Market Trends & Insights

  • North America dominated the market and accounted for a 56.7% growth during the forecast period.
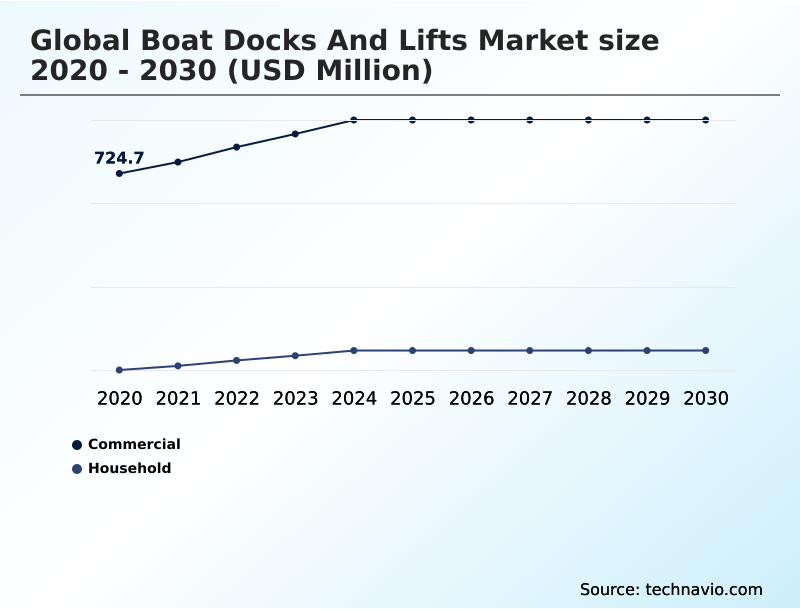
  • By Application - Commercial segment was valued at USD 853.4 million in 2024
  • By Type - Boat docks segment accounted for the largest market revenue share in 2024

Market Size & Forecast

  • Market Opportunities: USD 525.6 million
  • Market Future Opportunities: USD 300.8 million
  • CAGR from 2025 to 2030 : 4.6%

Market Summary

  • The boat docks and lifts market is experiencing robust expansion, driven by rising participation in recreational boating and the continuous development of waterfront residential and commercial infrastructure. Demand is shifting from basic mooring solutions to advanced systems that offer enhanced vessel protection, convenience, and longevity.
  • Key trends include the integration of smart technology, enabling remote operation of boat lifts via mobile applications, and the increasing adoption of sustainable, low-maintenance materials like marine-grade aluminum and recycled composites. These innovations address the core need of boat owners to preserve the value of their assets while minimizing upkeep.
  • However, the industry faces challenges from complex regulatory permitting processes that can delay projects and high initial capital costs. For instance, a commercial marina developer must navigate a multi-agency approval process, which can add significant time and expense, directly impacting the financial viability of a project.
  • Success in this market depends on delivering durable, technologically advanced, and environmentally compliant solutions that cater to an increasingly sophisticated customer base.

What will be the Size of the Boat Docks And Lifts Market during the forecast period?

Get Key Insights on Market Forecast (PDF) Request Free Sample

How is the Boat Docks And Lifts Market Segmented?

The boat docks and lifts industry research report provides comprehensive data (region-wise segment analysis), with forecasts and estimates in "USD million" for the period 2026-2030, as well as historical data from 2020-2024 for the following segments.

  • Application
    • Commercial
    • Household
  • Type
    • Boat docks
    • Boat lifts
  • Material
    • Wood
    • Plastic
    • Concrete
    • Metal
  • Geography
    • North America
      • US
      • Canada
      • Mexico
    • Europe
      • Germany
      • France
      • Italy
    • APAC
      • China
      • Japan
      • Australia
    • South America
      • Brazil
      • Argentina
    • Middle East and Africa
      • UAE
      • South Africa
      • Saudi Arabia
    • Rest of World (ROW)

By Application Insights

The commercial segment is estimated to witness significant growth during the forecast period.

The commercial segment is governed by factors distinct from the residential market, centering on large-scale waterfront infrastructure.

Demand stems from entities requiring turnkey waterfront solutions focused on durability, with projects favoring the use of a heavy-duty structural frame, concrete pontoon system, and structural steel components.

A commercial marina solution is engineered for constant use and high capacity, with installations demonstrating a 99.5% operational uptime. These projects prioritize berthing and mooring safety and robust marine asset management.

The use of a wave attenuator design is also critical in exposed harbors to ensure a safe and stable environment.

Request Free Sample

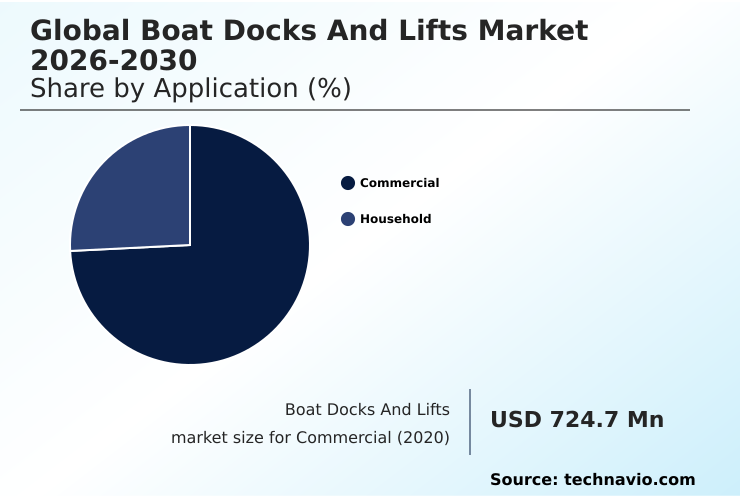
The Commercial segment was valued at USD 853.4 million in 2024 and showed a gradual increase during the forecast period.

Request Free Sample

Regional Analysis

North America is estimated to contribute 56.7% to the growth of the global market during the forecast period.Technavio’s analysts have elaborately explained the regional trends and drivers that shape the market during the forecast period.

See How Boat Docks And Lifts Market Demand is Rising in North America Request Free Sample

Regional dynamics are shaped by distinct environmental factors. In North America, where market expansion is nearly 93% faster than in Europe, growth is driven by modernizing aging yacht club facilities to handle storm surge resilience and water level fluctuation.

European projects, particularly in narrow canals, often require an elevator boat lift for space efficiency. The Middle East demands custom solutions like a submersible lift platform, emphasizing waterfront aesthetic integration.

Across all regions, the choice between a freestanding boat lift and piling-mounted lift is dictated by local geography and regulations.

Market Dynamics

Our researchers analyzed the data with 2025 as the base year, along with the key drivers, trends, and challenges. A holistic analysis of drivers will help companies refine their marketing strategies to gain a competitive advantage.

  • Strategic decisions within the global boat docks and lifts market 2026-2030 are increasingly informed by a detailed analysis of lifecycle costs and operational benefits. Understanding the benefits of floating vs fixed docks is crucial for developers in areas with tidal waters, as is evaluating the superior corrosion resistance of aluminum dock systems in saltwater environments.
  • Consumers frequently research how to choose a boat lift tailored to their vessel and water depth, with specific interest in boat lifts for shallow water. The cost of composite vs wood decking is a key consideration, where the higher initial outlay for composites is often justified by lower long-term expenses.
  • For asset preservation, protecting boats from galvanic corrosion is a primary motivator for lift purchases. Maintenance queries, such as maintaining a hydraulic boat lift or winterizing a floating dock system, are common. The complexity of the permitting process for residential docks remains a significant factor in purchasing timelines.
  • The market is also seeing growth in accessories and specialized equipment, with high demand for dock accessories for personal watercraft and an increasing preference for the advantages of direct drive lift motors. For high-end applications, heavy duty lifts for large yachts and advanced smart boat lift remote control systems represent a key growth segment.
  • Firms that provide clear guidance on topics like the best materials for saltwater docks and the differences between piling mount vs freestanding lifts can achieve a competitive advantage, as informed buyers are twice as likely to invest in premium, integrated systems.

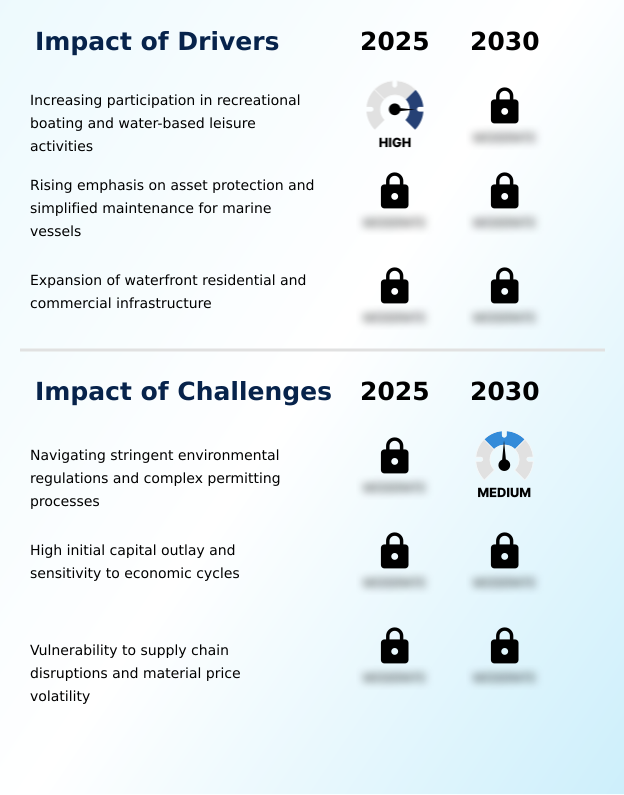
What are the key market drivers leading to the rise in the adoption of Boat Docks And Lifts Industry?

  • The market's growth is primarily driven by increasing global participation in recreational boating and various water-based leisure activities.

  • A fundamental driver is the growing emphasis on long-term asset protection and vessel value preservation.
  • Boat owners are investing in systems that prevent hull biofouling prevention and offer galvanic corrosion protection, with a floating boat lift shown to reduce annual hull maintenance costs by over 40%.
  • The rising adoption of low-maintenance materials like marine-grade aluminum and recycled plastic lumber also contributes to a lower lifecycle ownership cost. The expansion of recreational boating infrastructure, combined with the ease of vessel launch from modern systems, further propels demand.
  • Waterfront properties with these amenities often see valuations increase by more than 15%.

What are the market trends shaping the Boat Docks And Lifts Industry?

  • The integration of advanced automation and smart technology is an important trend, redefining user convenience and operational efficiency in marine infrastructure.

  • The market is pivoting toward smart functionality. The adoption of a remote-controlled lift with automated lift controls, often managed via mobile apps, enhances user convenience features. This trend is complemented by innovations like soft-start motor technology and load sensor integration.
  • The ascendancy of the modular dock system allows for unparalleled custom layout configuration, with designs often incorporating a kayak launch accessory and a pwc port docking solution. This shift redefines waterfront lifestyle enhancement, offering systems that are more responsive and adaptable to owner needs. These smart systems can reduce vessel preparation time by over 25% and improve operational safety.

What challenges does the Boat Docks And Lifts Industry face during its growth?

  • A key challenge for industry growth involves navigating stringent environmental regulations and complex, time-consuming permitting processes for waterfront construction.

  • A significant challenge involves navigating complex environmental regulation compliance, which can increase project timelines by 30%. This regulatory landscape often mandates the use of specific inert construction materials and designs featuring non-encapsulated flotation to minimize marine ecosystem impact, complicating shoreline management. Concurrently, the industry faces vulnerability to supply chain disruptions and raw material price volatility.
  • These factors impact costs for both a residential docking system and larger projects, creating uncertainty for marine contractor services and equipment suppliers. This volatility can lead to project cost variances of 10-15% annually.

Exclusive Technavio Analysis on Customer Landscape

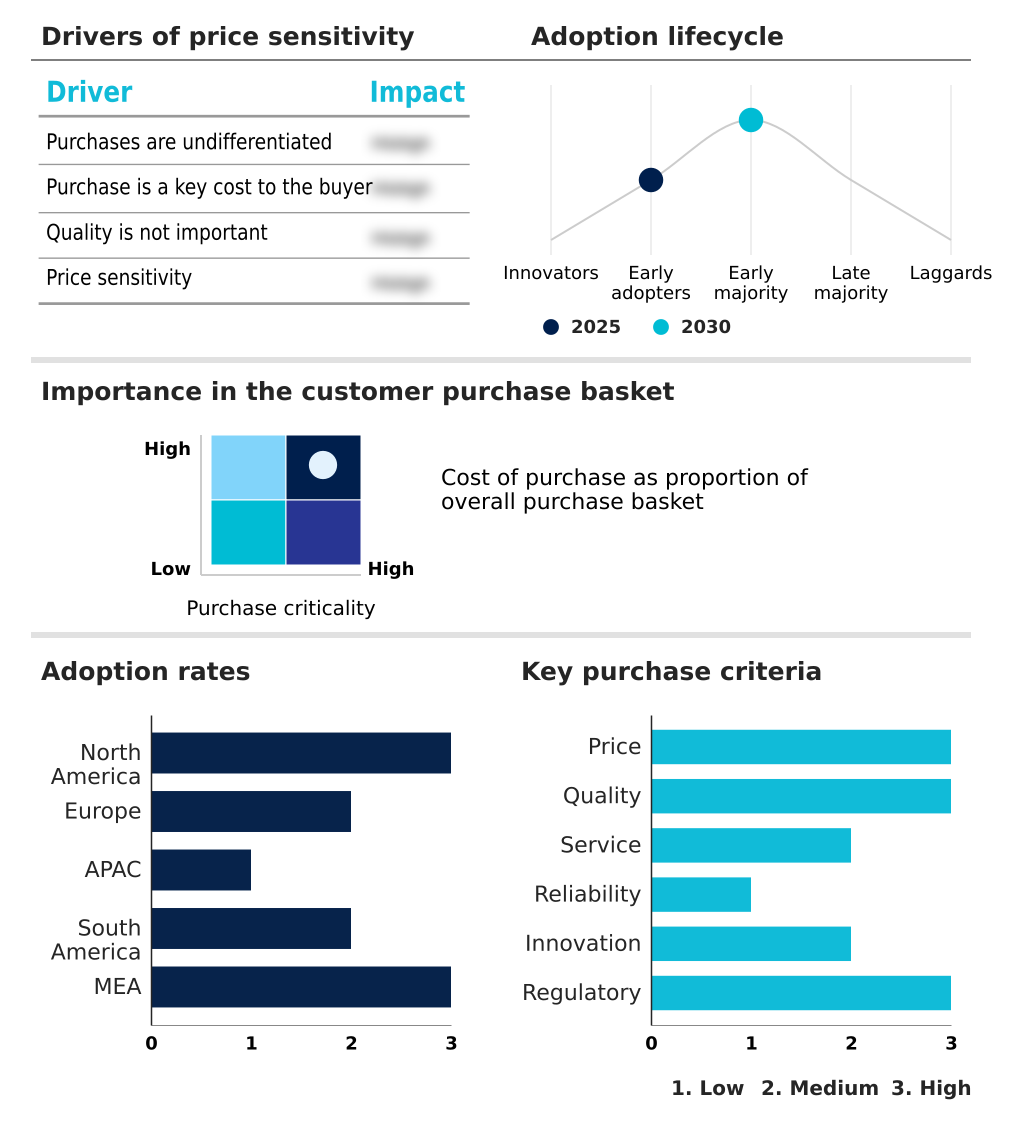
The boat docks and lifts market forecasting report includes the adoption lifecycle of the market, covering from the innovator’s stage to the laggard’s stage. It focuses on adoption rates in different regions based on penetration. Furthermore, the boat docks and lifts market report also includes key purchase criteria and drivers of price sensitivity to help companies evaluate and develop their market growth analysis strategies.

Customer Landscape of Boat Docks And Lifts Industry

Competitive Landscape

Companies are implementing various strategies, such as strategic alliances, boat docks and lifts market forecast, partnerships, mergers and acquisitions, geographical expansion, and product/service launches, to enhance their presence in the industry.

AccuDock - Offers a comprehensive range of boat docks and lifts, from custom floating platforms to advanced elevation systems for various watercraft.

The industry research and growth report includes detailed analyses of the competitive landscape of the market and information about key companies, including:

  • AccuDock
  • Cellofoam North America Inc.
  • Duramax Marine LLC
  • EZ Dock
  • FLOE International Inc.
  • Golden Manufacturing Inc.
  • Hi Tide Boat Lifts
  • HydroHoist Boat Lifts
  • HydroHoist LLC
  • IMM Quality Boat Lifts
  • Jetdock Systems Inc.
  • Lift Tech Marine
  • Midwest Industries Inc.
  • Pier Pleasure Inc.
  • Porta-Dock Inc.
  • Reimann and Georger Corp.
  • Rhino Inc.
  • ShoreMaster LLC
  • Sunstream Corp.
  • Tide Tamer Waterfront Products

Qualitative and quantitative analysis of companies has been conducted to help clients understand the wider business environment as well as the strengths and weaknesses of key industry players. Data is qualitatively analyzed to categorize companies as pure play, category-focused, industry-focused, and diversified; it is quantitatively analyzed to categorize companies as dominant, leading, strong, tentative, and weak.

Recent Development and News in Boat docks and lifts market

  • In January, 2025, developers of the NEOM project in Saudi Arabia unveiled technical specifications for the flagship Indalah marina, requiring fully submersible, automated dry-docking pods for each superyacht berth.
  • In February, 2025, Sunstream Corp. launched its Helix-P piling lift, a product featuring high-speed hydraulic performance, a concealed design for improved waterfront aesthetics, and mobile application integration for operation.
  • In March, 2025, the Great Lakes Marine Resilience Commission, a joint US-Canada body, issued new standards mandating the use of floating and adjustable dock systems capable of adapting to volatile water levels.
  • In April, 2025, Shoreline Systems Inc. launched its Nautilus series of modular floating docks and automated lifts, notable for using a composite material derived from 100% recycled ocean-bound plastics.

Dive into Technavio’s robust research methodology, blending expert interviews, extensive data synthesis, and validated models for unparalleled Boat Docks And Lifts Market insights. See full methodology.

Market Scope
Page number 292
Base year 2025
Historic period 2020-2024
Forecast period 2026-2030
Growth momentum & CAGR Accelerate at a CAGR of 4.6%
Market growth 2026-2030 USD 300.8 million
Market structure Fragmented
YoY growth 2025-2026(%) 4.4%
Key countries US, Canada, Mexico, Germany, France, Italy, UK, Spain, The Netherlands, China, Japan, Australia, India, Singapore, Indonesia, Brazil, Argentina, Chile, UAE, South Africa, Saudi Arabia, Egypt and Oman
Competitive landscape Leading Companies, Market Positioning of Companies, Competitive Strategies, and Industry Risks

Request Free Sample

Research Analyst Overview

  • The global boat docks and lifts market 2026-2030 is defined by a strategic shift towards engineered systems that prioritize durability and operational efficiency. The integration of a high-density polyethylene based modular dock system and advanced hydraulic drive systems is becoming standard.
  • Decisions at the boardroom level are increasingly influenced by the total cost of ownership, where the adoption of low-maintenance materials has been shown to reduce long-term expenses by over 30% compared to traditional wood. The market is propelled by the need for robust waterfront infrastructure, leading to innovation in products like the floating boat lift and direct-drive boat lift.
  • Solutions offering galvanic corrosion protection and hull biofouling prevention are critical for preserving asset value. The development of a commercial marina solution alongside a sophisticated residential docking system showcases the market's diversity. Technologies such as automated lift controls and the use of marine-grade aluminum are key differentiators.
  • The complexity of these systems necessitates a move beyond basic products to comprehensive solutions addressing a wide range of marine applications and environmental conditions.

What are the Key Data Covered in this Boat Docks And Lifts Market Research and Growth Report?

  • What is the expected growth of the Boat Docks And Lifts Market between 2026 and 2030?

    • USD 300.8 million, at a CAGR of 4.6%

  • What segmentation does the market report cover?

    • The report is segmented by Application (Commercial, and Household), Type (Boat docks, and Boat lifts), Material (Wood, Plastic, Concrete, and Metal) and Geography (North America, Europe, APAC, South America, Middle East and Africa)

  • Which regions are analyzed in the report?

    • North America, Europe, APAC, South America and Middle East and Africa

  • What are the key growth drivers and market challenges?

    • Increasing participation in recreational boating and water-based leisure activities, Navigating stringent environmental regulations and complex permitting processes

  • Who are the major players in the Boat Docks And Lifts Market?

    • AccuDock, Cellofoam North America Inc., Duramax Marine LLC, EZ Dock, FLOE International Inc., Golden Manufacturing Inc., Hi Tide Boat Lifts, HydroHoist Boat Lifts, HydroHoist LLC, IMM Quality Boat Lifts, Jetdock Systems Inc., Lift Tech Marine, Midwest Industries Inc., Pier Pleasure Inc., Porta-Dock Inc., Reimann and Georger Corp., Rhino Inc., ShoreMaster LLC, Sunstream Corp. and Tide Tamer Waterfront Products

Market Research Insights

  • The market's performance is closely linked to tangible business outcomes derived from product innovation. For example, the adoption of a modular dock system, which allows for custom layout configuration, has been shown to reduce installation time by up to 40% compared to traditional fixed-pier construction. This enhances dock system scalability and provides a clear ROI for commercial operators.
  • Similarly, the integration of user convenience features in modern boat lifts, facilitated by marine contractor services, results in greater owner satisfaction and more frequent vessel use.
  • For marina operators, leveraging systems that improve dock stability engineering and offer turnkey waterfront solutions can reduce long-term maintenance expenditures by over 20%, directly impacting operational profitability and reinforcing the value of strategic infrastructure investments.

We can help! Our analysts can customize this boat docks and lifts market research report to meet your requirements.

Get in touch

1. Executive Summary

1.1 Market overview

Executive Summary - Chart on Market Overview
Executive Summary - Data Table on Market Overview
Executive Summary - Chart on Global Market Characteristics
Executive Summary - Chart on Market by Geography
Executive Summary - Chart on Market Segmentation by Application
Executive Summary - Chart on Market Segmentation by Type
Executive Summary - Chart on Market Segmentation by Material
Executive Summary - Chart on Incremental Growth
Executive Summary - Data Table on Incremental Growth
Executive Summary - Chart on Company Market Positioning

2. Technavio Analysis

2.1 Analysis of price sensitivity, lifecycle, customer purchase basket, adoption rates, and purchase criteria

2.2 Criticality of inputs and Factors of differentiation

Chart on Overview on criticality of inputs and factors of differentiation

2.3 Factors of disruption

Chart on Overview on factors of disruption

2.4 Impact of drivers and challenges

Chart on Impact of drivers and challenges in 2025 and 2030

3. Market Landscape

3.1 Market ecosystem

Chart on Parent Market
Data Table on - Parent Market

3.2 Market characteristics

Chart on Market characteristics analysis

3.3 Value chain analysis

Chart on Value chain analysis

4. Market Sizing

4.1 Market definition

Data Table on Offerings of companies included in the market definition

4.2 Market segment analysis

Market segments

4.3 Market size 2025

4.4 Market outlook: Forecast for 2025-2030

Chart on Global - Market size and forecast 2025-2030 ($ million)
Data Table on Global - Market size and forecast 2025-2030 ($ million)
Chart on Global Market: Year-over-year growth 2025-2030 (%)
Data Table on Global Market: Year-over-year growth 2025-2030 (%)

5. Historic Market Size

5.1 Global Boat Docks And Lifts Market 2020 - 2024

Historic Market Size - Data Table on Global Boat Docks And Lifts Market 2020 - 2024 ($ million)

5.2 Application segment analysis 2020 - 2024

Historic Market Size - Application Segment 2020 - 2024 ($ million)

5.3 Type segment analysis 2020 - 2024

Historic Market Size - Type Segment 2020 - 2024 ($ million)

5.4 Material segment analysis 2020 - 2024

Historic Market Size - Material Segment 2020 - 2024 ($ million)

5.5 Geography segment analysis 2020 - 2024

Historic Market Size - Geography Segment 2020 - 2024 ($ million)

5.6 Country segment analysis 2020 - 2024

Historic Market Size - Country Segment 2020 - 2024 ($ million)

6. Qualitative Analysis

6.1 Impact of AI on global boat docks and lifts market

7. Five Forces Analysis

7.1 Five forces summary

Five forces analysis - Comparison between 2025 and 2030

7.2 Bargaining power of buyers

Bargaining power of buyers - Impact of key factors 2025 and 2030

7.3 Bargaining power of suppliers

Bargaining power of suppliers - Impact of key factors in 2025 and 2030

7.4 Threat of new entrants

Threat of new entrants - Impact of key factors in 2025 and 2030

7.5 Threat of substitutes

Threat of substitutes - Impact of key factors in 2025 and 2030

7.6 Threat of rivalry

Threat of rivalry - Impact of key factors in 2025 and 2030

7.7 Market condition

Chart on Market condition - Five forces 2025 and 2030

8. Market Segmentation by Application

8.1 Market segments

Chart on Application - Market share 2025-2030 (%)
Data Table on Application - Market share 2025-2030 (%)

8.2 Comparison by Application

Chart on Comparison by Application
Data Table on Comparison by Application

8.3 Commercial - Market size and forecast 2025-2030

Chart on Commercial - Market size and forecast 2025-2030 ($ million)
Data Table on Commercial - Market size and forecast 2025-2030 ($ million)
Chart on Commercial - Year-over-year growth 2025-2030 (%)
Data Table on Commercial - Year-over-year growth 2025-2030 (%)

8.4 Household - Market size and forecast 2025-2030

Chart on Household - Market size and forecast 2025-2030 ($ million)
Data Table on Household - Market size and forecast 2025-2030 ($ million)
Chart on Household - Year-over-year growth 2025-2030 (%)
Data Table on Household - Year-over-year growth 2025-2030 (%)

8.5 Market opportunity by Application

Market opportunity by Application ($ million)
Data Table on Market opportunity by Application ($ million)

9. Market Segmentation by Type

9.1 Market segments

Chart on Type - Market share 2025-2030 (%)
Data Table on Type - Market share 2025-2030 (%)

9.2 Comparison by Type

Chart on Comparison by Type
Data Table on Comparison by Type

9.3 Boat docks - Market size and forecast 2025-2030

Chart on Boat docks - Market size and forecast 2025-2030 ($ million)
Data Table on Boat docks - Market size and forecast 2025-2030 ($ million)
Chart on Boat docks - Year-over-year growth 2025-2030 (%)
Data Table on Boat docks - Year-over-year growth 2025-2030 (%)

9.4 Boat lifts - Market size and forecast 2025-2030

Chart on Boat lifts - Market size and forecast 2025-2030 ($ million)
Data Table on Boat lifts - Market size and forecast 2025-2030 ($ million)
Chart on Boat lifts - Year-over-year growth 2025-2030 (%)
Data Table on Boat lifts - Year-over-year growth 2025-2030 (%)

9.5 Market opportunity by Type

Market opportunity by Type ($ million)
Data Table on Market opportunity by Type ($ million)

10. Market Segmentation by Material

10.1 Market segments

Chart on Material - Market share 2025-2030 (%)
Data Table on Material - Market share 2025-2030 (%)

10.2 Comparison by Material

Chart on Comparison by Material
Data Table on Comparison by Material

10.3 Wood - Market size and forecast 2025-2030

Chart on Wood - Market size and forecast 2025-2030 ($ million)
Data Table on Wood - Market size and forecast 2025-2030 ($ million)
Chart on Wood - Year-over-year growth 2025-2030 (%)
Data Table on Wood - Year-over-year growth 2025-2030 (%)

10.4 Plastic - Market size and forecast 2025-2030

Chart on Plastic - Market size and forecast 2025-2030 ($ million)
Data Table on Plastic - Market size and forecast 2025-2030 ($ million)
Chart on Plastic - Year-over-year growth 2025-2030 (%)
Data Table on Plastic - Year-over-year growth 2025-2030 (%)

10.5 Concrete - Market size and forecast 2025-2030

Chart on Concrete - Market size and forecast 2025-2030 ($ million)
Data Table on Concrete - Market size and forecast 2025-2030 ($ million)
Chart on Concrete - Year-over-year growth 2025-2030 (%)
Data Table on Concrete - Year-over-year growth 2025-2030 (%)

10.6 Metal - Market size and forecast 2025-2030

Chart on Metal - Market size and forecast 2025-2030 ($ million)
Data Table on Metal - Market size and forecast 2025-2030 ($ million)
Chart on Metal - Year-over-year growth 2025-2030 (%)
Data Table on Metal - Year-over-year growth 2025-2030 (%)

10.7 Market opportunity by Material

Market opportunity by Material ($ million)
Data Table on Market opportunity by Material ($ million)

11. Customer Landscape

11.1 Customer landscape overview

Analysis of price sensitivity, lifecycle, customer purchase basket, adoption rates, and purchase criteria

12. Geographic Landscape

12.1 Geographic segmentation

Chart on Market share by geography 2025-2030 (%)
Data Table on Market share by geography 2025-2030 (%)

12.2 Geographic comparison

Chart on Geographic comparison
Data Table on Geographic comparison

12.3 North America - Market size and forecast 2025-2030

Chart on North America - Market size and forecast 2025-2030 ($ million)
Data Table on North America - Market size and forecast 2025-2030 ($ million)
Chart on North America - Year-over-year growth 2025-2030 (%)
Data Table on North America - Year-over-year growth 2025-2030 (%)
Chart on Regional Comparison - North America
Data Table on Regional Comparison - North America

12.3.1 US - Market size and forecast 2025-2030

Chart on US - Market size and forecast 2025-2030 ($ million)
Data Table on US - Market size and forecast 2025-2030 ($ million)
Chart on US - Year-over-year growth 2025-2030 (%)
Data Table on US - Year-over-year growth 2025-2030 (%)

12.3.2 Canada - Market size and forecast 2025-2030

Chart on Canada - Market size and forecast 2025-2030 ($ million)
Data Table on Canada - Market size and forecast 2025-2030 ($ million)
Chart on Canada - Year-over-year growth 2025-2030 (%)
Data Table on Canada - Year-over-year growth 2025-2030 (%)

12.3.3 Mexico - Market size and forecast 2025-2030

Chart on Mexico - Market size and forecast 2025-2030 ($ million)
Data Table on Mexico - Market size and forecast 2025-2030 ($ million)
Chart on Mexico - Year-over-year growth 2025-2030 (%)
Data Table on Mexico - Year-over-year growth 2025-2030 (%)

12.4 Europe - Market size and forecast 2025-2030

Chart on Europe - Market size and forecast 2025-2030 ($ million)
Data Table on Europe - Market size and forecast 2025-2030 ($ million)
Chart on Europe - Year-over-year growth 2025-2030 (%)
Data Table on Europe - Year-over-year growth 2025-2030 (%)
Chart on Regional Comparison - Europe
Data Table on Regional Comparison - Europe

12.4.1 Germany - Market size and forecast 2025-2030

Chart on Germany - Market size and forecast 2025-2030 ($ million)
Data Table on Germany - Market size and forecast 2025-2030 ($ million)
Chart on Germany - Year-over-year growth 2025-2030 (%)
Data Table on Germany - Year-over-year growth 2025-2030 (%)

12.4.2 France - Market size and forecast 2025-2030

Chart on France - Market size and forecast 2025-2030 ($ million)
Data Table on France - Market size and forecast 2025-2030 ($ million)
Chart on France - Year-over-year growth 2025-2030 (%)
Data Table on France - Year-over-year growth 2025-2030 (%)

12.4.3 Italy - Market size and forecast 2025-2030

Chart on Italy - Market size and forecast 2025-2030 ($ million)
Data Table on Italy - Market size and forecast 2025-2030 ($ million)
Chart on Italy - Year-over-year growth 2025-2030 (%)
Data Table on Italy - Year-over-year growth 2025-2030 (%)

12.4.4 UK - Market size and forecast 2025-2030

Chart on UK - Market size and forecast 2025-2030 ($ million)
Data Table on UK - Market size and forecast 2025-2030 ($ million)
Chart on UK - Year-over-year growth 2025-2030 (%)
Data Table on UK - Year-over-year growth 2025-2030 (%)

12.4.5 Spain - Market size and forecast 2025-2030

Chart on Spain - Market size and forecast 2025-2030 ($ million)
Data Table on Spain - Market size and forecast 2025-2030 ($ million)
Chart on Spain - Year-over-year growth 2025-2030 (%)
Data Table on Spain - Year-over-year growth 2025-2030 (%)

12.4.6 The Netherlands - Market size and forecast 2025-2030

Chart on The Netherlands - Market size and forecast 2025-2030 ($ million)
Data Table on The Netherlands - Market size and forecast 2025-2030 ($ million)
Chart on The Netherlands - Year-over-year growth 2025-2030 (%)
Data Table on The Netherlands - Year-over-year growth 2025-2030 (%)

12.5 APAC - Market size and forecast 2025-2030

Chart on APAC - Market size and forecast 2025-2030 ($ million)
Data Table on APAC - Market size and forecast 2025-2030 ($ million)
Chart on APAC - Year-over-year growth 2025-2030 (%)
Data Table on APAC - Year-over-year growth 2025-2030 (%)
Chart on Regional Comparison - APAC
Data Table on Regional Comparison - APAC

12.5.1 China - Market size and forecast 2025-2030

Chart on China - Market size and forecast 2025-2030 ($ million)
Data Table on China - Market size and forecast 2025-2030 ($ million)
Chart on China - Year-over-year growth 2025-2030 (%)
Data Table on China - Year-over-year growth 2025-2030 (%)

12.5.2 Japan - Market size and forecast 2025-2030

Chart on Japan - Market size and forecast 2025-2030 ($ million)
Data Table on Japan - Market size and forecast 2025-2030 ($ million)
Chart on Japan - Year-over-year growth 2025-2030 (%)
Data Table on Japan - Year-over-year growth 2025-2030 (%)

12.5.3 Australia - Market size and forecast 2025-2030

Chart on Australia - Market size and forecast 2025-2030 ($ million)
Data Table on Australia - Market size and forecast 2025-2030 ($ million)
Chart on Australia - Year-over-year growth 2025-2030 (%)
Data Table on Australia - Year-over-year growth 2025-2030 (%)

12.5.4 India - Market size and forecast 2025-2030

Chart on India - Market size and forecast 2025-2030 ($ million)
Data Table on India - Market size and forecast 2025-2030 ($ million)
Chart on India - Year-over-year growth 2025-2030 (%)
Data Table on India - Year-over-year growth 2025-2030 (%)

12.5.5 Singapore - Market size and forecast 2025-2030

Chart on Singapore - Market size and forecast 2025-2030 ($ million)
Data Table on Singapore - Market size and forecast 2025-2030 ($ million)
Chart on Singapore - Year-over-year growth 2025-2030 (%)
Data Table on Singapore - Year-over-year growth 2025-2030 (%)

12.5.6 Indonesia - Market size and forecast 2025-2030

Chart on Indonesia - Market size and forecast 2025-2030 ($ million)
Data Table on Indonesia - Market size and forecast 2025-2030 ($ million)
Chart on Indonesia - Year-over-year growth 2025-2030 (%)
Data Table on Indonesia - Year-over-year growth 2025-2030 (%)

12.6 South America - Market size and forecast 2025-2030

Chart on South America - Market size and forecast 2025-2030 ($ million)
Data Table on South America - Market size and forecast 2025-2030 ($ million)
Chart on South America - Year-over-year growth 2025-2030 (%)
Data Table on South America - Year-over-year growth 2025-2030 (%)
Chart on Regional Comparison - South America
Data Table on Regional Comparison - South America

12.6.1 Brazil - Market size and forecast 2025-2030

Chart on Brazil - Market size and forecast 2025-2030 ($ million)
Data Table on Brazil - Market size and forecast 2025-2030 ($ million)
Chart on Brazil - Year-over-year growth 2025-2030 (%)
Data Table on Brazil - Year-over-year growth 2025-2030 (%)

12.6.2 Argentina - Market size and forecast 2025-2030

Chart on Argentina - Market size and forecast 2025-2030 ($ million)
Data Table on Argentina - Market size and forecast 2025-2030 ($ million)
Chart on Argentina - Year-over-year growth 2025-2030 (%)
Data Table on Argentina - Year-over-year growth 2025-2030 (%)

12.6.3 Chile - Market size and forecast 2025-2030

Chart on Chile - Market size and forecast 2025-2030 ($ million)
Data Table on Chile - Market size and forecast 2025-2030 ($ million)
Chart on Chile - Year-over-year growth 2025-2030 (%)
Data Table on Chile - Year-over-year growth 2025-2030 (%)

12.7 Middle East and Africa - Market size and forecast 2025-2030

Chart on Middle East and Africa - Market size and forecast 2025-2030 ($ million)
Data Table on Middle East and Africa - Market size and forecast 2025-2030 ($ million)
Chart on Middle East and Africa - Year-over-year growth 2025-2030 (%)
Data Table on Middle East and Africa - Year-over-year growth 2025-2030 (%)
Chart on Regional Comparison - Middle East and Africa
Data Table on Regional Comparison - Middle East and Africa

12.7.1 UAE - Market size and forecast 2025-2030

Chart on UAE - Market size and forecast 2025-2030 ($ million)
Data Table on UAE - Market size and forecast 2025-2030 ($ million)
Chart on UAE - Year-over-year growth 2025-2030 (%)
Data Table on UAE - Year-over-year growth 2025-2030 (%)

12.7.2 South Africa - Market size and forecast 2025-2030

Chart on South Africa - Market size and forecast 2025-2030 ($ million)
Data Table on South Africa - Market size and forecast 2025-2030 ($ million)
Chart on South Africa - Year-over-year growth 2025-2030 (%)
Data Table on South Africa - Year-over-year growth 2025-2030 (%)

12.7.3 Saudi Arabia - Market size and forecast 2025-2030

Chart on Saudi Arabia - Market size and forecast 2025-2030 ($ million)
Data Table on Saudi Arabia - Market size and forecast 2025-2030 ($ million)
Chart on Saudi Arabia - Year-over-year growth 2025-2030 (%)
Data Table on Saudi Arabia - Year-over-year growth 2025-2030 (%)

12.7.4 Egypt - Market size and forecast 2025-2030

Chart on Egypt - Market size and forecast 2025-2030 ($ million)
Data Table on Egypt - Market size and forecast 2025-2030 ($ million)
Chart on Egypt - Year-over-year growth 2025-2030 (%)
Data Table on Egypt - Year-over-year growth 2025-2030 (%)

12.7.5 Oman - Market size and forecast 2025-2030

Chart on Oman - Market size and forecast 2025-2030 ($ million)
Data Table on Oman - Market size and forecast 2025-2030 ($ million)
Chart on Oman - Year-over-year growth 2025-2030 (%)
Data Table on Oman - Year-over-year growth 2025-2030 (%)

12.8 Market opportunity by geography

Market opportunity by geography ($ million)
Data Tables on Market opportunity by geography ($ million)

13. Drivers, Challenges, and Opportunity

13.1 Market drivers

Increasing participation in recreational boating and water-based leisure activities
Rising emphasis on asset protection and simplified maintenance for marine vessels
Expansion of waterfront residential and commercial infrastructure

13.2 Market challenges

Navigating stringent environmental regulations and complex permitting processes
High initial capital outlay and sensitivity to economic cycles
Vulnerability to supply chain disruptions and material price volatility

13.3 Impact of drivers and challenges

Impact of drivers and challenges in 2025 and 2030

13.4 Market opportunities

Integration of advanced automation and smart technology
Increasing adoption of sustainable and low-maintenance materials
Ascendancy of modular designs and product customization

14. Competitive Landscape

14.1 Overview

14.2

Overview on criticality of inputs and factors of differentiation

14.3 Landscape disruption

Overview on factors of disruption

14.4 Industry risks

Impact of key risks on business

15. Competitive Analysis

15.1 Companies profiled

Companies covered

15.2 Company ranking index

15.3 Market positioning of companies

Matrix on companies position and classification

15.4 AccuDock

AccuDock - Overview
AccuDock - Product / Service
AccuDock - Key offerings
SWOT

15.5 Duramax Marine LLC

Duramax Marine LLC - Overview
Duramax Marine LLC - Product / Service
Duramax Marine LLC - Key offerings
SWOT

15.6 EZ Dock

EZ Dock - Overview
EZ Dock - Product / Service
EZ Dock - Key offerings
SWOT

15.7 FLOE International Inc.

FLOE International Inc. - Overview
FLOE International Inc. - Product / Service
FLOE International Inc. - Key offerings
SWOT

15.8 Golden Manufacturing Inc.

Golden Manufacturing Inc. - Overview
Golden Manufacturing Inc. - Product / Service
Golden Manufacturing Inc. - Key offerings
SWOT

15.9 Hi Tide Boat Lifts

Hi Tide Boat Lifts - Overview
Hi Tide Boat Lifts - Product / Service
Hi Tide Boat Lifts - Key offerings
SWOT

15.10 HydroHoist Boat Lifts

HydroHoist Boat Lifts - Overview
HydroHoist Boat Lifts - Product / Service
HydroHoist Boat Lifts - Key offerings
SWOT

15.11 HydroHoist LLC

HydroHoist LLC - Overview
HydroHoist LLC - Product / Service
HydroHoist LLC - Key offerings
SWOT

15.12 Jetdock Systems Inc.

Jetdock Systems Inc. - Overview
Jetdock Systems Inc. - Product / Service
Jetdock Systems Inc. - Key offerings
SWOT

15.13 Midwest Industries Inc.

Midwest Industries Inc. - Overview
Midwest Industries Inc. - Product / Service
Midwest Industries Inc. - Key offerings
SWOT

15.14 Pier Pleasure Inc.

Pier Pleasure Inc. - Overview
Pier Pleasure Inc. - Product / Service
Pier Pleasure Inc. - Key offerings
SWOT

15.15 Porta-Dock Inc.

Porta-Dock Inc. - Overview
Porta-Dock Inc. - Product / Service
Porta-Dock Inc. - Key offerings
SWOT

15.16 Reimann and Georger Corp.

Reimann and Georger Corp. - Overview
Reimann and Georger Corp. - Product / Service
Reimann and Georger Corp. - Key offerings
SWOT

15.17 Rhino Inc.

Rhino Inc. - Overview
Rhino Inc. - Product / Service
Rhino Inc. - Key offerings
SWOT

15.18 ShoreMaster LLC

ShoreMaster LLC - Overview
ShoreMaster LLC - Product / Service
ShoreMaster LLC - Key offerings
SWOT

16. Appendix

16.1 Scope of the report

Market definition
Objectives
Notes and caveats

16.2 Inclusions and exclusions checklist

Inclusions checklist
Exclusions checklist

16.3 Currency conversion rates for US$

16.4 Research methodology

16.5 Data procurement

Information sources

16.6 Data validation

16.7 Validation techniques employed for market sizing

16.8 Data synthesis

16.9 360 degree market analysis

16.10 List of abbreviations

Research Methodology

Technavio presents a detailed picture of the market by way of study, synthesis, and summation of data from multiple sources. The analysts have presented the various facets of the market with a particular focus on identifying the key industry influencers. The data thus presented is comprehensive, reliable, and the result of extensive research, both primary and secondary.

INFORMATION SOURCES

Primary sources

  • Manufacturers and suppliers
  • Channel partners
  • Industry experts
  • Strategic decision makers

Secondary sources

  • Industry journals and periodicals
  • Government data
  • Financial reports of key industry players
  • Historical data
  • Press releases

DATA ANALYSIS

Data Synthesis

  • Collation of data
  • Estimation of key figures
  • Analysis of derived insights

Data Validation

  • Triangulation with data models
  • Reference against proprietary databases
  • Corroboration with industry experts

REPORT WRITING

Qualitative

  • Market drivers
  • Market challenges
  • Market trends
  • Five forces analysis

Quantitative

  • Market size and forecast
  • Market segmentation
  • Geographical insights
  • Competitive landscape

Interested in this report?

Get your sample now to see our research methodology and insights!

Download Now

Frequently Asked Questions

Boat Docks And Lifts market growth will increase by USD 300.8 million during 2026-2030.

The Boat Docks And Lifts market is expected to grow at a CAGR of 4.6% during 2026-2030.

Boat Docks And Lifts market is segmented by Application (Commercial, Household) Type (Boat docks, Boat lifts) Material (Wood, Plastic, Concrete, Metal)

AccuDock, Cellofoam North America Inc., Duramax Marine LLC, EZ Dock, FLOE International Inc., Golden Manufacturing Inc., Hi Tide Boat Lifts, HydroHoist Boat Lifts, HydroHoist LLC, IMM Quality Boat Lifts, Jetdock Systems Inc., Lift Tech Marine, Midwest Industries Inc., Pier Pleasure Inc., Porta-Dock Inc., Reimann and Georger Corp., Rhino Inc., ShoreMaster LLC, Sunstream Corp., Tide Tamer Waterfront Products are a few of the key vendors in the Boat Docks And Lifts market.

North America will register the highest growth rate of 56.7% among the other regions. Therefore, the Boat Docks And Lifts market in North America is expected to garner significant business opportunities for the vendors during the forecast period.

US, Canada, Mexico, Germany, France, Italy, UK, Spain, The Netherlands, China, Japan, Australia, India, Singapore, Indonesia, Brazil, Argentina, Chile, UAE, South Africa, Saudi Arabia, Egypt, Oman

  • Increasing participation in recreational boating and water-based leisure activities is the driving factor this market.

The Boat Docks And Lifts market vendors should focus on grabbing business opportunities from the Application segment as it accounted for the largest market share in the base year.